APPLICATION OF RESPONSE SURFACE METHODOLOGY (RSM) IN OPTIMIZATION OF
LACTIC ACID FERMENTATION OF CARROT
ADDITIVES AND GROWTH
*Arjun Chauhan and
Department of Food Science and Technology, Dr. Y. S. Parmar University of
Horticulture and Forestry, Solan, India
ARTICLE INFO ABSTRACT
Response surface methodology involving Central Composite Design (CCD) was applied to evaluate the effect of additives and growth stimulators with salt on natural lactic acid fermentation of carrot at room temperature. The variables investigate
MnSO
acidity (Lactic Acid), pH, per cent salt and Lactic Acid Bacterial count (LAB count). The statistical analysis
effect on lactic acid fermentation. % lactose, 1.5 % MgSO
titrable acidity (1.69% as compared to the lowest value of acidity obtained i.e. 1.50%), lowered pH (2.47 as compared to the highest value of pH obtained i.e.3.30) and increased LAB count (9 X 10 cfu/ml as compared to the lowest value of count obtained i.e.6.13 X 10
polynomial regression model determined that the desirable characteristics would be obtained at these concentrations of additives. Hence, the values for different a
in this study could successfully be employed for the lactic acid fermentation of carrot.
Copyright © Arjun Chauhan and Joshi, V. K. This is an open access article distributed under the Creative Commons Attribu unrestricted use, distribution, and reproduction in any medium, provided the original work is properly cited.
INTRODUCTION
Among different vegetables produced and consumed in India, carrot (Daucus carota), occupies a significant place in Indian diet. Carrot belongs to the family Umbelliferae, is a native of Europe and is grown as a winter season root crop. These highly regarded for their nutritional value because they are important source of provitamin A, thiamin, riboflavin, β carotene and are consumed either raw or cooked (Burns 1997). In the production time there is glut of crop in the market leading to the postharvest losses. Lactic acid fermentation of vegetables has successfully used as one of the alternatives for preservation and to provide healthful product with diversified taste for consumers (Joshi and Sharma 2009; Joshi 2011). This vegetable in its natural state can be preserved for a very short period only and thus, their availability to the consumers remains seasonal. Among different methods, fermentation is one of the oldest methods of food preservation in the world (Joshi and Sharma 2009). The natural lactic fermentation a natural process is brought about by the lactic acid bacteria (LAB) present in the raw food or those derived from a starter culture. Also, its bio-preservation nature has
*Corresponding author: Department of Food Science and
Technology, Dr. Y. S. Parmar University of Horticulture and Forestry, Solan, India
ISSN: 0975-833X
Article History:
Received 28th September, 2013
Received in revised form
14th October, 2013
Accepted 19th December, 2013
Published online 26th January,2014
Key words:
Lactic acid fermentation, Lactic acid bacteria, LAB,
Carrot, RSM, Salt,
Mustard MgSO4 and
MnSO4
RESEARCH ARTICLE
APPLICATION OF RESPONSE SURFACE METHODOLOGY (RSM) IN OPTIMIZATION OF
TIC ACID FERMENTATION OF CARROT: INFLUENCE OF ADDITION OF SALT,
ADDITIVES AND GROWTH STIMULATORS
*Arjun Chauhan and Joshi, V. K.
Department of Food Science and Technology, Dr. Y. S. Parmar University of
Horticulture and Forestry, Solan, India
ABSTRACT
Response surface methodology involving Central Composite Design (CCD) was applied to evaluate the effect of additives and growth stimulators with salt on natural lactic acid fermentation of carrot at room temperature. The variables investigated in this study were salt (2%
MnSO4 and Mustard (1%,1.5% and 2%) ; and various responses involved were per cent titrable
acidity (Lactic Acid), pH, per cent salt and Lactic Acid Bacterial count (LAB count). The statistical analysis of the results showed that, only the treatments having powdered mustard had an appreciable effect on lactic acid fermentation. The best results were obtained in the treatment with 2.5 % salt, 1.5
% lactose, 1.5 % MgSO4 + MnSO4 and 2.0 % mustard. These optimized concentrations increased
titrable acidity (1.69% as compared to the lowest value of acidity obtained i.e. 1.50%), lowered pH (2.47 as compared to the highest value of pH obtained i.e.3.30) and increased LAB count (9 X 10 cfu/ml as compared to the lowest value of count obtained i.e.6.13 X 10
polynomial regression model determined that the desirable characteristics would be obtained at these concentrations of additives. Hence, the values for different additives and growth stimulators optimized in this study could successfully be employed for the lactic acid fermentation of carrot.
This is an open access article distributed under the Creative Commons Attribu unrestricted use, distribution, and reproduction in any medium, provided the original work is properly cited.
Among different vegetables produced and consumed in India, ), occupies a significant place in Indian diet. Carrot belongs to the family Umbelliferae, is a native of Europe and is grown as a winter season root crop. These are highly regarded for their nutritional value because they are important source of provitamin A, thiamin, riboflavin, β- carotene and are consumed either raw or cooked (Burns 1997). In the production time there is glut of crop in the market e postharvest losses. Lactic acid fermentation of vegetables has successfully used as one of the alternatives for preservation and to provide healthful product with diversified taste for consumers (Joshi and Sharma 2009; Joshi et al., in its natural state can be preserved for a very short period only and thus, their availability to the consumers remains seasonal. Among different methods, fermentation is one of the oldest methods of food preservation . The natural lactic fermentation a natural process is brought about by the lactic acid bacteria (LAB) present in the raw food or those derived
preservation nature has
Department of Food Science and
Technology, Dr. Y. S. Parmar University of Horticulture and Forestry,
gained increasing attention as natural means for enhancing the shelf-life and safety of food products (Ananou
Joshi et al., 2011). LAB are present on the raw vegetables as constituents of natural microflora and this can be employed for
carrying out fermentation by adjusting the proper
concentrations of salt, additives and growth stimulators (Daeschel et al., 1987). Hence, at pre
majority of vegetables is done by naturally occurring lactic acid microflora rather than by defined starter cultures (Pederson 1971). Lactic acid fermentation of vegetables has been successfully employed as for preservation and to prov healthful products to the consumers (Joshi and Sharma 2009). Recently, Lactic acid fermented vegetables have been employed to make various products viz., Ready
drinks, sauces, appetizer and instant chutney mix powders with diversified taste and good acceptability (Joshi and Sharma 2010, Joshi et al., 2011). Salt has historically been used for directing the fermentation of cucumber, radish and carrot (Fleming et al. 1978, Hudson and Buescher 1985, Fleming
al., 1987). In LAF, salt withdraws w
nutrients from the vegetable tissue and the latter acts as the substrate for growth of lactic acid bacteria and thus, promoting anaerobiosis in the medium and inhibits the growth of unwanted microorganisms (Pederson 1971). Many ingre apart from salt can be used in the preparation of lactic acid
International Journal of Current Research
Vol. 6, Issue, 01, pp.4460-4467, January,2014
INTERNATIONAL
APPLICATION OF RESPONSE SURFACE METHODOLOGY (RSM) IN OPTIMIZATION OF
: INFLUENCE OF ADDITION OF SALT,
Department of Food Science and Technology, Dr. Y. S. Parmar University of
Response surface methodology involving Central Composite Design (CCD) was applied to evaluate the effect of additives and growth stimulators with salt on natural lactic acid fermentation of carrot at
d in this study were salt (2% - 3%), Lactose, MgSO4 +
and Mustard (1%,1.5% and 2%) ; and various responses involved were per cent titrable acidity (Lactic Acid), pH, per cent salt and Lactic Acid Bacterial count (LAB count). The statistical of the results showed that, only the treatments having powdered mustard had an appreciable The best results were obtained in the treatment with 2.5 % salt, 1.5 and 2.0 % mustard. These optimized concentrations increased titrable acidity (1.69% as compared to the lowest value of acidity obtained i.e. 1.50%), lowered pH
(2.47 as compared to the highest value of pH obtained i.e.3.30) and increased LAB count (9 X 10⁸
cfu/ml as compared to the lowest value of count obtained i.e.6.13 X 108). The second-order
polynomial regression model determined that the desirable characteristics would be obtained at these dditives and growth stimulators optimized in this study could successfully be employed for the lactic acid fermentation of carrot.
This is an open access article distributed under the Creative Commons Attribution License, which permits
gained increasing attention as natural means for enhancing the life and safety of food products (Ananou et al., 2007; 011). LAB are present on the raw vegetables as constituents of natural microflora and this can be employed for
carrying out fermentation by adjusting the proper
concentrations of salt, additives and growth stimulators 1987). Hence, at present fermentation of majority of vegetables is done by naturally occurring lactic acid microflora rather than by defined starter cultures (Pederson 1971). Lactic acid fermentation of vegetables has been successfully employed as for preservation and to provide healthful products to the consumers (Joshi and Sharma 2009). Recently, Lactic acid fermented vegetables have been employed to make various products viz., Ready- to-Serve drinks, sauces, appetizer and instant chutney mix powders with nd good acceptability (Joshi and Sharma 2011). Salt has historically been used for directing the fermentation of cucumber, radish and carrot . 1978, Hudson and Buescher 1985, Fleming et 1987). In LAF, salt withdraws water (plasmolysis) and nutrients from the vegetable tissue and the latter acts as the substrate for growth of lactic acid bacteria and thus, promoting anaerobiosis in the medium and inhibits the growth of unwanted microorganisms (Pederson 1971). Many ingredients apart from salt can be used in the preparation of lactic acid
fermented fruits and vegetables. These ingredients include, a source of nutrients such as sugars (Lactose), mineral salts (MgSO4 + MnSO4) and vitamins for fermentation causing microorganisms, help to restrict the growth of unwanted bacteria either through a regulatory effect on pH or by producing inhibitory substances and spices that have a final flavour determining role in fermented vegetables (Montet et
al., 1999). Mustard seeds in powdered form are also of great
interest and has been used by various workers for the lactic acid fermentation of vegetables with varying concentrations (Anand and Das 1971; Sethi 1990). Mustard, like other condiments and spices not only imparts flavour and taste to the food products but also possesses preservative action (Anand and Johar 1957). Response surface methodology (RSM) is a useful approach to identify the optimum operating conditions of a given system. This method is employed to find out how a particular objective is affected by a given set of operating conditions of interest, and identify the optimum operating conditions (Box et al., 1978; Giovanni 1983). The major advantage of RSM is to minimize the load of experiments as well as time (Tzeng et al., 2009). Keeping all these advantages and uses of lactic acid fermentation of carrot into consideration, the present study was conducted to determine the effect of salt, additives and growth stimulators on natural lactic acid fermentation of carrot at room temperature, employing a Central Composite Design (CCD) and Response Surface Methodology (RSM) in order to optimize their concentrations for natural lactic acid fermentation. The results obtained are summarized in this paper.
MATERIALS AND METHODS
Raw materials
Carrot, mustard and salt used in the experiments were procured from the local market. The chemicals, viz. Lactose,
Magnesium Sulphate (MgSO4), Manganese Sulphate
(MnSO4) were of analytical grade and obtained from CDH ®.
Experimental design for optimization of lactic acid fermentation
Response surface methodology was applied to the
experimental data using a commercial statistical package (Design expert, Trial version 8.0.5.2, State Ease Inc., Minneapolis, IN statistical software) for the generation of response surface plot and optimization of process variables. A factorial experiment was used to study the effects of various independent variables viz., salt (A), lactose (B), MgSO4 + MnSO4 (C) and mustard (D) on the response variables such as per cent titrable acidity (Y1), pH (Y2), per cent salt (Y3) and LAB count (Y4) of lactic acid fermentation of carrot. The averages from three replicated values of each run were taken as dependent variables or responses. For the statistical analysis, the numerical levels were standardized to -1, 0 and +1 (Table 1). The standard scores were fitted to a quadratic polynomial regression model for predicting individual Y
responses by employing at least square technique
(Wanasaundara and Shahidi 1966). The second order polynomial equation was fitted to the experimental data of each dependent variable as given. The model proposed to each response of Y was:
= + ∑ + ∑ + ∑ ---1
[image:2.595.310.553.212.282.2]Where βo, βi, βij are intercepts, quadratic regression coefficient terms Xi and Xj are independent variables. The model permitted evaluation of quadratic terms of the independent variables on the dependent variable. The response surface and contour plot were generated for different interactions of any two independent variables, where holding the value of third variables as constant at central level. The optimization of the process was aimed at finding the optimum values of independent variables.
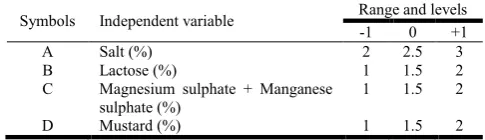
Table 1. Process variables and their levels of experimental design
Symbols Independent variable Range and levels
-1 0 +1
A Salt (%) 2 2.5 3
B Lactose (%) 1 1.5 2
C Magnesium sulphate + Manganese
sulphate (%)
1 1.5 2
D Mustard (%) 1 1.5 2
Statistical Analysis
Response Surface Methodology (RSM) was used to estimate the main effects of salt, lactose, MgSO4 + MnSO4, and mustard on lactic acid fermentation process. A central composite design was used with salt (2%, 2.5% and 3%), lactose (1%, 1.5% and 3%), MgSO4 + MnSO4 (1%, 1.5% and 3%) and mustard (1%, 1.5% and 3%) being the independent process variables (Table 1). For the generated 30 experiments, RSM was applied to the experimental data using design expert 8 (Design expert, Trial version 8.0.5.2, State Ease Inc., Minneapolis, IN statistical software). Data were statistically analyzed by using RSM (F test for analysis of variance ANOVA).
Lactic acid fermentation
Fermentation of carrot was performed similar to that practiced for sauerkraut fermentation and as done in our earlier studies (Joshi et al., 2009). Optimally mature roots of carrot were washed, peeled and grated into shreds. The required concentration of salt (2%, 2.5% and 3%) along with additives and growth stimulators (1%, 1.5% and 3%) were added uniformly throughout the mass of shredded carrot. The shredded carrots were then packed tightly into the glass jars and then weighed down to expel the air in-between. During fermentation, the surface of carrot shreds was covered with a plastic bag. Sufficient water was added into the bag so that the carrot shreds slide down into the brine until the surface of the uppermost shreds was covered with the brine. The shreds were allowed to ferment at room temperature (25+2°C) in the
laboratory. Appropriate parameters of Lactic Acid
Fermentation viz. % titratable acidity, pH, % salt and LAB (Lactic acid bacteria) count were measured after the completion of Lactic Acid Fermentation (when no more acid was produced).
Analytical methods
Spain) that was standardized with buffers of pH 4.0 and 7.0 before pH measurements. Titratable acidity and per cent salt estimation was measured bv the method of AOAC (1980) and Ranganna (2010), respectively.
LAB Count
Lactic Acid Bacterial (LAB) count of microorganisms was taken according to the method given by Harrigan and McCance (1996) using MRS agar media having composition (g/L): Peptic digest of animal tissue (10), yeast extract (5), beef extract (8), dextrose (20), polysorbate 80 (1), ammonium citrate (2), sodium acetate (5), magnesium sulphate (0.2), manganese sulphate (0.05), dipotassium phosphate (2) and agar (12). pH at 25oC of the medium was adjusted to 5.7+0.2. Incubation temperature for the cultures was 37+1oC.
RESULTS AND DISCUSSION
Experimental results of various responses
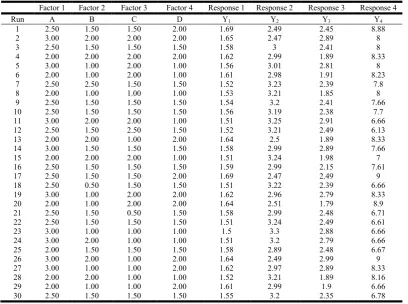
Table 2 reveals the experimental results of various responses (Y1, Y2, Y3 and Y4). It is discernible from the table that addition of the various additives and growth stimulators along with salt, especially mustard has resulted in imparting the desirable characteristics to the products (increased acidity, lowered pH, high LAB count). Mustard seeds contain allyl isothiocynate, a volatile aromatic compound with antibacterial and antifungal properties which may be responsible for the desired characters. Ground mustard seeds or oil have been used to increase lactic acid levels during fermentation of turnip (Anand and Das 1971). Among all the 30 runs employed, the range of per cent titrable acidity, pH, per cent salt and LAB count varied from 1.50% – 1.69%, 2.47 – 3.25, 1.79% - 2.99%
and 6.13 – 9 X 10⁸, respectively. The highest per cent titrable
acidity, lowest pH and highest LAB count was obtained with the Run 17 having salt- 2.5%, lactose- 1.5%, MgSO4 + MnSO4- 1.5% and mustard- 2 %. Addition of lactose at this concentration would have proved a potential energy substrate for lactic acid bacteria. However, the alternation (increase or decrease) in the concentration of the variables resulted in remarkable changes in the responses. For instance, at salt- 3%, lactose- 2%, MgSO4 + MnSO4- 1% and mustard- 1%, the per cent titrable acidity, pH, per cent salt and LAB count were
recorded to be 1.51%, 3.2, 2.79% and 6.66 X 10⁸, respectively
which were less in magnitude as desirable. Hence, it can be inferred that their concentration at a moderate range is favourable for the lactic acid fermentation of carrot. This may be due to the favourable condition being generated inside the fermentation vessel by supporting the development of anaerobic conditions for the growth of LAB and hence,
increasing the acidity and lowering the pH (Buckenhuskes
et al., 1988). Also, this concentration of salt (2.5 %) has been
successfully used in the lactic acid fermentation of radish for shelf-stability and pickling (Joshi and Sharma 2009). It is also clear from the table that Y3 (per cent salt) remained more or less the same as it was added initially in the fermentation vessel indicating that salt was used for the stimulation of LAB and has not been used up.
Fitting Models
[image:3.595.95.504.73.377.2]Experiments were performed according to the CCD experimental design given in Table 2 in order to search for the optimum combination of various parameters for the lactic acid fermentation of carrot. The experimental results along with the theoretically predicted values of all the responses are shown in Table 2. The responses of the CCD designs were fitted in the Table 2. Experimental design and results of the central composite design of 30 experiments for lactic acid fermentation of carrot
Factor 1 Factor 2 Factor 3 Factor 4 Response 1 Response 2 Response 3 Response 4
Run A B C D Y1 Y2 Y3 Y4
1 2.50 1.50 1.50 2.00 1.69 2.49 2.45 8.88
2 3.00 2.00 2.00 2.00 1.65 2.47 2.89 8
3 2.50 1.50 1.50 1.50 1.58 3 2.41 8
4 2.00 2.00 2.00 2.00 1.62 2.99 1.89 8.33
5 3.00 1.00 2.00 1.00 1.56 3.01 2.81 8
6 2.00 1.00 2.00 1.00 1.61 2.98 1.91 8.23
7 2.50 2.50 1.50 1.50 1.52 3.23 2.39 7.8
8 2.00 1.00 1.00 1.00 1.53 3.21 1.85 8
9 2.50 1.50 1.50 1.50 1.54 3.2 2.41 7.66
10 2.50 1.50 1.50 1.50 1.56 3.19 2.38 7.7
11 3.00 2.00 2.00 1.00 1.51 3.25 2.91 6.66
12 2.50 1.50 2.50 1.50 1.52 3.21 2.49 6.13
13 2.00 2.00 1.00 2.00 1.64 2.5 1.89 8.33
14 3.00 1.50 1.50 1.50 1.58 2.99 2.89 7.66
15 2.00 2.00 2.00 1.00 1.51 3.24 1.98 7
16 2.50 1.50 1.50 1.50 1.59 2.99 2.15 7.61
17 2.50 1.50 1.50 2.00 1.69 2.47 2.49 9
18 2.50 0.50 1.50 1.50 1.51 3.22 2.39 6.66
19 3.00 1.00 2.00 2.00 1.62 2.96 2.79 8.33
20 2.00 1.00 2.00 2.00 1.64 2.51 1.79 8.9
21 2.50 1.50 0.50 1.50 1.58 2.99 2.48 6.71
22 2.50 1.50 1.50 1.50 1.51 3.24 2.49 6.61
23 3.00 1.00 1.00 1.00 1.5 3.3 2.88 6.66
24 3.00 2.00 1.00 1.00 1.51 3.2 2.79 6.66
25 2.00 1.50 1.50 1.50 1.58 2.89 2.48 6.67
26 3.00 2.00 1.00 2.00 1.64 2.49 2.99 9
27 3.00 1.00 1.00 2.00 1.62 2.97 2.89 8.33
28 2.00 2.00 1.00 1.00 1.52 3.21 1.89 8.16
29 2.00 1.00 1.00 2.00 1.61 2.99 1.9 6.66
mathematical expression of relationship in terms of coded factors with variables as shown below:
Y1 = 1.56 - 3.889 X 10⁻³ A - 2.917 X 10⁻³B + 1.250 X 10⁻³C + 0.052D + 6.875 X 10⁻³ AB - 6.250 X 10⁻⁴AC - 0.012BC + 0.013BD - 6.875 X 10⁻³CD - 8.000 X 10⁻⁴A2 - 0.013B2 - 4.475 X 10⁻³C2 + 0.038D2 ---(1)
Y2 = 3.07 + 6. X 10-3A - 0.023B - 8.333 X 10⁻⁴ C - 0.24D - 0.067AB - 5.000 X 10⁻³ AC - 0.014AD + 0.098BC - 0.086BD + 0.026CD + 0.014A2 + 0.048B2 + 0.017C2 - 0.21D2 …..…(2)
Y3 = 2.44 +0.46A + 0.017B - 3.750 X 3C + 0.019D + 6.250 X 10⁻⁴AB - 0.012AC + 0.021AD + 0.021BC + 0.011BD - 0.032CD + 0.11A2 - 0.021B2 + 3.150 X 10⁻³ C2 - 0.13D2 …….(3)
Y4 = 7.40 + 1.111 X 3A + 0.096B + 0.062C + 0.47D-1.875 X 10⁻³AB + 1.875 X 10⁻³AC + 0.37AD - 0.31BC + 0.30BD + 0.11CD - 0.26A2 - 0.045B2 - 0.25C2 + 1.04D2 …..(4)
where Y1, Y2, Y3 and Y4 are per cent titrable acidity, pH , per
cent salt and LAB count (cfu X 108) respectively, and A, B, C
[image:4.595.118.474.220.456.2]and D are the coded values of the test variables, salt, lactose, MgSO4 + MnSO4 and mustard respectively. The statistical
Table 3. Analysis of variance (ANOVA) for Response Surface Quadratic Model for titrable acidity during lactic acid fermentation of carrot
Source Sum of Squares Df Mean Square F Value p-value
Prob > F
Model 0.074 14 5.315E-003 6.79 0.0003*
A 2.722E-004 1 2.722E-004 0.35 0.5641
B 2.042E-004 1 2.042E-004 0.26 0.6169
C 3.750E-005 1 3.750E-005 0.048 0.8297
D 0.044 1 0.044 56.56 < 0.0001*
AB 7.563E-004 1 7.563E-004 0.97 0.3411
AC 6.250E-006 1 6.250E-006 7.989E-003 0.9300
AD 7.563E-004 1 7.563E-004 0.97 0.3411
BC 2.256E-003 1 2.256E-003 2.88 0.1101
BD 2.756E-003 1 2.756E-003 3.52 0.0801*
CD 7.562E-004 1 7.562E-004 0.97 0.3411
A2 2.087E-006 1 2.087E-006 2.668E-003 0.9595
B2 4.853E-003 1 4.853E-003 6.20 0.0250*
C2 5.556E-004 1 5.556E-004 0.71 0.4126
D2 4.628E-003 1 4.628E-003 5.92 0.0280*
Residual 0.012 15 7.823E-004
Lack of Fit 6.785E-003 9 7.539E-004 0.91 0.5666NS
R-Squared 0.8638
Adj R-Squared 0.7366
Pred R-Squared 0.4015
Adeq Precision 8.475
(Df- Degree of freedom, NS- Not Significant, *- 5 % level of Significance)
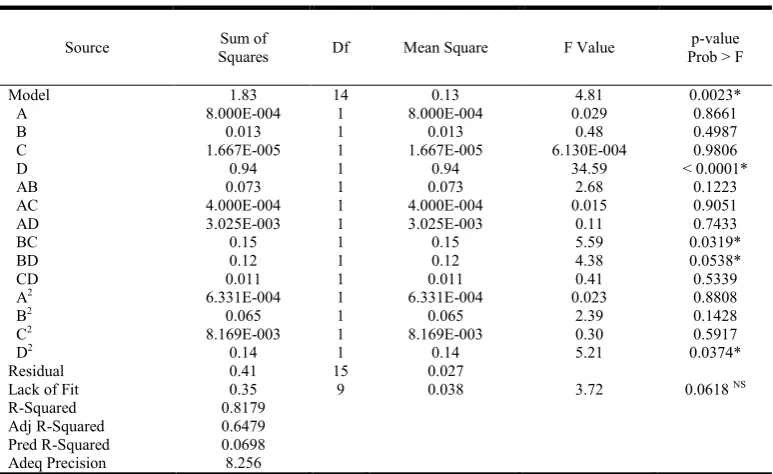
Table 4. ANOVA for Response Surface Quadratic Model for pH during lactic acid fermentation of carrot
Source Sum of
Squares Df Mean Square F Value
p-value Prob > F
Model 1.83 14 0.13 4.81 0.0023*
A 8.000E-004 1 8.000E-004 0.029 0.8661
B 0.013 1 0.013 0.48 0.4987
C 1.667E-005 1 1.667E-005 6.130E-004 0.9806
D 0.94 1 0.94 34.59 < 0.0001*
AB 0.073 1 0.073 2.68 0.1223
AC 4.000E-004 1 4.000E-004 0.015 0.9051
AD 3.025E-003 1 3.025E-003 0.11 0.7433
BC 0.15 1 0.15 5.59 0.0319*
BD 0.12 1 0.12 4.38 0.0538*
CD 0.011 1 0.011 0.41 0.5339
A2 6.331E-004 1 6.331E-004 0.023 0.8808
B2 0.065 1 0.065 2.39 0.1428
C2 8.169E-003 1 8.169E-003 0.30 0.5917
D2 0.14 1 0.14 5.21 0.0374*
Residual 0.41 15 0.027
Lack of Fit 0.35 9 0.038 3.72 0.0618 NS
R-Squared 0.8179
Adj R-Squared 0.6479
Pred R-Squared 0.0698
Adeq Precision 8.256
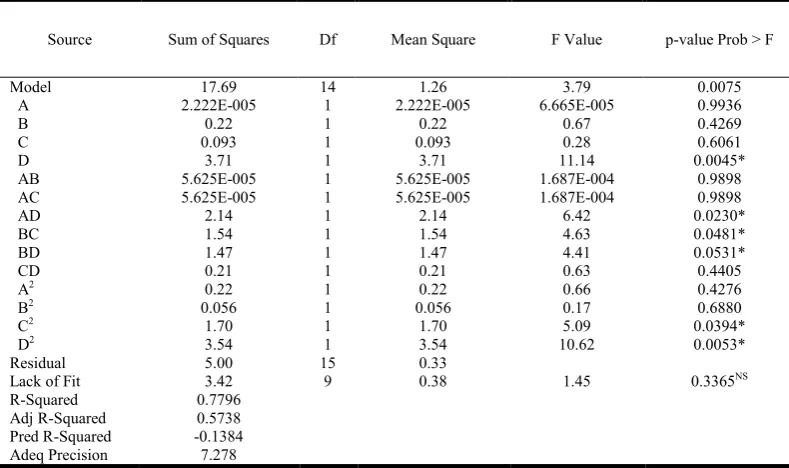
[image:4.595.104.491.504.741.2]significance of the model equations were evaluated by the F test for analysis of variance (ANOVA). The results of multiple linear regressions conducted for the second order response surface model are given in Table (3-6). The significance of each coefficient was determined by Student's t-test and p-values. Model F-values of 6.79, 4.81, 11.86 and 3.79 for Y1, Y2, Y3 and Y4 respectively, imply that the models were significant; there is only 0.03%, 0.23%, 0.01% and 0.75% chances respectively that a "Model F-Value" this large could occur due to noise. Table 3-6 reveal that for titrable acidity D, BD, B2 and D2 were significant model terms; for pH D, BC, BD and D2 were significant; for salt estimation A was significant model terms; whereas, in case of LAB count D, AD, BC, BD, C2 and D2 were significant model terms. The "Lack of Fit F-values" of 0.0067, 0.35, 0.29 and 3.42 for Y1,
Y2, Y3 and Y4 respectively, imply that the Lack of Fit is not significant relative to the pure error which indicates towards the fitness of models. The goodness of fit of the models were checked by the determination coefficient (R2). All the independent variables showed the values of R2 to be > 0.75 and "Adeq Precision" greater than 4 which indicated aptness of the model and adequate signal respectively. Hence, the models were used to navigate the design spaces (Box et al., 1978)
3D RESPONSE SURFACE GRAPHS
[image:5.595.107.488.74.310.2]Response surface plots as a function of two factors at a time, maintaining all other factors at fixed levels are more helpful in understanding both the main and the interaction effects of these two factors. These plots can be easily obtained by Table 5. ANOVA for Response Surface Quadratic Model for per cent salt during lactic acid fermentation of carrot
Source Sum of Squares Df Mean Square F Value p-value Prob > F
Model 3.90 14 0.28 11.86 < 0.0001*
A 3.79 1 3.79 161.27 < 0.0001*
B 7.004E-003 1 7.004E-003 0.30 0.5932
C 3.375E-004 1 3.375E-004 0.014 0.9062
D 5.720E-003 1 5.720E-003 0.24 0.6289
AB 6.250E-006 1 6.250E-006 2.659E-004 0.9872
AC 2.256E-003 1 2.256E-003 0.096 0.7610
AD 6.806E-003 1 6.806E-003 0.29 0.5984
BC 6.806E-003 1 6.806E-003 0.29 0.5984
BD 1.806E-003 1 1.806E-003 0.077 0.7854
CD 0.016 1 0.016 0.69 0.4186
A2 0.036 1 0.036 1.54 0.2343
B2 0.012 1 0.012 0.50 0.4899
C2 2.753E-004 1 2.753E-004 0.012 0.9152
D2 0.054 1 0.054 2.28 0.1514
Residual 0.35 15 0.024
Lack of Fit 0.29 9 0.032 2.83 0.1089NS
R-Squared 0.9171
Adj R-Squared 0.8398
Pred R-Squared 0.7601
Adeq Precision 10.489
(Df- Degree of freedom, NS- Not Significant, *- 5 % level of Significance)
Table 6. ANOVA for Response Surface Quadratic Model for LAB count (cfu X 108) during lactic acid fermentation of carrot
Source Sum of Squares Df Mean Square F Value p-value Prob > F
Model 17.69 14 1.26 3.79 0.0075
A 2.222E-005 1 2.222E-005 6.665E-005 0.9936
B 0.22 1 0.22 0.67 0.4269
C 0.093 1 0.093 0.28 0.6061
D 3.71 1 3.71 11.14 0.0045*
AB 5.625E-005 1 5.625E-005 1.687E-004 0.9898
AC 5.625E-005 1 5.625E-005 1.687E-004 0.9898
AD 2.14 1 2.14 6.42 0.0230*
BC 1.54 1 1.54 4.63 0.0481*
BD 1.47 1 1.47 4.41 0.0531*
CD 0.21 1 0.21 0.63 0.4405
A2 0.22 1 0.22 0.66 0.4276
B2 0.056 1 0.056 0.17 0.6880
C2 1.70 1 1.70 5.09 0.0394*
D2 3.54 1 3.54 10.62 0.0053*
Residual 5.00 15 0.33
Lack of Fit 3.42 9 0.38 1.45 0.3365NS
R-Squared 0.7796
Adj R-Squared 0.5738
Pred R-Squared -0.1384
Adeq Precision 7.278
[image:5.595.99.494.349.583.2]calculating from the model, the values taken by one factor where the second varies with constraint of a given Y value. The response surface curves were plotted to understand the interaction of the variables and to determine the optimum level of each variable for maximum response. The response surface curves for Y1, Y2, Y3 and Y4 are shown in Figure 1. The nature of the response surface curves shows the interaction between the variables. From figures it was observed that the elliptical nature of the contour in 3D-response surface graphs depict the mutual interactions of all the variables in providing significant effect on responses. In general all the additives contributed commutatively towards the fermentation process by increasing the acidity and LAB count; and lowe
However, the analysis of the results and response graphs showed that, in the range studied, only the treatments having grounded mustard had an appreciable effect on lactic acid fermentation w.r.t these desirable characteristics.
surface graph (Fig. 1a) depicts the main effect and interaction of lactose and salt on titrable acidity while keeping the concentration of mustard and MgSO4 + MnSO4 constant at 2.0%.
It is clear from the shape of the graph that with the increase in the concentration of additives and growth stimulators, there was increase in the titrable acidity. Maximum acidity was achieved at salt (2.5%), lactose (1.5%), mustard (2%) and MgSO4 + MnSO4 (1.5%). It’s also clear from the graph that the titrable acidity decreased to 1.50 when lactose and salt were at 1 and 1 per cent, respectively. It is app
concentration of lactose and salt was less and not optimum. This reduced acidity was obtained in our earlier work (Joshi
et al., 2008). Fig. 1b depicts the interaction of various
variables on pH in the form of 3D response graph.
inferred from the graph that ph was indirectly proportional to the concentration of variables used in the experiments. The lowest value of ph was desirable for the fermentation processs. The lowest ph was observed when fermentation was carried out at salt (2.5%), lactose (1.5%), mustard (2 %) and MgSO4 + MnSO4 (1.5%). Lowering of ph helps to prevent the growth of pathogenic and undesirable microorganisms which leads to biopreservation.
The interactions between lactose and salt at 1.5 % of musta and MgSO4 + MnSO4 on per cent salt estimation is depicted in the form of 3D Response surface graph (Fig. 1c) flattened and straight slope of response plots indicated that the estimation of salt content did not show any specific pattern or alterations and neither this was expected except that equilibrium salt contents are relevant for the LAB to grow and show the activities. The main function of salt is to stimulate the LAB and it can neither be excreted nor synthesized, therefore its concentration did not vary in the entire process. Similar but little elliptical graph was observed in case of LAB count as compared to the response graph of titrable acidity which also indicated that the variables under study have significant effect on LAB count (Fig. 1d). Maximum bacterial count was observed when the fermentation was carried out by using salt (2.5%), lactose (1.5%), mustard (2 %) and MgSO4 + MnSO4 (1.5%). However, close to this value of LAB count was observed at lactose, mustard, MgSO4 + MnSO4 (1 and salt (2-2.5%). Further, it is evident from the magnitude of P and F values that there is maximum positive contribution of
ng from the model, the values taken by one factor where the second varies with constraint of a given Y value. The response surface curves were plotted to understand the interaction of the variables and to determine the optimum level ximum response. The response surface curves for Y1, Y2, Y3 and Y4 are shown in Figure 1. The nature of the response surface curves shows the interaction between the variables. From figures it was observed that the ponse surface graphs depict the mutual interactions of all the variables in providing significant effect on responses. In general all the additives contributed commutatively towards the fermentation process by increasing the acidity and LAB count; and lowering the pH. However, the analysis of the results and response graphs showed that, in the range studied, only the treatments having grounded mustard had an appreciable effect on lactic acid fermentation w.r.t these desirable characteristics. The response urface graph (Fig. 1a) depicts the main effect and interaction of lactose and salt on titrable acidity while keeping the concentration of mustard and MgSO4 + MnSO4 constant at
It is clear from the shape of the graph that with the increase in the concentration of additives and growth stimulators, there acidity. Maximum acidity was achieved at salt (2.5%), lactose (1.5%), mustard (2%) and MgSO4 + MnSO4 (1.5%). It’s also clear from the graph that the titrable acidity decreased to 1.50 when lactose and salt were at 1 and 1 per cent, respectively. It is apparent that this concentration of lactose and salt was less and not optimum. This reduced acidity was obtained in our earlier work (Joshi
., 2008). Fig. 1b depicts the interaction of various variables on pH in the form of 3D response graph. It can be inferred from the graph that ph was indirectly proportional to the concentration of variables used in the experiments. The lowest value of ph was desirable for the fermentation processs. The lowest ph was observed when fermentation was carried ut at salt (2.5%), lactose (1.5%), mustard (2 %) and MgSO4 + MnSO4 (1.5%). Lowering of ph helps to prevent the growth of pathogenic and undesirable microorganisms which leads to
The interactions between lactose and salt at 1.5 % of mustard and MgSO4 + MnSO4 on per cent salt estimation is depicted in the form of 3D Response surface graph (Fig. 1c). The flattened and straight slope of response plots indicated that the estimation of salt content did not show any specific pattern or ns and neither this was expected except that equilibrium salt contents are relevant for the LAB to grow and show the activities. The main function of salt is to stimulate the LAB and it can neither be excreted nor synthesized, id not vary in the entire process. Similar but little elliptical graph was observed in case of LAB count as compared to the response graph of titrable acidity which also indicated that the variables under study have ). Maximum bacterial count was observed when the fermentation was carried out by using salt (2.5%), lactose (1.5%), mustard (2 %) and MgSO4 + MnSO4 (1.5%). However, close to this value of LAB count was observed at lactose, mustard, MgSO4 + MnSO4 (1-1.5 %) 2.5%). Further, it is evident from the magnitude of P and F values that there is maximum positive contribution of
(a)
(b)
(c)
Design-Expert® Software Factor Coding: Actual ACIDITY
Design points above predicted value
Design points below predicted value
1.69
1.5
X1 = A: SALT X2 = B: LACTOSE
Actual Factors C: MAGNESIUM = 1.50 D: MUSTARD = 1.50
1.60 1.80 2.00 1.5 1.55 1.6 1.65 1.7 A CIDITY B: LACTOSE Design-Expert® Software Factor Coding: Actual PH
Design points above predicted value
Design points below predicted value
3.3
2.47
X1 = A: SALT X2 = B: LACTOSE
Actual Factors C: MAGNESIUM = 1.50 D: MUSTARD = 1.50
(d)
Fig.1. 3D Response surface graph of carrot fermentation depicting the interactions between Lactose and Salt at 1.5 %
Mustard and Mg SO4 + MnSO4 on Acidity (a), pH (b) Salt (c) and
LAB count (d)
all the variables viz., salt , lactose , mustard and MgSO4 + MnSO4 on the various responses: titrable acidity, pH and LAB count during the lactic acid fermentation of carrot (Tables 3 – 6).
Optimum concentrations of additives and growth stimulators
Optimum concentrations of salt, additives and growth stimulators for lactic acid fermentation of carrot was determined to obtain the best results w.r.t the desirable characteristics i.e. increased titrable acidity, low pH and high LAB count for Lactic Acid Fermentation. Second order polynomial models obtained in this study were utilized for each response in order to determine the specified optimum concentrations of salt, additives and growth stimulators. The sequential quadratic programming using design expert 8.0.5.2 was used to solve the second degree polynomial regression equation. The optimum values obtained by substituting the respective coded values of variables are: salt – 2.5%, lactose- 1.5 %, MgSO4 + MnSO4 – 1.5 % and mustard 2 %. At this point, all the desirable characteristics were achieved to be the best in fermentation process as these optimized concentrations increased titrable acidity (1.69% as compared to the lowest value of acidity obtained i.e. 1.5%), lowered pH (2.47 as compared to the highest value of pH obtained i.e.3.30) and
increased LAB count (9 X 10⁸ cfu/ml as compared to that
obtained with the lowest value of 6.13 X 10⁸).
Conclusion
In this study, RSM was used to determine the optimum operating conditions that yield increased titrable acidity, low pH and high LAB count for Lactic Acid Fermentation of carrot. Analysis of variance has shown that the effects of all
the process variables including salt, lactose, MgSO4 + MnSO4 and mustard were statistically significant. Second order polynomial models were obtained for predicting per cent titrable acidity, salt, pH and LAB count. Among 30 runs conducted, run 2 has got the optimum concentration of salt – 2.5%, lactose- 1.5 %, MgSO4 + MnSO4 – 1.5 % and mustard - 2 % for lactic acid fermentation of carrot.
Acknowledgment
The financial support provided by Horticulture Mini Mission, Government of India is highly acknowledged.
REFERENCES
Anand JC, Das L .1971. Effects of condiments on lactic fermentation in sweet turnip pickle. J. Food Sci. Technol., 8(3): 143.
Anand JC, Johar DS .1957. Effect of condiments on control of Aspergillus niger in mango pickle. J. Sci. Indus. Res., 16A: 370.
Ananou S, Maqueda M, Martínez-Bueno M, Valdivia E .2007. Biopreservation, an ecological approach to improve the safety and shelf-life of foods Communicating Current Research and Educational Topics and Trends in Applied Microbiology
Aoac. 1980. Official methods of analysis, 13th edn, Association of Official Analytical Chemists, Washington DC
BOX GEP, Hunter WG, Hunter JS. 1978. Statistics for Experimenters, pp. 91-334, John Wiley & Sons. New York. NY.
Burns EE .1997. Carrots. In: Processing Vegetables Science and Technology. D.S. Smith, J.N. Cash, W.K. Nip, Y.H. Hue (eds.). Technomic Publishing Co., Ind. Lancaster, USA.
Daeschal MA, Andersson RE, Fleming HP .1987. Microbial ecology of fermenting plant materials. FEMS Microbial
Rev., 46: 357-367.
Fleming HP, Mcfeeters RF, Thompson RL .1987. Effects of sodium chloride concentration on fermness retention of cucumbers fermented and stored with calcium chloride. J.
Food Sci., 52: 653-657.
Fleming HP, Thompson RL, Bell TA, Hontz LH .1978. Controlled fermentation of sliced cucumbers. J. Food Sci., 43: 888.
Giovanni WA. 1983. Response surface methodology and product optimization. Food Technol. 37, 41-45.
Harrigan WF, McCance EM .1966. (eds.) Laboratory Methods in Microbiology. 2nd edn. Academic Press, London. Hudson JM, Buescher RW .1985. Pectic susbtances and
firmness of cucumber pickles as influenced by CaCl2, NaCl and brine storage. J. Food Biochem., 9: 211-215. Joshi VK, Sharma Somesh. 2010. Preparation and evaluation
of sauces from lactic acid fermented vegetables. Journal of
food science and technology. 47(2). 214-218
Joshi VK, Somesh Sharma .2009. Lactic acid fermentation of radish for self stability and pickling. Natural Product
Radiance. 8(1). 19-24
Joshi VK, Somesh Sharma, Neerja Rana .2011. Preparation and evaluation of appetizers from lactic acid fermented vegetables. Journal of Hill Agriculture. 2(1). 20-27
Design-Expert® Software Factor Coding: Actual SALT
Design points above predicted value
Design points below predicted value
2.99
1.79
X1 = A: SALT X2 = B: LACTOSE
Actual Factors C: MAGNESIUM = 1.50 D: MUSTARD = 1.50
1.00 1.20 1.40 1.60 1.80 2.00
2.00 2.20
2.40 2.60
2.80 3.00 2
2.2 2.4 2.6 2.8 3 3.2
SALT
Joshi VK, Sharma S, Thakur NS. 2008. Effect of temperature, salt concentration and type of microorganism on lactic acid fermentation of carrot. Acta Aliment 37:205–219
Montet D, Loiseau G, Zakhia N, Mouquet C .1999. Fermented
fruits and vegetables. In: Biotechnology: Food
Fermentation. Vol. II. V.K. Joshi and Ashok Pandey (eds.).
Edu. Publ. Distri., New Delhi. pp. 951-969.
Pederson CS.1971. In: Microbiology of Food Fermentation. AVI Publishing Co. Inc., Westport, Connecticut, pp. 108-152.
Ranganna S .1986. Handbook of Analysis of Quality Control for Fruit and Vegetable Products. 2nd Edn. Tata McGraw Hill Publ. Co., New Delhi.
Sethi V. 1990. Lactic fermentation of black carrot juice for spiced beverage. Indian Food Packer, 44(3): 7-12.
Tzeng Daw-I, Chao-Ying Tai, Yi-Chen Chia, Yeu-Pyng Lin, Andi Shau-Mei Oi. 2009. Investigation of fermenting conditions for sugarcane (Saccharum Officinarum l.) Wine using response surface methodology. Journal of food
processing and preservation. 33. 330-346
Wanasundara F, Shahidi. 1996. Optimization of hexa metaphosphate-Assisted Extraction of Flaxseed Proteins Using Response Surface Methodology. Journal of Food
Science, Volume 61, Issue 3, pages 604-607.