MULTISPECTRAL BAND IMAGE COMPRESSION USING WAVELETS
Kousalyadevi, R. and Ramakrishnan, S.S.
Institute of Remote Sensing, College of Engineering, Guindy, Anna
ARTICLE INFO ABSTRACT
Multi-use planning is compressed using Discrete Wavelet Transform to reduce storage capacity and transmission bandwidth in an efficient and effective manner. This paper explains the use of 2D Discrete Wavelet Transform for compression of Lan
analysis of its performance using various parameters such as Compression Ratio (CR), Peak Signal to Noise Ratio (PSNR), Digital Number Minimum (DN min) and Digital Number Maximum (DN max). Various wavelets are
is analyzed. Using those values, the Spectral Signature graph is plotted and a particular wavelet is selected based on the parameter values.
INTRODUCTION
All substances including living things have their own spectrum characteristics or diagnostic absorption features. Moreover, at the time we gain high resolution spectrum information, we generate massively large image data sets. Access and transport of these data sets will stress existing processing, storage and transmission capabilities. Therefore, efficient compression should be applied to these data sets before storage and transmission. The compression schemes used in the data sets can be classified as lossless or lossy. In lossless compression, there is a perfect reconstruction of original data after decompression but the storage capacity acquired and transmission bandwidth are high
compression, the image is reconstructed to the required level.
Wavelet analysis
The development of wavelets can be linked to several separate trains of thought, starting with Haar's work in the early 20th century. Wavelet means a “small wave”. The smallness implies to a window function of finite length. Wavelets are functions that satisfy certain mathematical requirements and are used in representing data or other functions. A wavelet is a waveform of effectively limited duration that has an average value of zero. Wave in itself refers to the condition that this function is oscillatory. And .Wavelet analysis has the ability to perform local analysis i.e. it can analyze a localized area of a larger signal. Wavelet analysis is capable of revealing aspects of data that other signal analysis techniques miss aspects like trends, breakdown points, discontinuities in higher derivatives, and self-similarity.
*Corresponding author: [email protected]
ISSN: 0975-833X
Article History:
Received 17th April, 2012
Received in revised form 24th May, 2012
Accepted 25th June, 2012
Published online 30th July, 2012
Key words:
Discrete Wavelet Transform (DWT), Compression Ratio (CR), Peak Signal to Noise Ratio (PSNR), Digital Number Minimum (DNmin) and Digital Number Maximum (DNmax).
RESEARCH ARTICLE
MULTISPECTRAL BAND IMAGE COMPRESSION USING WAVELETS
Kousalyadevi, R. and Ramakrishnan, S.S.
Institute of Remote Sensing, College of Engineering, Guindy, Anna University, Chennai
ABSTRACT
-band satellite imagery used in remote sensing for environmental monitori
use planning is compressed using Discrete Wavelet Transform to reduce storage capacity and transmission bandwidth in an efficient and effective manner. This paper explains the use of 2D Discrete Wavelet Transform for compression of Landsat5 multispectral band satellite image and analysis of its performance using various parameters such as Compression Ratio (CR), Peak Signal to Noise Ratio (PSNR), Digital Number Minimum (DN min) and Digital Number Maximum (DN max). Various wavelets are applied over the multi-band image for compression and the performance is analyzed. Using those values, the Spectral Signature graph is plotted and a particular wavelet is selected based on the parameter values.
Copy Right, IJCR, 2012, Academic
All substances including living things have their own absorption features. Moreover, at the time we gain high resolution spectrum information, we generate massively large image data sets. Access and transport of these data sets will stress existing processing, storage and transmission capabilities. Therefore, efficient compression should be applied to these data sets The compression schemes used in the data sets can be classified as lossless or lossy. In lossless compression, there is a perfect reconstruction of fter decompression but the storage capacity acquired and transmission bandwidth are high [1]. In lossy compression, the image is reconstructed to the required level.
The development of wavelets can be linked to several separate thought, starting with Haar's work in the early 20th century. Wavelet means a “small wave”. The smallness implies to a window function of finite length. Wavelets are functions that satisfy certain mathematical requirements and a or other functions. A wavelet is a waveform of effectively limited duration that has an average value of zero. Wave in itself refers to the condition that this function is oscillatory. And .Wavelet analysis has the ability to it can analyze a localized area of a larger signal. Wavelet analysis is capable of revealing aspects of data that other signal analysis techniques miss aspects like trends, breakdown points, discontinuities in higher derivatives,
Wavelet compression involves a way analysing an uncompressed image in a recursive fashion, resulting in a series of higher resolution images, each “adding to” the information content in lower resolution images. Th
steps in wavelet compression are performing a discrete wavelet Transformation (DWT), quantization of the wavelet space image sub bands, and then encoding these sub bands. Wavelet images by and of themselves are not compressed images; rather it is quantization and encoding stages that do the image compression. Image decompression, reconstruction, is achieved by carrying out the above steps in reverse and inverse order. Thus, to restore the original image, the compressed image is decoded, dequant
inverse- DWT is performed. Because wavelet compression inherently results in a set of multi
suited to working with large imagery which needs to be selectively viewed at different resolution, as only the level containing the required level of detail need to be decompressed. Wavelet mathematics embrace an entire range of methods each offering different properties and advantages. For example, it is possible to compress 3 or more dimensional imagery using wavelets. Wavelet compression has not been widely used because DWT operation takes a lot of compute power, and because historical techniques perform the DWT operation in memory or by storing intermediate results on hard disk. This limits either the size of the im
compressed, or the speed at which it can be compressed. common characteristic of most of the images is that the neighbouring pixels are correlated. The basic idea of the wavelet analysis is to represent any arbitrary signal ‘X’ as a superposition of a set of such wavelets or basis functions. These basis functions are obtained from a single wavelet called the mother wavelet by dilation and translation.
International Journal of Current Research
Vol. 4, Issue, 07, pp.099-103, July,2012
INTERNATIONAL
MULTISPECTRAL BAND IMAGE COMPRESSION USING WAVELETS
University, Chennai
band satellite imagery used in remote sensing for environmental monitoring, mapping and land use planning is compressed using Discrete Wavelet Transform to reduce storage capacity and transmission bandwidth in an efficient and effective manner. This paper explains the use of 2D dsat5 multispectral band satellite image and analysis of its performance using various parameters such as Compression Ratio (CR), Peak Signal to Noise Ratio (PSNR), Digital Number Minimum (DN min) and Digital Number Maximum (DN band image for compression and the performance is analyzed. Using those values, the Spectral Signature graph is plotted and a particular wavelet is
, Academic Journals. All rights reserved.
Wavelet compression involves a way analysing an uncompressed image in a recursive fashion, resulting in a series of higher resolution images, each “adding to” the information content in lower resolution images. The primary steps in wavelet compression are performing a discrete wavelet Transformation (DWT), quantization of the wavelet-space image sub bands, and then encoding these sub bands. Wavelet images by and of themselves are not compressed quantization and encoding stages that do mpression. Image decompression, or reconstruction, is achieved by carrying out the above steps in reverse and inverse order. Thus, to restore the original image, the compressed image is decoded, dequantized, and then an DWT is performed. Because wavelet compression inherently results in a set of multi-resolution images, it is well suited to working with large imagery which needs to be selectively viewed at different resolution, as only the levels containing the required level of detail need to be decompressed. Wavelet mathematics embrace an entire range of methods each offering different properties and advantages. For example, it is possible to compress 3 or more dimensional s. Wavelet compression has not been widely used because DWT operation takes a lot of compute power, and because historical techniques perform the DWT operation in memory or by storing intermediate results on hard disk. This limits either the size of the image that can be compressed, or the speed at which it can be compressed. A common characteristic of most of the images is that the neighbouring pixels are correlated. The basic idea of the wavelet analysis is to represent any arbitrary signal ‘X’ as a position of a set of such wavelets or basis functions. These basis functions are obtained from a single wavelet called the mother wavelet by dilation and translation.
Wavelet Transform coding provides many attractive advantages over other transform methods. One major advantage of wavelet analysis is its ability to perform local analysis-to analyze a localised area of a large signal. This implies that we can analyze signals in both time and frequency domains at different resolutions. Moreover, wavelets tend to be regular and asymmetric and they are defined in finite resolution. Therefore, signals which are not periodic or have sharp local changes might be better analyzed with an irregular wavelet than with a smooth sinusoid like DCT. Wavelet based lossy compression techniques are of particular interest due to their long history of providing excellent rate distortion performance for traditional 2D imagery [2].Wavelet transform is used for analysis of the image at different decomposition levels. These decomposition levels contain a number of subbands, which consists of coefficients that describe the horizontal and vertical spatial frequency characteristics of the input image [3].
Colour models are different ways in which colour information is stored. The most common and obvious colour model is RGB colour model [4]. It is a three band image. In this paper, the multispectral band satellite image is taken for compression. It is a seven band thematic mapper Land Sat5 image. While processing this image it is converted into single band monochrome images. Then various wavelets are applied on each band to compress the image. After compression, all the bands are combined to obtain the compressed colour image. In order to improve the reconstructed image quality and increase the compression efficiency, the wavelet domain technique is implemented. The high resolution of the image is, the larger its data volume is. The large data volume of a high resolution image brings difficulties in dealing with it. Therefore the image compression is required. The numerical measures such as RMSE and PSNR are used to compare various image compression techniques.
Wavelets
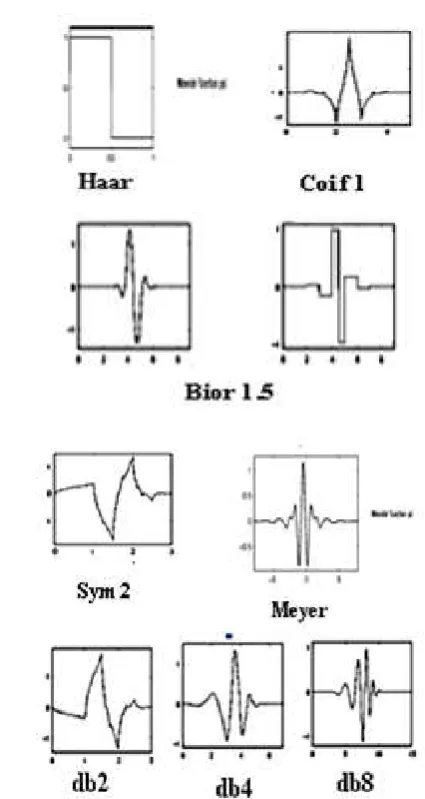
There are many members in the wavelet family, a few of them that are generally found to be more useful, are as per the following Haar wavelet is one of the oldest and simplest wavelet. Therefore, any discussion of wavelets starts with the Haar wavelet. Daubechies wavelets are the most popular wavelets. They represent the foundations of wavelet signal processing and are used in numerous applications. These are also called Maxflat wavelets as their frequency responses have maximum flatness at frequencies 0 and R. This is a very desirable property in some applications. The Haar, Daubechies, Symlets and Coiflets are compactly supported orthogonal wavelets. These wavelets along with Meyer wavelets are capable of perfect reconstruction. The Meyer, Morlet and Mexican Hat wavelets are symmetric in shape. The wavelets are chosen based on their shape and their ability to analyze the signal in a particular application. In discrete wavelet, the image is decomposed into a discrete set of wavelet coefficients using an orthogonal set of basis functions. These are divided into four parts such as approximation, horizontal details, vertical details and diagonal details. The various wavelets are shown in figure 1.
A. Haar wavelet
It is the simplest possible wavelet. This can be applied to the images with discontinuities.
B. Daubechies wavelet
It is an orthogonal wavelet characterized by a maximum number of vanishing moments. Each wavelet type of classes has a scaling function that generates an orthogonal multi resolution analysis.
C. Coiflet wavelet
It is similar to Daubechies wavelets whereas Daubechies have (N/2) -1 vanishing moments but the Coiflet scaling functions have (N/3)-1 vanishing moments and their wavelet functions have N/3 vanishing moments.
D. Biorthogonal wavelet
It provides more degrees of freedoms than orthogonal wavelets. Using this wavelet, it is possible to construct symmetric wavelet functions.
E. Symlets
They are nearly symmetrical wavelets. The properties of Symlets and Daubechies are similar.
[image:2.595.319.532.342.742.2].
Meyer Wavelet
Meyer wavelet is an infinitely regular orthogonal wavelet. The wavelet and scaling function of Meyer wavelet is given in equation (1) & (2).
Wavelet Function
( ) = (2 ) sin(
2 (
3
2 | | − 1)) 2
3 < | | < 4
3
( ) = (2 ) cos(
2 (
3
4 | | − 1)) 4
3 < | | < 8
3
( ) = 0 | | ∉ [ , ] (1) Where
( ) = (35 − 84 + 70 − 20 ) ∈ [0,1]
Scaling function
( ) = (2 ) / | | ≤2
3 ( ) = (2 ) / cos(
2 (
3
2 | | − 1)) 2
3 | | ≤ 4
3
( ) = 0 | | > (2)
Both ψ and φ are defined in the frequency domain, starting with an auxiliary function
Procedure
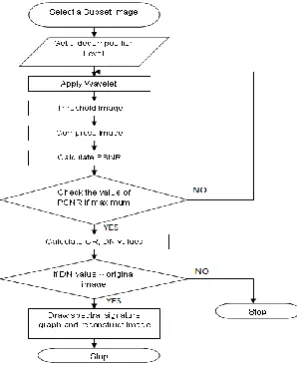
[image:3.595.325.554.52.200.2]The multispectral image is divided into single band monochrome images and each image is decomposed at Level3.The algorithm for image compression is shown in figure 2. Global threshold is used to threshold the detailed coefficients in the image (by keeping the approximation coefficients = 1). Various wavelets such as Haar, Daubechies, Symlets, Coiflet, dmey, Biorthogonal and Reverse Biorthogonal are applied over the image. The mean square error is calculated to obtain the error between the original image and the compressed image [5]. Using the MSE, the PSNR is calculated. Using the PSNR values, some of the wavelets are selected as shown in figure 3 and its compression ratio is calculated [6]. To select a particular wavelet for compression, the DN values of the selected compressed images are calculated. From this, a particular wavelet is selected based on high PSNR, CR and DN values of the compressed image approximately equal to the DN values of the original image.
[image:3.595.41.286.125.301.2]Fig. 2. Flowchart depicting the algorithm employed
Fig. 3. Graph showing compression ratios for different wavelets
[image:3.595.310.552.207.748.2]Fig. 4. Graph showing compression ratios for various levels of dmey
Fig. 5. Graph showing variation of spectral signature for various Wavelets
Compression Ratio
0 5 10 15 20 25 30 35
db9 db10 sym8 coif4 coif5
bior 3.9
bior 6.8
rbio 3.9
rbio 6.8 dmey
Wavelet
%
C
om
pr
e
ssi
on
CR
Compression
100
50.6754
31.9459
23.7223 19.7494
0 20 40 60 80 100 120
1 2 3 4 5
Level
%
C
om
pr
e
ss
ion
dmey
Spectral Signature
0 20 40 60 80 100 120 140 160 180 200
Band1 Band2 Band3 Band4 Band5 Band7
Band
Di
g
it
a
l N
um
be
r
[image:3.595.92.241.576.759.2]Fig. 6 Graph showing PSNR for various levels of dmey
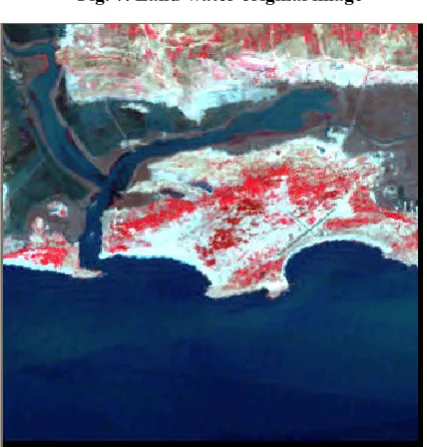
Fig. 7. Land-water original image
Fig. 8. Land –water compressed image
RESULTS AND DISCUSSION
In this study, we have discussed the compression of multi spectral band Landsat5 image using various available wavelet transforms. All the wavelets such as Haar, Symlet, Coiflet, Daubechies, Biorthogonal, Discrete Meyer and reverse
Biorthogonal wavelets were applied over the original subset image and MSE and PSNR values of all the compressed images were calculated. The figure 3 shows the various wavelets and its compression ratios. The compressed images using the wavelets Dmey, Coif4, Coif5, Db9, Db10, Sym8, Bior3.9, Bior6.8, Rbio3.9 and Rbio6.8 were selected based on Spectral Signature [7]. It is shown in figure 5.After calculating the DN, the CR of these images was calculated. Some of the compressed images using wavelets Dmey, Coif5, Bior6.8, Rbio6.8, Sym8, Bior3.9 were only selected based on high CR. The final selection of compressed image was done by calculating the PSNR values of the compressed image. Figure 4 shows the dmey compression at different levels. Finally Dmey wavelet was selected at decomposition Level3, the reason being highest compression ratio, high PSNR and close DN values. Then the compression ratio for various decomposition levels was calculated. Similarly the PSNR was also obtained for the corresponding levels. It was found that the compression ratio and PSNR degrade as the level advanced; on the other hand, giving more close DN values. Hence lower decomposition level was observed to give optimum results [8].
Future Scope
During our experiments it was found that each image has its own characteristics. Hence using a particular wavelet for compressing all the types of images does not help. A probable solution for this problem is to pre-study the image characteristics and then apply an appropriate wavelet. A more feasible solution is to design an absolutely new wavelet, which is tailor-made for a particular type of image which has not been encountered previously. MATLAB software provides capabilities to create new wavelets. So, our further move would be to design an algorithm such that it automatically checks the input image characteristics and tries to correlate with a best compressing scheme, on the contrary, a new wavelet is created automatically.
Conclusions
In this paper use of 2D Discrete Wavelet Transform for compression of Landsat5 Land-Water satellite image has been discussed and its performance was analyzed by Compression Ratio (CR), Peak Signal to Noise Ratio (PSNR), Digital Number Minimum (DN min) and Digital Number Maximum (DN max). All wavelet functions were compared using spectral signature graph. Finally it has been proved that, Discrete Meyer Wavelet (Dmey) provides the compressed image with high PSNR, relatively high compression ratio and pixel value approximately equal to the original image. It has been concluded that, Dmey wavelet provides better image quality at decomposition level 3, with CR (31.9%) and high PSNR for each band.
REFERENCES
Buccigrossi, R.W. and Simoncelli, E.P., 1999, Image Compression via Joint Statistical Characterization in the Wavelet Domain, IEEE Transactions on Image Processing, 8, pp. 1688-1700.
“Hyper spectral image compression using JPEG 2000 and principal component Analysis” IEEE Geosciences and Remote Sensing letters.
PSNR
100
50.7336 46.1499
43.1652 41.0432
0 20 40 60 80 100 120
1 2 3 4 5
Level
P
SN
R
“Performance measure of different wavelets for a shuffled image compression scheme” IJCSNS March 2009. AL-Abudi, B.K. and George, L.A., 2005, Colour Image
Compression Using Wavelet Transform, In GVIP 05 Conference, 19–21, December 2005, CICC, Cairo, Egypt, pp. 35-41.
Chien-Wen Chen, Tsung-Ching Lin, Shi-Huang Chen and Trieu-Kien Truong, 2009, A Near Lossless Wavelet-Based Compression Scheme for Satellite images, 2009 WRI World Congress on Computer Science and information Engineering (CSIE2009), 6, pp. 528-532. Qian Du and Fowler J. E., 2007, Hyperspectral Image
Compression Using JPEG2000 and Principal Component Analysis, Procs. of IEEE Geoscience and Remote Sensing Letters, Vol. 4, pp. 201-205.
Nishat K. and Elwin C.M., 2009, Performance Measure of Different Wavelets for a Shuffled Image Compression Scheme, IJCSNS International Journal of Computer Science and Network Security, 9, pp. 215-221.
Gonzalez, R.C. and Woods, R.E., 2nd Edition, 2004, Digital Image Processing, pp. 409-518 (Prentice Hall).
Lillesand, T.M., Kiefer, R.W. and Chipman, J.W. (5th Ed.), 2009 Remote Sensing and Image Interpretation, pp. 215– 225 (Wiley).
Heung-Yeung Shum, Sing Bing Kang and Shing-Chow Chan, 2003, Survey of Image-Based Representations and Compression Techniques, IEEE Transactions on Circuits and Systems for Video Technology, 13, pp. 1020-1037.