ISSN Print: 2159-4465
DOI: 10.4236/jsip.2018.92007 May 31, 2018 111 Journal of Signal and Information Processing
Statistical Features and Traditional SA-SVM
Classification Algorithm for Crack Detection
Azadeh Noori Hoshyar, Sergey Kharkovsky, Bijan Samali
Centre of Infrastructure Engineering, Western Sydney University, Sydney, Australia
Abstract
In recent years, the interest in damage identification of structural components through innovative techniques has grown significantly. Damage identification has always been a crucial concern in quality assessment and load capacity rat-ing of infrastructure. In this regard, researchers focus on proposrat-ing efficient tools to identify the damages in early stages to prevent the sudden failure in structural components, ensuring the public safety and reducing the asset management costs. The sensing technologies along with the data analysis through various techniques and machine learning approaches have been the area of interest for these innovative techniques. The purpose of this research is to develop a robust method for automatic condition assessment of real-life concrete structures for the detection of relatively small cracks at early stages. A damage identification algorithm is proposed using the hybrid approaches to analyze the sensors data. The data obtained from transducers mounted on concrete beams under static loading in laboratory. These data are used as the input parameters. The method relies only on the measured time responses. After filtering and normalization of the data, the damage sensitive statistical features are extracted from the signals and used as the inputs of Self-Advising Support Vector Machine (SA-SVM) for the classification purpose in civil En-gineering area. Finally, the results are compared with traditional methods to investigate the feasibility of the hybrid proposed algorithm. It is demonstrated that the presented method can reliably detect the crack in the structure and thereby enable the real-time infrastructure health monitoring.
Keywords
Signal Processing, Machine Learning, Statistical Features, Feature Extraction, Classification, Crack Detection
1. Introduction
The main concern in civil infrastructures is the condition-based maintenance How to cite this paper: Hoshyar, A.N.,
Kharkovsky, S. and Samali, B. (2018) Statis-tical Features and Traditional SA-SVM Classification Algorithm for Crack Detec-tion. Journal of Signal and Information Processing, 9, 111-121.
https://doi.org/10.4236/jsip.2018.92007
Received: September 1, 2017 Accepted: May 28, 2018 Published: May 31, 2018
Copyright © 2018 by authors and Scientific Research Publishing Inc. This work is licensed under the Creative Commons Attribution International License (CC BY 4.0).
DOI: 10.4236/jsip.2018.92007 112 Journal of Signal and Information Processing which requires the consequent monitoring of critical structures in order to mi-nimize the probability of failure leading major effects on national assets and public safety in every country [1]. Therefore, the structural health monitoring is absolutely an essential concept which can potentially provide effective solutions to assess the health state of infrastructure. It can reduce the asset management costs, effectively prolongs operational lifetime and ensures the public safety. In this regard, getting access to a robust paradigm to deal with aforementioned concerns is of high priority.
The considerable literature [2]-[10] on structural health monitoring has hig-hlighted the crucial importance of damage detection in civil engineering systems in the earliest time.
One of the effective monitoring techniques in determining the health state of structures is an automatic diagnosis system using sensing data which is based on the principle that damage in a structure, e.g. crack or a loosened connection, can modifies the dynamic structural responses [11]. The automated condition as-sessment systems can interpret the large volumes of inspection data to detect and prevent potential structural failure in early stages by minimizing errors to ensure effective risk management, while reducing the asset management costs.
Therefore, the main objective of this paper is to propose a more robust scheme of automated condition assessment system to monitor and evaluate the health state of the structure. For the purpose of this detection system, non-destructive testing (NDT) method which has attracted lots of attention in structural health monitoring for characterizing and assessing the materials and structures is used to characterize the concrete members. Thereafter, the signal processing and ar-tificial intelligent approaches are employed to analyze the data and enhance the accuracy of detection. However, the critical challenge here is the huge number of data which are obtained. The high priority is proposing the potential algorithm to reduce the loss of information while reducing the noise effect. The second concern is the proper extraction of features which can effectively determine the health state of the structure. These features need to be sensitive enough to detect any discontinuity happens in the structure. These features are directly affecting the performance of the classifier. The third challenge is choosing the appropriate classifier that identifies the crack as happened. The question raised here is what features and which classification technique are appropriate to determine the structural condition; what can be measured that correlates to damage, and how to measure and employ the raw measurements to determine the structural con-dition.
fea-DOI: 10.4236/jsip.2018.92007 113 Journal of Signal and Information Processing ture set to feed the machine learning approaches, while in this paper the combi-nation of the three damage indexes which are obtained between the healthy and target signal are considered as the feature set of the system. The Self-Advising Support Vector Machine [12] is used to classify and detect the damages in classi-fication step. This machine learning approach has not been ever used in the ap-plication of crack detection in civil engineering to determine its effectiveness in the area.
The results will be analyzed and compared with other traditional algorithms to evaluate the accuracy and effectiveness of the system.
2. The Proposed Damage Detection Algorithm
This section explains the proposed damage identification algorithm for SHM. This paradigm consists of four steps: Data Collection, Pre-Processing and Fea-ture Extraction, Classification.
2.1. Data Collection and Pre-Processing
The Experimental analysis is performed on the data collected in Centre of Infra-structural Engineering laboratory (CIE) through using the piezoelectric-based transducers mounted on the concrete beams under static loading. These trans-ducers are transforming the energy of transient stress wave to an electric wave-form. The other transducer is used to receive the signal. Three standard concrete beams (400 × 100 × 100) mm3 have been examined subjected to three-point bending. The recorded signals are pre-processed through signal processing ap-proaches.
2.2. Feature Extraction
After de-noising the signal through the Wavelet signal denoiser tool, the follow-ing features are extracted from the signal in time-domain.
1) Difference of gradient between healthy and non-healthy state. In gradient, the central difference for interior data points is calculated.
D H NH
G =G −G (1)
( )
:, 0.5(
(
:, 1)
(
:, 1)
)
H H H
G j = × A j+ −A j− (2)
( )
:, 0.5(
(
:, 1)
(
:, 1)
)
NH NH NH
G j = × A j+ −A j− (3)
2) Difference of mean between healthy and non-healthy state.
D H NH
M =M −M (4) 0
1 n i
H i
M A
N =
=
∑
(5)0
1 n i
NH i
M A
N =
=
∑
(6)DOI: 10.4236/jsip.2018.92007 114 Journal of Signal and Information Processing
D H NH
RMS =RMS −RMS (7)
2 2 1
1 N
H n
RMS A
N =
=
∑
(8)2 2 1
1 N
NH n
RMS A
N =
=
∑
(9)2.3. Classification
The Support Vector Machine (SVM) and the traditional Self-Advising Support Vector Machine (SA-SVM) is used to classify the extracted features. The brief descriptions of these two learning machines are expressed as follows.
2.3.1. Support Vector Machine
Support Vector Machine has been proven as a powerful technique of classifica-tion in many research areas. This statistical machine learning approach was firstly presented in 1995 by Vapnik [13]. This learning algorithm prevents over fitting by selecting a particular hyperplane among many which can separate the data in feature space. SVM applies a linear separating hyperplane for creating a classifier to maximize the margin. The width of margin between the classes is considered as the optimization criterion. Margin is defined as the distance of op-timal hyperplane and nearest training data points of a class. In cases of non-linearly separation of original input space, in 1992, Guyon, Boser and Vap-nik presented an approach to generate nonlinear classifiers using kernel func-tions [14]. SVM firstly transforms the original feature to a higher dimensional feature space. The transformation may be obtained through different nonlinear mappings. The kernel function K(x; y) may be chosen to suit the problem. After this transformation, the optimal hyperplane may easily found. The achieved hyperplane is the optimal case with respect to a maximal margin [14].
In this paper, SVM is selected as the method of choice as it linearly classifies data in a high dimensional feature space which is related nonlinearly to the input space using specific Radial Basis (RBF) kernel.
2.3.2. Traditional Self-Advising Support Vector Machine
The Self-Advising Support Vector Machine is a newly developed Support Vector Machine introduced in 2014 [12]. This machine uses the prior knowledge in its decision making to separate one class from the others. This classifier receive some additional information through finding the misclassified data in training phase and use this knowledge along with the training data to make the classifica-tion decision. This informaclassifica-tion are the weights assigned to the outliers.
The other contribution of this paper is to investigate the application of this algorithm in damage detection particularly crack detection in civil engineering area with the extracted features. In the SA-SVM, the outliers are defined in training phase as [12].
(
)
(
0(
)
)
1 | j ,
n
i i j j i j
i
DOI: 10.4236/jsip.2018.92007 115 Journal of Signal and Information Processing Although the misclassified data can be null, different experiments has proven that it mostly includes data. The neighbourhood length (NL) for each MD is formulated as [12],
( )
i minimumxj(
i j i j)
NL x = x x y− ≠y (11)
The distance is computed in higher dimension
( )
( )
(
(
)
(
)
(
)
)
0.5, , 2 ,
i j i i j j i j
x x k x x k x x k x x
θ −θ = + − (12)
Finally, the proposed weighing for the data are computed as [12],
( )
( )
( )
0, , or
1 i ,
i
i k i i
k i
x
i k i i
i x
x MD x x NL x MD MUL
x x
x MD x x NL x
NL x
∀ ∈ − > =
−
− ∈ − ≤
∑
∑
(13)3. Results
In this section, the results of the proposed algorithm are investigated. Figure 1 shows the de-noised signal through wavelet de-noiser. The red signal is the sig-nal obtained through the sensor on concrete beam and the blue sigsig-nal shows the de-noised signal through the Wavelet de-noiser.
[image:5.595.211.537.402.612.2]The result shows the effectiveness of this de-nosing tool on the experiment obtained data.
Figure 1. The original and de-noised signal.
Figure 2, Figure 3 and Figure 4 show the difference of gradient, mean and root mean square error of recorded signals between healthy and non-healthy state of concrete after 15 min of loading.
The peaks of differences between healthy and non-healthy state are the indi-cators of the crack.
0 0.1 0.2 0.3 0.4 0.5 0.6 0.7 0.8 0.9 1
Time (S) -0.06
-0.04 -0.02 0 0.02 0.04 0.06
Amplitude
DOI: 10.4236/jsip.2018.92007 116 Journal of Signal and Information Processing
[image:6.595.231.512.288.458.2]Figure 2. Difference of Gradient between healthy and non-healthy state of the concrete beam.
Figure 3. Difference of Max between healthy and non-healthy state of the concrete beam
Figure 4. Difference of Mean square error between healthy and non-healthy state of the concrete beam.
-0.03 -0.025 -0.02 -0.015 -0.01 -0.005 0 0.005 0.01 0.015 0.02 0.025
1 2 3 4 5 6 7 8 9 10 11 12 13 14 15 16
D iff eren ce o f G ra di en t Time (S) -8.00E-07 -6.00E-07 -4.00E-07 -2.00E-07 0.00E+00 2.00E-07 4.00E-07 6.00E-07 8.00E-07
1 2 3 4 5 6 7 8 9 10 11 12 13 14 15
D iff eren ce o f M ax Time (S) -5.00E-03 -4.00E-03 -3.00E-03 -2.00E-03 -1.00E-03 0.00E+00 1.00E-03 2.00E-03 3.00E-03 4.00E-03
1 2 3 4 5 6 7 8 9 10 11 12 13 14 15
[image:6.595.234.515.511.690.2]DOI: 10.4236/jsip.2018.92007 117 Journal of Signal and Information Processing However, each of the differences of gradient, mean and mean square error demonstrated in above figures can be separately considered as the damage index to provide the health state of the concrete. They show the sharp changes when the damage occurred. However, the difference of gradient and the difference of mean square error are able to show the main occurrence of the damage, while the difference of max is able to determine the micro cracks.
[image:7.595.213.527.408.597.2]Therefore, in this paper to take the advantage of all three damage indexes, the combination of three damage indexes has been taken into account to provide the more affective damage recognition. In this regard, the extracted features through Equation (1) and Equation (4) and Equation (7) which computes these damage indexes between the healthy and non-healthy state of the concrete beam are con-sidered as the feature vector. This feature vector is sensitive to any change that may happen in the structure.
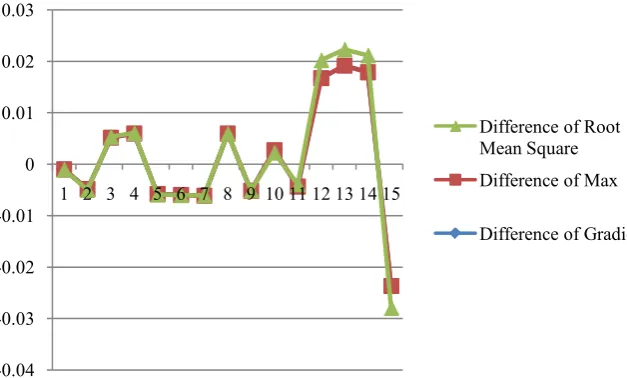
Figure 5 shows the comparison of gradient, mean and mean square error be-tween healthy and non-healthy concrete beam in one graph. The comparison shows that the mean square error difference has the highest value than the other two mean and gradient differences.
The green curve which represents the mean square error reaches the highest value more than 0.02, while the other two curves values are less than 0.02. It shows that the mean square error shows the differences between the healthy and non-healthy concrete beam more accurately.
Figure 5. Comparison of features.
The obtained feature vector is trained through the SVM and traditional SA-SVM.
3.1. Experimental Result for “Feature Extraction and SA-SVM
Classification”
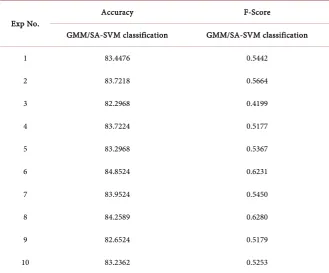
Table 1 indicates the average performance of the features in detecting the dam--0.04
-0.03 -0.02 -0.01 0 0.01 0.02 0.03
1 2 3 4 5 6 7 8 9 10 11 12 13 14 15
Difference of Root Mean Square Difference of Max
DOI: 10.4236/jsip.2018.92007 118 Journal of Signal and Information Processing age by our proposed algorithm “GMM/SA-SVM classification” in 10 experi-ments (validation for each experiment has performed by 100 times of running program).
[image:8.595.207.537.179.452.2]Based on the results, average accuracy and F-score of “our proposed ap-proach” are 83.54377 and 0.54242, respectively.
Table 1. Average performance of each set of features by our proposed algorithm.
Exp No.
Accuracy F-Score
GMM/SA-SVM classification GMM/SA-SVM classification
1 83.4476 0.5442
2 83.7218 0.5664
3 82.2968 0.4199
4 83.7224 0.5177
5 83.2968 0.5367
6 84.8524 0.6231
7 83.9524 0.5450
8 84.2589 0.6280
9 82.6524 0.5179
10 83.2362 0.5253
3.2. Comparing the Results of “Feature Extraction and SA-SVM
Classification” and “Feature Extraction and SVM
Classifica-tion”
DOI: 10.4236/jsip.2018.92007 119 Journal of Signal and Information Processing
Table 2. Average performance comparison between “GMM/SVM classification” and “GMM/SA-SVM classification” for each set of features.
Exp. No
Accuracy F-score
GMM/SA-SVM
classification classification GMM/SVM GMM/SA-SVM classification classification GMM/SVM
1 83.4476 82.247 0.5442 0.5312
2 83.7218 82.1238 0.5664 0.5623
3 82.2968 81.2286 0.4199 0.4194
4 83.7224 82.9524 0.5177 0.5143
5 83.2968 82.9952 0.5367 0.4061
6 84.8524 83.9514 0.6231 0.5222
7 83.9524 83.3514 0.5450 0.5330
8 84.2589 83.15 0.6280 0.5146
9 82.6524 82.2524 0.5179 0.5009
10 83.2362 83.2252 0.5253 0.4241
Table 3. T-Test: two-sample assuming equal variances.
GMM/SA-SVM
classification classification GMM/ SVM
Mean 83.54377 82.74774
Variance 0.552091 0.611033
Observations 10 10
Pooled Variance 0.581562
Hypothesized Mean Difference 0
df 18
t Stat 2.334083
P(T ≤ t) one-tail 0.015691
t Critical one-tail 1.734064
P(T ≤ t) two-tail 0.031381
t Critical two-tail 2.100922
The p-value is less than 0.05 which indicates that the difference between the obtained accuracy of the traditional and proposed algorithm in this paper are significant.
4. Conclusion
[image:9.595.208.539.352.573.2]DOI: 10.4236/jsip.2018.92007 120 Journal of Signal and Information Processing the structure. The hybrid statistical feature analysis algorithm based on the com-bination of three damage indexes which are the differences of gradient, mean, mean square error between the healthy and non-healthy state of the structure along with the Self-Advising Support Vector Machine is carried out on the ob-tained signals to determine the health state of the structure. The result shows that the proposed algorithm is able to determine the state of the structure more accurately when compared with traditional algorithms. This algorithm can be applicable in other area of research. Further improvements on accuracy can be achieved through utilizing the more features in the feature set vector.
References
[1] Stephan, P. and Salin, J. (2012) Ageing Management of Concrete Structure: Assess-ment of EDF Methodology in Comparison with SHM and AIEA Guides. Construc-tion and Building Materials, 37, 924-933.
[2] Bornn, L., Farrar, C.R., Park, G. and Farinholt, K. (2009) Structural Health Moni-toring With Autoregressive Support Vector Machines. Journal of Vibration and Acoustics, 131.
[3] Phinyomark, A., Nuidod, A., Phukpattaranont, P. and Limsakul, C. (2012) Feature Extraction and Reduction of Wavelet Transform Coefficients for EMG Pattern Classification. Electronics and Electrical Engineering, 122, 1392-1215.
https://doi.org/10.5755/j01.eee.122.6.1816
[4] Wang, Q. and Deng, X. (1999) Damage Detection with Spatial Wavelets. Interna-tional Journal of Solids and Structures, 36, 3443-3468.
https://doi.org/10.1016/S0020-7683(98)00152-8
[5] Santos, J.B. and Perdigão, F. (2001) Automatic Defects Classification—A Contribu-tion. NDT & E International, 34, 313-318.
https://doi.org/10.1016/S0963-8695(00)00043-8
[6] Balageas, D., Fritzen, C.P. and Güemes, A., Wiley InterScience (Online Service), Structural Health Monitoring. ISTE, London; Newport Beach, 2006.
[7] Frangopol, D.M. (2003) New Directions and Research Needs in Life-Cycle Per-formance and Cost of Civil Infrastructures. Structural Health Monitoring 2003, From Diagnostics & Prognostics to Structural Health Management, Proceedings of the 4th International Workshop on Structural Health Monitoring, Stanford, CA, Lancaster, PA, DEStech Publications, Inc, 53-63.
[8] Chang, P., Flatau, A. and Liu, S. (2003) Review Paper: Health Monitoring of Civil Infrastructure. Structural Health Monitoring, 2, 257-267.
https://doi.org/10.1177/1475921703036169
[9] Gres, S., Dalgaard Ulriksen, M., Döhler, M., Johansen, R.J. and Nielsen, S.A. (2017) Statistical Methods for Damage Detection Applied to Civil Structures. Procedia En-gineering, 199, 1919-1924. https://doi.org/10.1016/j.proeng.2017.09.280
[10] Dang, X. (2015) Statistic Strategy of Damage Detection for Composite Structure Using the Correlation Function Amplitude Vector. Procedia Engineering, 99, 1395-1406. https://doi.org/10.1016/j.proeng.2014.12.675
[11] Shah, A.A., Alsayed, S.H., Abbas, H. and Al-Salloum, Y.A. (2012) Predicting Resid-ual Strength of Non-Linear Ultrasonically Evaluated Damaged Concrete Using Ar-tificial Neural Network. Construction and Building Materials, 29, 42-50.
DOI: 10.4236/jsip.2018.92007 121 Journal of Signal and Information Processing [12] Maali, Y. and Al-Jumaily, A. (2013) Self-Advising Support Vector Machine.
Knowledge-Based Systems, 52, 214-222.
https://doi.org/10.1016/j.knosys.2013.08.009
[13] Blackledgey, J.M. and Dubovitskiyz, D.A. (2009) Texture Classification Using Frac-tal Geometry for the Diagnosis of Skin Cancers. EG UK Theory and Practice of Computer Graphics, 1-8.
[14] Brieman, L. (1996) Bagging Predictors. Machine Learning, 24, 123-140.