UNIVERSITEIT TWENTE
DELTARES
Including the effect of
Non-Water-retaining Objects in the probabilistic
modelling of dune safety
Master thesis
in Civil Engineering and Management
I
NCLUDING THE EFFECT OF
N
ON
-W
ATER
-
RETAINING
O
BJECTS IN THE PROBABILISTIC MODELLING OF DUNE
SAFETY
MASTER THESIS
IN CIVIL ENGINEERING AND MANAGEMENT
FACULTY OF ENGINEERING TECHNOLOGY
UNIVERSITY OF TWENTE
Student:
Name: Thijs Raaben
Student Number: s0208973
Email: [email protected]
Study direction: Water Engineering and Management Date:
Graduation supervisor: Dr. ir. J.S. Ribberink Daily supervisor: Dr. K.M. Wijnberg External supervisors: Dr.ir. M. Boers
i
A
BSTRACT
An important function of dunes in the Netherlands is to protect the hinterland against flooding. The land behind the dunes is the most densely populated and economically valuable area of the country. Therefore, dune safety is extremely important for the country. The safety of dunes as flood protection is tested every twelve years. The statutory safety assessment model DUROS+ is based on a sand balance with many simplifying assumptions.
One of the assumptions in DUROS+ is that hard elements are absent, which is not valid at many locations along the Dutch coast. When these hard elements have no water retaining function, these elements are called ‘Non Water retraining Objects (Abbreviated as NWO)’. The presence of NWO’s in dunes affect the sediment availability from the dunes. This is because a soft erodible part of the dune is replaced with a hard non-erodible part.
Deltares and Arcadis (2014a) developed guidelines (Referred to as: DnA rules) to account for the effect of NWO’s on dune safety. These guidelines are developed for NWO failure and NWO non-failure. However, these guidelines are not implemented in the current dune safety assessment model and parameter/model uncertainties of these rules are neglected. The current statutory safety assessment model is a semi-probabilistic model, which means that the actual safety test is performed with a deterministic model, but input is based on probabilistic calculations. The impact of NWO’s on dune erosion is not taken into account in these probabilistic calculations. Therefore, the impact of NWO’s on dune erosion should be implemented in a probabilistic model to analyse whether the hydraulic input parameters change due to the incorporation of NWO’s in the probabilistic calculations. In addition, another reason to implement the impact of NWO’s on dune erosion in the probabilistic model is to analyse the importance of model and parameter uncertainties of the DnA rules.
The probabilistic model is a combination between DUROS+ and a probabilistic method. Because dune erosion has very low failure probabilities, a probabilistic method like Monte Carlo is very inefficient because a very large number of computations is necessary to provide reliable results. Therefore, the First Order Reliability Method is used as probabilistic method, because this method is very efficient for very low failure probabilities. However, this method is not always applicable. When this method is not applicable, Monte Carlo with Importance Sampling is a good alternative.
Stochastic distributions for model and parameter uncertainties of the DnA rules are developed. The discrepancy between the predicted model outcomes and reality is called model inadequacy. Important characteristic of model uncertainty is that this kind of uncertainty is present even if there is not a single unknown model parameter in the model. Model uncertainty is hard to determine because no real data about the behaviour of NWO’s during extreme storm surges is available. Therefore, model uncertainty is estimated with the use of other dune erosion models. Parameter uncertainty is dependent on the available information and is case specific.
ii model is that the semi-probabilistic model overestimates the cross shore location of the 10-5 erosion points in all academic cases and Palace hotel case. Another difference is that
the probabilistic dune erosion model provides insight in failure probabilities along the whole dune while the semi-probabilistic model only shows the binary failure/non failure as result.
The hydraulic input parameters for the semi-probabilistic dune safety assessment model approximate the combination of input parameters that lead to the location of the 10-5
erosion point. The results of the probabilistic dune erosion model with the incorporation of NWO’s did not show significantly deviating results than values in the HR2006, which is the input for the semi-probabilistic model. Therefore, the semi-probabilistic model could still be used to test dune safety. However, when the dune is ‘just safe’ or ‘just unsafe’ a more accurate calculation is required. The probabilistic model should be used in these cases for a more accurate calculation and to provide insight in failure probabilities along the whole dune.
Both parameter and model uncertainties of the DnA rules show significant impact on dune safety. The magnitude of this impact is very case specific. Therefore, parameter and model uncertainties should be considered in the DnA rules.
iii
P
REFACE
This thesis completes the Master of Science program in Civil Engineering and Management at the University of Twente in Enschede, the Netherlands. The thesis work was performed at Deltares in Delft, the Netherlands.
I would like to thank my supervisors at Deltares for their assistance and advices with daily problems. I want to thank Joost den Bieman and Marien Boers for their support with the model set-up, detailed feedback on reports and advices to handle with difficulties. I would like to thank my supervisors from the University of Twente, Kathelijne Wijnberg and Jan Ribberink, for their feedback, advices and suggestions during the graduation process. Apart from my supervisors, I would like to thank my fellow graduation students at Deltares for the nice coffee breaks and lunches. Finally, special thanks to my family and friends for their support during my study.
v
C
ONTENTS
ABSTRACT ... I PREFACE... III
1 INTRODUCTION ... 1
1.1 PROBLEM DEFINITION ... 3
1.2 MAIN OBJECTIVE ... 5
1.3 RESEARCH QUESTION ... 5
1.4 SCOPE ... 6
1.5 METHODOLOGY ... 6
1.6 REPORT OUTLINE ... 7
2 THEORY ... 8
2.1 DUROS+ ... 8
2.2 STOCHASTIC DISTRIBUTIONS ... 11
2.3 DESCRIPTION DNA RULES ... 14
2.4 PROBABILISTIC METHODS ... 17
3 MODEL SET-UP ... 26
3.1 SEMI - PROBABILISTIC MODEL DESCRIPTION ... 26
3.2 PROBABILISTIC MODEL DESCRIPTION ... 26
3.3 MODEL VALIDATION ... 30
3.4 STOCHASTIC DISTRIBUTIONS DNA RULES... 33
3.5 MODEL OVERVIEW ... 36
3.6 SUMMARY ... 37
4 ACADEMIC CASES... 39
4.1 CASE DESCRIPTION ... 39
4.2 SEMI-PROBABILISTIC VS PROBABILISTIC RESULTS ... 40
4.3 SENSITIVITY ANALYSIS: RELATIVE IMPORTANCE ... 43
4.4 GENERAL SENSITIVITY ANALYSIS ... 45
4.5 FAILURE UNCERTAINTY ... 48
4.6 SUMMARY ... 48
5 FIELD CASE ANALYSIS: THE PALACE HOTEL ... 49
5.1 CASE DESCRIPTION ... 49
5.2 RESULTS ... 51
5.3 RESULTS REAL SHAPED NWO ... 52
5.4 RESULTS HYDRAULIC INPUT PARAMETERS ... 54
6 DISCUSSION ... 55
6.1 MODEL LIMITATIONS... 55
6.2 EFFECT NWO’S... 56
6.3 DIFFERENCES SEMI-PROBABILISTIC AND PROBABILISTIC MODEL ... 56
7 CONCLUSIONS AND RECOMMENDATIONS ... 57
7.1 CONCLUSIONS ... 57
7.2 RECOMMENDATIONS ... 57
BIBLIOGRAPHY ... 59 APPENDICES ... I
1
1
I
NTRODUCTION
Sandy dunes serve several purposes in the Netherlands such as recreation, nature and ecology, but the main function is to protect the hinterland against flooding. Most areas behind dunes are beneath mean sea level and are densely populated and economically valuable areas. Therefore, dune safety is extremely important for the country.
Legal regulations for dune safety are published in the ‘Voorschrift Toetsen op Veiligheid (VTV2006)’ and the ‘Hydraulische Randvoorwaarden (HR2006)’ (Ministry of V&W, 2007). Most recent legal regulations state that water managers should report the safety of dunes as flood protection to the Minister of Infrastructure and Environment every twelve years (Handboek Water, 2014). Therefore, an appropriate assessment method for dunes is required. This statutory dune safety assessment method is a based on a simple volume balance and is the DUROS+ model (Vellinga, 1986, van Gent et al, 2008).
Hard elements
The fact that the current dune safety assessment method is based on a simple volume balance leads to many simplifying assumptions of reality. One of these assumptions is that hard elements are absent. However, the presence of hard elements could increase the amount of dune erosion. Furthermore, legal regulations state that water managers should account for the presence of hard elements.
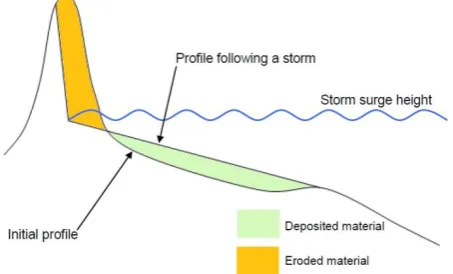
[image:11.595.200.427.563.700.2]Hard elements are present on several locations along the Dutch coast. When these constructions have no water retaining purpose, these elements are called ‘Non Water retaining Objects’ (abbreviated as NWO from now on). Examples of NWO’s are bunkers, basements, hotels, beach huts, restaurants etcetera. These objects may weaken the water defence function of the dune because they may increase the amount of dune erosion. The presence of NWO’s in dunes affect the sediment availability from the dunes. This is because a soft erodible part of the dune is replaced with a hard non-erodible part. Normally, the sediment flows from the dunes to the nearshore during storm surge conditions (see Figure 1.1). However, the NWO blocks the sediment supply from the dune tot the nearshore, because there is no sediment flow through the construction but erosion in front of the NWO will continue. This leads to beach lowering, which reduces wave energy dissipation and increases wave loadings on the NWO (French, 2001).
Figure 1.1 Dune erosion during storm surge (Based on: Bruun, 1962)
2 of the structure (see Figure 1.2). This can cause instability of the NWO, which can lead to NWO-failure.
Figure 1.2 Development of scour hole in front of NWO (After Linham and Nicholis, 2014)
Calculation guidelines for hard elements
Managers of flood defences are confronted with NWO’s from two different responsibilities. They have to evaluate whether the NWO has a disadvantageous impact on the flood defences and whether this is acceptable or not for (1) the judgment of a permit request for a new NWO and (2) the statutory twelve yearly dune safety assessments. However, there are no calculation rules prepared by the government for this evaluation. Deltares and Arcadis (2014a) developed calculation guidelines for the impact of NWO’s on dune safety. This report refers to these calculations guidelines as ‘DnA rules’. Calculation rules are provided for two situations:
(1)Track 1: NWO-failure: The NWO has become unstable and fails during a storm, which leads to a local excavation in the dune profile. This leads to an additional retreat of the erosion line behind the NWO.
(2)Track 2: NWO non-failure: The NWO withstands the storm, but the lowered dune profile in front of the NWO leads to a transition (in height) in longshore direction. This leads to an additional retreat of the erosion line next to NWO.
The DnA rules contain several uncertainties from which it is not known how these affect the end result of the dune safety assessment method. Furthermore, these rules are not implemented in the current statutory safety assessment method.
Semi-probabilistic method
3 Managers of flood defences have to define which part of the dunes is functioning as flood defence according to article 5.1 of the Waterwet (Ministry of V&W, 2009). There must be a minimal and stable dune profile present within this area, which leads to a certain point until where erosion may occur. The safety assessment shows failure when the erosion point is landward of that point.
* Changes in the near future according to Deltares (2014b)
Figure 1.3 Current semi-probabilistic safety assessment model
1.1
P
ROBLEM DEFINITIONPresence of NWO’s in dunes may lead to extra erosion during storm surges. Deltares and Arcadis (2014a) developed calculation rules for the impact of NWO’s on dune safety, but these rules contain several uncertainties. Implementation of the DnA rules in the current semi-probabilistic dune safety assessment method is not possible because this model cannot easily cope with uncertainties. In addition, the current safety assessment model only shows a binary failure/non-failure as result. Therefore, it is not possible to gain insight in the effect of model and parameter uncertainties of the DnA rules on dune erosion with the semi-probabilistic model.
A probabilistic dune safety model is able to cope with uncertainties and provides insight in failure probabilities across the dune instead of the binary result failure/non-failure. Therefore, the DnA rules will be included in a probabilistic dune safety model to gain insight in the effects on dune safety of NWO’s.
The probabilistic dune safety model can quantify the impact of uncertainties on the result, which can help in the further development of the DnA rules. Uncertainties with a relatively high impact on the result require more future research than uncertainties with a relatively low impact.
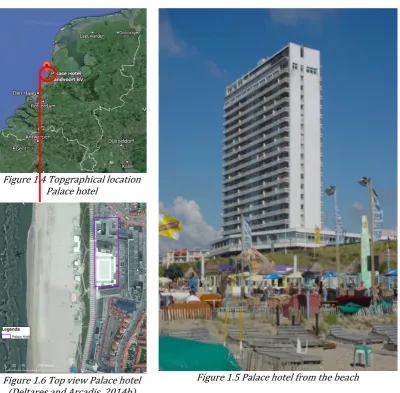
Field case
4
Figure 1.4 Topgraphical location Palace hotel
Figure 1.5 Palace hotel from the beach Figure 1.6 Top view Palace hotel
(Deltares and Arcadis, 2014b)
5
Figure 1.7 Maximum erosion point palace hotel
Table 1.1 shows the hydraulic conditions of the palace hotel according to the HR2006.
Table 1.1 Hydraulic conditions Palace hotel
Variable Value h [m] 5
[m] 9
[s] 15.5
[ m] 178
This case will be used during the report as example calculations to add some illustrations to theoretical subjects and as a real case analysis in chapter 5.
1.2
M
AIN OBJECTIVEThe main objective of this research is to quantify the relevance of the incorporation of NWO’s in a probabilistic dune safety assessment model and to gain insight in the uncertainties in the DnA rules to provide advice about what parameters/variables are important for further studies to reduce parameter and model uncertainty. It will be investigated which variables/parameters of the DnA rules are particularly of interest for future investigation.
1.3
R
ESEARCH QUESTIONHow can we quantify the relevance of the incorporation of NWO’s in a probabilistic dune safety assessment model and what parameters/variables of the DnA rules are important for further studies to reduce parameter/model uncertainty?
1.3.1 Sub questions
What is the main difference between results of the probabilistic model with the DnA rules included and results of the semi-probabilistic model with the DnA rules included?
Do the hydraulic conditions differ significantly when the impact of NWO’s on dune safety is included in the probabilistic model compared to the input for the semi-probabilistic safety assessment of the HR2006?
Do parameter and model uncertainties of the DnA rules have a significant effect on dune erosion?
What is the impact on dune safety of the uncertainty in NWO behaviour (failure or non-failure) during a storm?
6
1.4
S
COPEThe report does not focus in detail on morphological processes of NWO’s regarding to dune erosion but uses the guideline calculation rules from Deltares and Arcadis (2014a) and applies this for the DUROS+ model.
1.5
M
ETHODOLOGY1.5.1 Literature study
A literature study is performed to provide usefull background information to understand the report. The focus of the literature study is on the DUROS+ model, the DnA rules and the probabilistic methods ‘the First Order Reliability Method’ and ‘Monte Carlo (with Importance Sampling)’. Some parts of the literature study are explained with the use of calculation examples from the Palace Hotel case.
1.5.2 Model set-up
The semi-probabilistic model with the DnA rules included is based on the current safety assessment model DUROS+ and the DnA rules. An erosion point is calculated with DUROS+, this point is extended with an additional retreat distance that is calculated with the DnA rules. Scripts to run the DUROS+ computation with Matlab are available in the Open Earth Toolbox (Open Earth Toolbox, 2014). These scripts are modified to account for the retreat distance of the DnA rules.
The probabilistic model is a combination of DUROS+, the DnA rules and a probabilistic method. Separate scripts to perform DUROS+ and probabilistic methods are available in the Open Earth Toolbox (Open Earth Toolbox, 2014). However, these scripts are combined and adjusted to develop a probabilistic dune safety model in which the impact of NWO’s can be included. The impact of NWO’s on dune erosion is included according to the DnA rules.
Stochastic distributions for the parameters in the DnA rules are developed based on an uncertainty analysis to account for model-and parameter uncertainties. Model uncertainty is the discrepancy between reality and model outcomes when all parameters can be estimated without uncertainty. Real data about the impact of NWO’s on dune erosion is scarce, therefore other dune erosion models DUROS+, DurosTA and XBeach are used to quantify model uncertainty. So, it is important to consider that these stochastic distributions are only an estimation but the influence of (high/low) model uncertainty on the result can be quantified. Parameter uncertainty is the accuracy with which parameters can be estimated and depends on the available information.
1.5.3 Academic cases
Six academic cases are developed to analyse the relevance of the incorporation of NWO’s in the probabilistic dune erosion model and the effect of uncertainties in the parameters/variables of the DnA rules on dune erosion are analysed.
7 the effect of the incorporation of NWO’s in the probabilistic model on the hydraulic input parameters.
A sensitivity analysis where the stochastic input parameters are varied is performed to analyse the effect on dune erosion of each input parameter of the DnA rules. Also, the influence of failure uncertainty will be analysed with the use of the six academic cases.
1.5.4 Field case
The Palace Hotel case is used to explain some sections of the report with example calculations. This field case is also used to analyse the effect on dune safety of the Palace hotel in Zandvoort. This case is used to analyse whether a real case shows the same outcomes on the research questions as the six academic cases. So the same analysis as for the academic cases are performed with the field case.
1.6
R
EPORT OUTLINE8
2
T
HEORY
The initial model will be a combination of DUROS+ and a probabilistic method. The impact on dune safety of NWO’s will be implemented in this model according to the DnA rules. This chapter describes DUROS+, the DnA rules and the probabilistic methods ‘The First Order Reliability Method’ and ‘Monte Carlo with Importance Sampling’.
2.1
DUROS+
The DUROS+ model (Van Gent et al, 2008) is an analytical model for the estimation of coastal profiles changes impacted by a sea storm. DUROS+ is an improved version of the DUROS model, which was original developed by Vellinga (1986) based on many laboratory data sets. The original DUROS model is a function of the storm surge level, significant wave height and the settling velocity of the sand (mainly determined by the grain size). DUROS+ is based on DUROS with the inclusion of the extra term peak wave period.
The DUROS+ model calculates a parabolic post storm coastal profile based on equations 2.1, 2.2 and 2.3, and fits this in the pre-storm profile. This profile is positioned such that the volume of sediment eroded from the dune and the beach is equal to the settled volume (sand balance in cross-shore direction).
( ) [ ( ) ( ) ( ) ] (Eq 2.1)
This formula is valid till the point
( )
( ) (Eq 2.2)
so,
[ ( ( )
)
] ( ) (Eq 2.3)
The fall velocity ( ) in equation 2.1 is largely dependent on the grain size diameter of the sediment (see Eq. 2.4).
( ) ( ) (Eq 2.4)
= significant wave height in deep water [m]
= fall velocity of dune sand in salt sea water at 5 degrees Celcius [m/s]
= distance to the new dune foot [m] = depth below the storm surge level [m]
= peak wave period [s]
= fall velocity of the dune sand in sea-water [m/s]
= measure for the grain size of the sediment [ m] (where 50% by weight is finer)
9
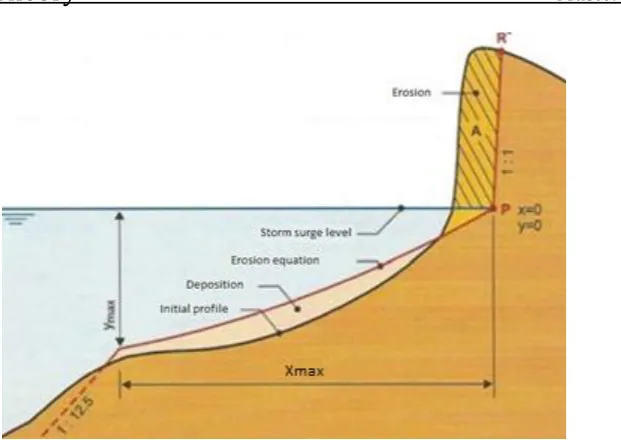
Figure 2.1 DUROS+ erosion profile (After ENW, 2007)
2.1.1 Additional erosion
DUROS+ assumes that the equilibrium state is developed during a storm surge with a duration of 45 hours. The hydrograph of the 45 hour storm at the North Sea is approximated in the model with a storm duration of 5 hours with constant water level. The uncertainty in storm surge duration is expressed as an additional fraction of the amount of erosion above storm surge level. The mean value of this additional fraction is zero with a standard deviation of 0.1 (ENW, 2007).
The sand balance that is the basis for DUROS+ is a simplified schematization of complex processes. This leads to inaccuracies, which are expressed as an additional amount of erosion above storm surge level with a mean of 0 and a standard deviation of 0.15 (ENW, 2007).
Effects of uncertainty in storm duration and DUROS+ model uncertainty are combined for the safety assessment. The factor for the additional erosion is 0.25 of the amount of erosion above storm surge level (ENW, 2007).
2.1.2 Required model input
The model input for the safety assessment model DUROS+ is based on probabilistic calculations. These probabilistic calculations approximate the combination of input variables with a probability of occurrence, which is equal to the dune safety norms.
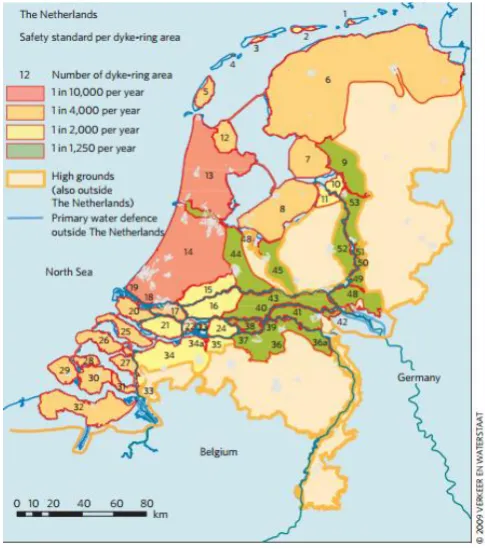
Dune safety norms
10
Figure 2.2 Dutch safety standards (Ministry of V&W, 2007)
Input variables
DUROS+ requires the following variables as input: storm surge level, significant wave height, peak wave period and the grain size of the local sediment (to determine the sediment fall velocity). The hydraulic conditions are derived extreme value statistics of off shore wave buoys on several locations along the Dutch coast.
Dune profile
Calculations can be performed on a reference profile or a real dune profile. The reference profile is a numerical profile that represents a characteristic profile for the Dutch coast with a dune crest at +15 m NAP. The slope of the dune face is 1:3 and ends at +3 m NAP. The slope from +3 m NAP till NAP is 1:20. From NAP till -3m NAP the slope is 1:70, and seaward from thereon the slope is 1:180 (for reference profile, see Figure 2.3).
In the Dutch case, real dune profiles are obtained from the JARKUS dataset (Rijkswaterstaat, 2008). The year of the JARKUS-measurements, JARKUSId and the two stations where the JARKUSlocation is in between is the required input for real profiles. JARKUS profiles sometimes miss data in the profile, so the JARKUS data in the model is adjusted for the missing data, using linear interpolation.
2.1.2.1 Example Deterministic safety assessment: Palace Hotel case:
11 Figure 2.4 shows the result of the current semi-probabilistic safety assessment with the real dune profile at the location of the Palace hotel (JARKUSId: 8006575). The erosion point (red spot) is located at x = -73m. This point is located seaward of the border at x=-108m (see case description in Introduction), which means that this profile is safe according to the current statutory dune safety assessment.
Figure 2.3 Deterministic safety assessment
Palace Hotel on reference profile Figure 2.4 Deterministic safety assessment Palace Hotel on Jarkus profile. JarkusID: 8006575, year: 2012
2.2
S
TOCHASTIC DISTRIBUTIONSTo determine the dune failure probability, the probabilities of relevant forcing combinations need to be calculated. Variables that are used for the calculation of these probabilities are called stochastic variables. Deterministic variables do not contain mentionable uncertainty contrary to stochastic variables. The initial model requires storm surge level, significant wave height, peak wave period, grain size, DUROS+ model uncertainties and storm duration as stochastic variables. These stochastic distributions are based on the report of Deltares (2014c).
The safety assessment is performed with a prescribed combination of deterministic input values that approximate the dune safety norm for each location. Most recent combinations of input variables for each location are shown in the ‘HR2006’ (Ministry of V&W, 2007). The probabilistic basis for these values are shown in this section. These probabilistic equations are later also used in the model for this study.
The water level has a conditional Weibull distribution with location specific parameters. Equations 2.5 and 2.6 describes the frequency of exceedance of water levels H that exceeds a certain water level h under the condition that this water level h exceeds the threshold .
( ) ( ) ( ) (Eq. 2.5)
( ( ( )) ( ) ) (Eq 2.6)
= the frequency of exceedance of the highest level h during a storm surge [in year-1]
= the highest water level during a storm surge [m]
= a shape parameter that depends on the location along the coast = a threshold above which the function is valid [+ m NAP]
a scale parameter that depends on the location along the coast
12 Above equations are only valid above a certain threshold, which is . The parameters
and differ from location to location and are calculated for Hoek van Holland,
IJmuiden, Den Helder, Eierlandse Gat and Borkum (WL|Delft Hydraulics, TU Delft and Alkyon, 2007) . Parameters for intermediate locations are determined with the use of linear interpolation.
It is important to consider that equation 2.6 describes the frequency of exceedance and not the probability. That relation can be described by equation 2.7.
( ) ( ) Eq (2.7)
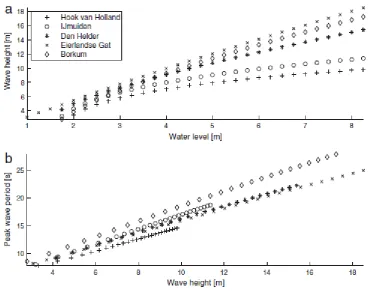
The significant wave height (at -20m NAP) is related to the water level because their driven force is the wind (see Figure 2.5). The wind speed is determinative for wind set-up as well as for wave heights. Wind direction and duration affect set-up and wave height in a different way, so different wave heights can occur at a certain surge level. This distribution is approximated by a normal distribution with a standard deviation of = 0.6m (WL|Delft Hydraulics, TU Delft and Alkyon, 2007). Figure 2.5 shows the relation between the water level and wave height, which is used as the mean in the normal distribution.
e3
s
a bh c d
h
for NAP
m
h
d
H
a bh for h
d
(Eq 2.8) The parameters a, b, c, d and e differ from location to location and are determined for the same locations as for the location specific parameters for the water level.The peak wave period (at -20m NAP) is related to the significant wave height. This relation is studied for some locations along the Dutch coast (see Figure 2.5). Equation 2.9 shows the relation between the wave peak period and significant wave height (WL|Delft Hydraulics, TU Delft and Alkyon, 2007).
p s
T
H (Eq. 2.9)= a parameter which depends on the location along the coast [s] = a parameter which depends on the location along the coast [s/m]
13
Figure 2.5 Relation water level, wave height and peak wave period (HKV, 2005)
Cross-shore samples for the grain size are taken on five cross-shore locations at every 2 km coast, and are assumed to be representative for the cross-shore profile (Kohsiek, 1984). They are normally distributed with a mean and standard deviation . The values for the grain size with their standard deviation can be found in ‘Technical Report Dune Erosion’ (ENW, 2007).
The value for the deterministic safety assessment is determined as:
( )
(Eq 2.10)
The DUROS+ model accuracy is expressed with a normal distribution with mean and standard deviation of the total amount of dune erosion above storm surge level. The mean is zero with a standard deviation of 15%. Sign for this stochastic distribution is
.
14 2.2.1.1 Example Stochastic distributions: Palace Hotel
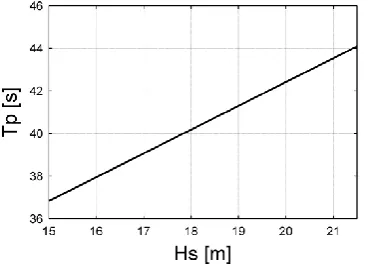
Zandvoort is between the measurement locations IJmuiden and Hoek van Holland. The hydraulic conditions (based on location specific parameters) are calculated for both stations. Then the hydraulic conditions for Zandvoort with JarkusID 8006575 are derived using linear interpolation dependent on the distance between the location and the stations. The grain size distribution for the Palace Hotel has a mean of 180 m and a standard deviation of = 9 m (ENW, 2007). Figure 2.6, 2.7 and 2.8 show the hydraulic conditions with a probability of occurrence according to the equations as in section 2.2 for the location of the Palace hotel.
Figure 2.6 Weibull distribution for Palace Hotel
Zandvoort, JarkusID: 8006575 Figure 2.7 Relation between water level and significant wave height for Palace Hotel Zandvoort, JarkusID: 8006575
Figure 2.8 Relation between the significant wave height and peak wave period for Palace Hotel Zandvoort, JarkusID: 8006575
2.3
D
ESCRIPTIOND
NA
RULESDeltares and Arcadis (2014a) developed calculation rules for the impact on dune safety of NWO’s. This section contains background information and derivation of these rules. Calculation rules are developed for NWO failure and NWO non-failure. It is not sure how a NWO behaves during a storm, so the largest retreat distance from the two situations is normative.
2.3.1 Track 1: NWO failure
[image:24.595.186.372.421.553.2]15 situation are relevant for NWO’s with deep foundations. The NWO is assumed to be completely absent after the storm which leads to a local excavation beneath ground surface in the dune profile. This local excavation adjusts the original profile and causes extra erosion. To satisfy the cross-shore sand balance, the retreat distance of the dune erosion line is further landward because of the local excavation compared to the situation without a NWO.
Figure 2.9 shows the local excavation with relevant parameters. The red line is the erosion profile without the impact on dune erosion of NWO’s included. The dotted red line shows the erosion profile with NWO’s included. It can be seen that the erosion line is displaced landward due to the impact of the NWO. Figure 2.9 shows relevant parameters for the quantification of this effect.
Figure 2.9 NWO failure with local excavation (source: Deltares and Arcadis, 2014a)
= NWO width [m]
= NWO height beneath surface level [m]
= Distance: Position seaward side NWO - erosion point [m]
= Active dune height [m]
= Difference storm surge level and foundation NWO [m] = Critical threshold wet/dry NWO [m]
= Extra dune retreat distance [m]
The DnA rules add an extra retreat distance in horizontal direction to the DUROS+ erosion point according to equation 2.11 in case of NWO failure. The derivation of this equation can be found in appendix A1.
{
( )( ) ( )
(Eq. 2.11)
2.3.2 Track 2: NWO Non-failure
‘NWO non-failure’ is about the effects in case the NWO does not collapse during a storm. The presence of a NWO blocks the sediment supply from the dune tot the nearshore because there is no sediment flow through the construction but erosion in front of the NWO will continue. This leads to beach lowering in front of the NWO (see Introduction, chapter 1).
16 NWO. Two profiles can be distinguished within this effect; there is an undisturbed profile next to the NWO (profile A) and a disturbed (lowered) profile in front of the NWO (profile B) (see Figure 2.11). At the transition between the A and B profile there is a discontinuity in the post storm profile. This discontinuity will be partly undone by sideward subtracting material from the A profile and transporting this to the B profile. Figure 2.11 shows this sediment transport, the yellow arrows show the dominant sand vector, the red line is the erosion line, the dotted line represents the transition line between the undisturbed A- and disturbed B- profile and and are length vectors of the profile. As a result of the sideward (longshore direction) exchange of sediment, the sand balance in cross direction is disturbed, which causes extra dune retreat next to the building. This effect influences the dune retreat distance over length (see Figure 2.11).
Figure 2.10 Sediment transport vectors after
storm (Deltares and Arcadis, 2014a) Figure 2.11 Different profiles after storm (Deltares and Arcadis, 2014a)
The DnA rules add an extra retreat distance in horizontal direction to the erosion point according to equation 2.12 in case of NWO non failure.
(Eq. 2.12)
The derivation of this equation can be found in appendix A2.
2.3.3 Failure uncertainty
It is not known whether a NWO fails or not during a storm. Therefore, the track with the largest retreat distance is normative, which is a conservative choice.
2.3.3.1 Example calculation DnA rules: Palace Hotel
The extra dune retreat distance as result of the impact on dune erosion of the NWO is calculated in this example for both track 1 and track 2.
Track1: NWO failure
Initial erosion point (without NWO): x = -97m (see Figure 2.12) = Location seaward side NWO – erosion point = -36 +117 = 71m The value for is .
17 Figure 2.13 shows this NWO in DUROS+ as a gap. The extra dune retreat distance due to the impact of the NWO on dune safety is 34m according to DUROS+, which is equal to the result of the DnA calculation. This leads to a location of the erosion point at x=-131m (97-34=131, see Figure 2.13).
Figure 2.12 Erosion result DUROS+ without
NWO Figure 2.13 Erosion result DUROS+ with NWO
Track 2: NWO non-failure
Track 1 shows a larger retreat distance, so this is normative in this case. Figure 2.14 shows the DUROS+ erosion profile with the extra retreat distance ( ) according to the DnA rules.
Figure 2.14 Erosion result with DnA rules included
2.4
P
ROBABILISTIC METHODS18
2.4.1 Limit state function
Common basis for different reliability methods is the limit state function, which gives a mathematical definition of a failure event. The limit state surface, which separates the failure domain from the safe domain, is described by the limit state function.
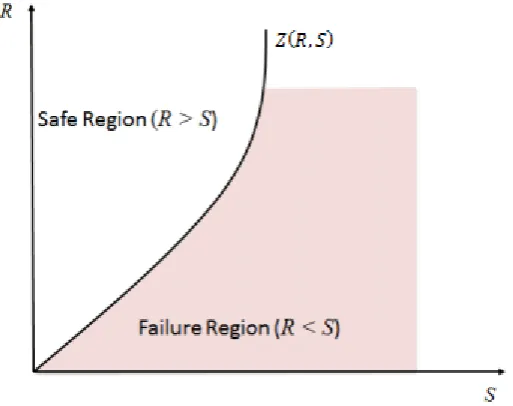
The limit state function (Eq. 2.13) gives a negative value in case of system failure and a positive value when the system does not fail. The limit state function in its simplest form can be viewed as the difference between resistance R and the load S (Eq. 2.13).
( ) (Eq. 2.13)
[image:28.595.157.414.337.540.2]
Figure 2.15 shows a general limit state function, this function separates the safe region (R>S) and the failure region (R<S). The boundary between the regions is the failure surface (R=S) where Z=0.
Figure 2.15 Limit state function (Source: Hamed, H et al, 1999)
The resistance (R) and load (S) are in most cases functions of a number of uncertain parameters. This implies that the simplistic two-dimensional formulation in reality involves a much larger number of such parameters corresponding to a reliability formulation of high dimension (Leira, 2013).
19
(Eq. 2.14)
With:
Z(x) > 0 represents the safe state
Z(x) = 0 represents the limit state surface Z(x) < 0 represents the failure state 2.4.1.1 Example Limit state function: Palace Hotel
The red spot (at x=-73m) in Figure 2.16 shows the erosion point of the semi-probabilistic model at the location of the Palace Hotel (for calculation see Figure 2.4). The blue spot shows the critical erosion point at x=-108m (see Introduction).
Now we fill in the limit state function according to equation 2.14:
( ) ( )
The limit state function shows a positive value in this case, which means that this situation represents a safe state.
Figure 2.16 Erosion point and critical erosion point Palace Hotel
2.4.2 First Order Reliability Method
The method 'First order reliability method’ (abbreviated as FORM) uses the standard normal space for the calculations. The first order relates to the linearization of the limit state function in the design point.
2.4.2.1 Suitability of FORM
FORM can only be used when the limit-state function is not highly nonlinear, in particular in the region close to the design point. Second condition the limit state function (around the design point) must be continuously differentiable.
When this is the case, another reliability method like Monte Carlo with Importance Sampling can be applied.
20 The point in the failure space with the greatest probability density is called the design point.
FORM can be executed in a few steps:
(1)Transformation of the basic variables X into uncorrelated standard normal variables
(2)Determine the most likely failure point in the standard space (the design point) (3)Approximation of the limit state surface in the standard space at the design point (4)Compute the failure probability in accordance with the approximation of step 3 2.4.2.2 Standard normal space
The step after defining the limit state function in FORM is to transfer a vector of random variables in the physical space (X-space) to a standard normal space (U-space). The standard normal space is a space of uncorrelated standard normal random variables. In case of the probabilistic model for this study, this vector of random variables would be the stochastic input variables mentioned in section 2.2.
The advantages of the transformation into the standard normal space are (Haukaas, T, 2005):
1. The probability density in the standard normal space is rotationally symmetric. For all hyperplanes of equal distance to the origin, the probability is constant. 2. The probability density decays exponentially with square of the distance from the origin. So integration at a linearization point in a standard normal space can approximate the probability of failure with good accuracy.
To use the standard normal space, the random vector X (with ) will be transformed into the standard normal vector U (with ) , with = 0, and the variables are independent.
Figure 2.17 Example of failure space, design point and contours of the joint probability density function. Left: Failure surface in standard normal u-space, right: Failure surface in the physical
x-space (Hamed, m et al, 1999)
The failure probability in this space is:
21 The design point is the point where the failure the most probable, this is the nearest point to the origin in the failure region in the standard normal space (Cawfield and Sitar, 1987). The distance from the origin to the nearest point in the failure region is referred to with the sign .
Reliability index
The quotient of the average value and the standard deviation of the reliability function is referred to as the reliability index ( ) for a linear reliability function (in FORM, the reliability function will be linearized) with normally distributed base values (see equation 2.40).
(Eq. 2.16) The -sign is the cumulative standard normal distribution function (see Figure 2.18), and
is the shortest distance from the origin to the limit state (see left part of Figure 2.17) and is called the Hasofer and Lind reliability index.
Figure 2.18 Cumulative standard normal
distribution Figure 2.19 DEFINITIONS of limit state and reliability index (source: NPTEL)
2.4.2.3 Finding the design point
The step after the transformation to the normal space is to determine the design point ( ). This is the point on the limit state surface in the standard normal space closest to the origin and the point where the failure the most probable (Cawfield and Sitar, 1987). This is because the probability density decays with distance from the origin (see ‘standard normal space’).
This leads to the optimization problem as in equation 2.41 to find the design point. This means that the design point is minimum under the condition that this point is on the limit state (Z(u) = 0).
{ ( ) (Eq. 2.17)
22 2.4.2.4 Limit state surface approximation
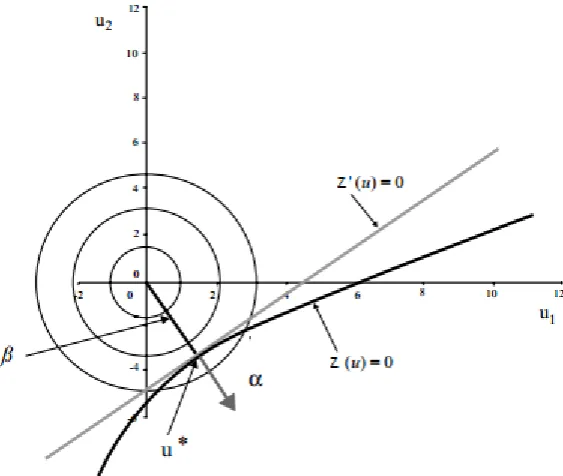
[image:32.595.151.433.192.430.2]The step after ‘finding the design point’ is the approximation of the non-linear limit-state surface in the u-space by an appropriate tangent surface at the design point. The probability density decays exponentially in the u-space (see ‘standard normal space’), so a significant contribution to the failure probability comes from the part at the failure space closest to the origin (see Figure 2.20).
Figure 2.20 Linearization step in Form (source: Hamed, M et al, 1999)
The linearization is done by using the linear Taylor series expansion around the design point (Haukaas, T, 2005). The T in equation 2.42 is the transpose of the matrix.
( ) ( ) ( ) ( ) (Eq 2.18)
The term ( ) is on the limit state surface, so this term is zero. The gradient can be replaced by its negative and normalized version; this is alpha in equation 2.17.
( ) ( ) (Eq 2.19)
The combination of eq. 2.18 and eq. 2.19 leads to:
( ) ( ) ( ) ( ) ( ) (Eq 2.20)
is a unit normal vector, so the product of this and is the length of . This length is the distance between the design point and the origin which is the reliability index (see Figure 2.20). This substitution leads to equation 2.21.
( ) ( ) ( ) (Eq 2.21)
2.4.2.5 Computation of failure probability
23 towards the failure region (see Figure 2.20). The inner product of and is the length between the design point and the origin (see equation 2.22).
(Eq. 2.22)
Next step is find the failure probability as in equation (see also ‘standard normal space’)
( ) (Eq. 2.23)
2.4.2.6 FORM sensitivity analysis
In FORM, the partial derivative in the design point, with respect to the coordinates of the design point in the standard normal space is a measure of sensitivity (Hamed, M et al, 1999):
(Eq. 2.24)
with
( )
( ) (Eq. 2.25)
and
[
] (Eq 2.26)
with
= reliability index with p_f= Φ(-β)
= Input variables in normal space
= sensitivity of parameter in the design point
The vector gives a measure of change in the reliability index when a basic random variable is adjusted. The partial derivatives are estimated at the design point, so they only reflect the sensitivity with respect to small changes in the random variables at that point.
2.4.3 Monte Carlo
The Monte Carlo simulation technique has a repeated sampling of each of the variables from their respective distributions as basis. The limit state function will be evaluated for each sample of combined random variables ( ( ) ). The probability of failure will be estimated as the ratio of samples for which ( ) , , to the total number of samples (see eq 2.27). The mathematical background information about the required number of samples is described in Appendix B.
(Eq 2.27)
2.4.3.1 Importance sampling
24 probability density function ( ). f(x) are the actual probabilities, which are replaced by l(v).
∫ ( ) ( )( ) ( ) (Eq. 2.28)
∑ ( ( )) ( )
( )
(Eq. 2.29)
In this formula is the sample taken from the importance sampling function ( ).
The samples are taken in the area close the point of and thus lying near the failure domain. The selection of the reduces the variance in . This method requires prior knowledge about the failure area.
2.4.3.2 Example calculation ‘Monte Carlo with Importance Sampling’
Figure 2.21 shows the calculation of the dune profile of the Palace Hotel with Monte Carlo. Values for each input variable is random sampled. 10.000 iterations are used for this calculation. It can be seen that none of the 10.000 combinations of input parameters leads to failure. This is caused by the fact that the failure probability of the dune at the Palace hotel is in the order of 10-7. Since the Monte Carlo simulations shows no failure points, it
cannot produce reliable results.
Figure 2.21 Calculation Palace Hotel with Monte Carlo
Figure 2.22 shows the same calculations as in Figure 2.21 with the difference that Importance Sampling on the water level is used. The Importance Sampling is set to values for the water level with probability of occurrence between the 10-6 and 10-7 (the values on
25
26
3
M
ODEL SET
-
UP
This chapter describes the model set-up of the semi-probabilistic and probabilistic dune erosion model. This chapter starts with a short description of the semi-probabilistic model. Then, the probabilistic model without NWO’s will be described. This model will be validated with previous studies and the probabilistic part of the model will be validated with Monte Carlo with importance sampling. Thereafter, the effect on dune safety of NWO’s is implemented in the model according to the DnA rules.
3.1
S
EMI-
PROBABILISTIC MODEL DESCRIPTIONThe semi-probabilistic dune erosion model is the current statutory safety assessment model, which is described in the introduction, and is extended with the DnA rules. DUROS+ will be used with the hydraulic input parameters that are described in the HR2006. These hydraulic input parameters are based on probabilistic calculations. An extra retreat distance as result of the impact on dune safety of NWO’s will be calculated according to the DnA rules. These rules will be applied as described in section 2.3. Input for NWO dimensions is case specific, but in general, the dimensions could be approximated with a normal distribution because there is no reason to suspect an asymmetric distribution. Values for NWO dimensions in the semi-probabilistic test will be the mean plus one standard deviation, which is the same principle as for the surcharges for DUROS+ model uncertainty and uncertainty in storm duration.
3.2
P
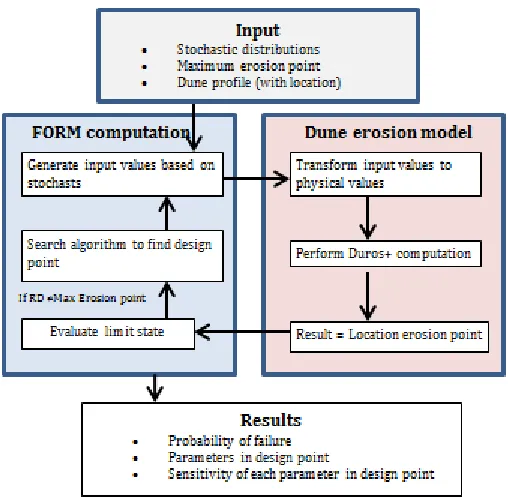
ROBABILISTIC MODEL DESCRIPTIONThe probabilistic safety assessment model is a combination of DUROS+ and the First Order Reliability Method (FORM). FORM is chosen because this is a very efficient probabilistic method for small failure probabilities. Figure 3.1 shows the overview of the probabilistic model without the effect on dune safety of NWO’s included.
Stochastic distributions for the required DUROS+ input are based on the equations as in section 2.2. These stochastic distributions are a conditional Weibull distribution for the water level and normal distributions for the significant wave height, peak wave period, grain size, storm duration uncertainty and DUROS+ model uncertainties. These distributions contain some location specific variables, which are calculated by the model when the location is defined with the JARKUS id.
27
Figure 3.1 Overview probabilistic dune erosion model
3.2.1 Input
The required model input is stochastic distributions, a maximum erosion point and a dune profile.
Stochastic distributions
[image:37.595.186.440.97.346.2]Model input is based on the equations in section 2.2, but the stochastic distributions in this stage of the model are a dimensionless probability value for the water level. This is the probability input for the water level in equation 2.7. Values for the significant wave height and peak wave period are expressed with an uncertainty distribution in this stage of the model. These values are the standard deviations from the equations in section 2.2.
Table 3.1 Stochastic input variables
Variable Variable Distribution Values Probability water level Ph [-] Normal ,
Uncertainty significant wave height [m] Normal
Uncertainty peak wave period [s] Normal
Grain size [ m] Normal
Uncertainty in storm duration [-] Normal
DUROS+ model uncertainty [-] Normal
Maximum erosion point
28
Figure 3.2 Limit state: separation between the safe and failure region, the red spot represents the erosionpoint, the blue spot the maximum erosion point, the dotted line is the post storm DUROS+
profile (based on WL\Delft Hydraulics (1987))
Dune failure probability
Dune failure probability is defined as the probability of occurrence of the most likely combination of input parameters that lead to an erosion point that is located landward of the maximum erosion point. The failure probability for dune safety is very small (order: 10-5) which means that probabilistic methods like Monte Carlo need many computations
for reliable results. The First Order Reliability Method is a very efficient method and is therefore used as basis method.
Dune profile
The dune profile can be a reference profile or a real JARKUS profile (see section 2.1.2 ‘dune profile’). The model user needs to specify the topographic location for the derivation of the location specific input parameters (see section 2.2).
The first order reliability method does suffice for most of the JARKUS-profiles, but Monte Carlo with Importance Sampling is a good alternative when FORM does not suffice. This could be the case when the profile has large fluctuations in the dune crest.
3.2.2 FORM computation and dune erosion model
The FORM computation and dune erosion model are the iterative part of the model. This part of the model iterates until the design point is found (See Section 2.4.1 for explanation ‘design point’).
Generate input based on stochastic distributions
Samples for the input parameters are sampled with FORM, based on stochastic distributions as in Table 3.1. FORM samples seven values for each input parameter. Six of these values are constant and one value varies. In this way, FORM can indicate the relation between each input parameter and the result.
Transform probability input values into physical values
29 uncertainty in storm duration ( ) and DUROS+ model uncertainty ( ) are based on the values that are generated by FORM in the previous step.
Table 3.2 Physical input vales
Variable Probabilistic Distributions
h [m] Cond. Weibull Equation 2.8, with Ph generated in previous step
[m] Normal Generated in previous 1
[s] Normal [ | ] Generated in previous step
[ m] Normal Generated in previous step [-] Normal Generated in previous step [-] Normal Generated in previous step
Perform DUROS+ computation
The DUROS+ computation is performed with the values that are generated in the previous step. The result of this computation is a location of the erosion point.
Limit state function
The limit state function is defined as the horizontal distance between the maximum erosion point and the actual erosion point (see equation 3.1). The limit state function (see equation 3.1) gives a negative value in case of system failure and a positive value when the system does not fail (see section 2.4 ‘limit state’).
(Eq. 3.1)
With:
Z(x) > 0 represents the safe state
Z(x) = 0 represents the limit state surface Z(x) < 0 represents the failure state
The model shows results when the design point is found (limit state function equals zero). It is very unlikely that the design point is found during the first iteration step because the FORM computation starts at the origin where the failure probability is very high (See Section 2.4.1 'Standard normal space'). A new iteration starts until the design point is found.
Search algorithm to find design point
FORM has an indication about the correlation of each parameter with the dune failure probability (negative/positive, high/low) because all variables were changed once in the first iteration step.
Next iteration step starts with again seven samples for each variable, FORM adjust the variables in the way they get closer to a value of zero for the limit state function. This iterative process continues until the most probable failure point in the dune is found. A more mathematical description of ‘finding the design point’ is described in section 2.4.1.
3.2.3 Result
30 3.2.3.1 Example model results: Palace hotel case(without inclusion of NWO)
The maximum erosion point for the Palace Hotel case is set at x = -73m (10-5 failure point
for the semi-probabilistic safety test, see Section 2.1). The JARKUS profile with ID 8006575 and year 2012 are used for the Palace Hotel case.
The design point was found within 30 iteration steps, giving a failure probability in the design point at x=-73m is 8.9*10-6. This failure probability hardly deviates from the 10-5
failure probability of the probabilistic test. The input variables of the semi-probabilistic test are almost equal to the values in the design point at x=-73m(see Table 3.3).
Table 3.3 Values parameters in the design point at x=-73m for the Palace Hotel without NWO
Semi-probabilistic input parameters Values parameters design point
[m] 5.8 5.6
[m] 9 9.1
[s] 15.5 15.1
[ m] 178 176
[-] 0.1 0.04
[-] 0.15 0.08
Insight in dune failure probability
The model is also performed for locations on the Palace Hotel dune profile between x=50m and x=-150m with stepsize 5m (without NWO). Figure 3.3 shows the failure probabilities for these locations on the dune profile. The 10-5 erosion point is at x=-72m,
which is 1m seaward of the erosion point in the semi-probabilistic test.
Figure 3.3 Failure probability Palace hotel case (without NWO)
3.3
M
ODEL VALIDATION31
3.3.1 DUROS+ validation
The DUROS+ part of the model is validated using deterministic input and compared to outcomes of WL|Delft Hydraulics, TU Delft and Alkyon (2007).
WL|Delft Hydraulics, TU Delft and Alkyon (2007) calculated the retreat distance and amount of erosion for several locations along the Dutch coast with hydraulic conditions and grain size as input. The model accounted additional erosion for uncertainties in storm duration and model accuracy of respectively 10% and 15% of the total amount of dune erosion above storm surge level.
The initial model of this study calculates locations of the erosion point, and the WL|Delft Hydraulics, TU Delft and Alkyon (2007) calculates the retreat distance. Both models should produce the have the same definition of the end result to compare them. The initial model of this study will be adjusted to produce the same outcomes for this comparison.
Retreat distance
The retreat distance for this validation step is defined as the difference between the crossing of the 5m depth contour with the pre-storm profile and the erosion point of the post-storm profile. Figure 3.4 shows the definition of retreat distance for this model validation.
Figure 3.4 Definition retreat distance for model validation
32
Table 3.4 Retreat distance and amount of erosion for the WL|Delft Hydraulics, TU Delft and Alkyon (2007) model and the initial model of this study
2007 model Initial model Location RD (m) A (m3/m) RD (m) A (m3/m)
#01 Den Helder 91.3 339 91.4 340
#02 Botgat 76.4 421 76.6 422
#03 Zwanenwater 70.8 551 70.9 552
#04 Tweede Korftwater* 70.9 425 71.1 426
#06 Zandvoort 93.7 643 93.8 645
#09 Monster 72.2 206 72.3 207
#10 Hoek van Holland 35.3 10 35.4 10 *Calculated without additional erosion (2004 jarkus profile misses data)
3.3.2 FORM validation
The failure probabilities for the Palace Hotel are calculated with the use of MC(IS) and with FORM for a reference profile and a JARKUS-profile. 10.000 samples are taken with importance sampling on the water level (most important parameter) in the Monte Carlo computation. Importance sampling on the water level is performed for water levels with a probability of occurrence between 10-3 and 10-8, using uniform sampling.
Figure 3.5 shows the failure probability on a reference profile using the input parameters for the location of the Palace Hotel and Figure 3.6 shows the failure probability of the JARKUS profile at the location of the Palace Hotel. Both situations are calculated with the probabilistic erosion model as described in Section 3.2 with FORM and Monte Carlo with Importance Sampling. It can be seen that the probabilistic methods do not show significant different results.
These same analyses are performed for other dune profiles in Appendix C. These analyses also show similar results for FORM as for Monte Carlo. This indicates that FORM shows reliable results.
Figure 3.5 failure probability of the reference
profile with input for the Palace Hotel Figure 3.6 Failure probability of the JARKUS profile at the Palace Hotel using JARKUSid:8006575 with year: 2012
3.3.3 Total model validation
33 inclusion of variations in the initial profile for this analysis. The retreat distances with their probabilities of occurrence are calculated with Monte Carlo with importance sampling and with FORM.
Table 3.5 shows the retreat distances for three probabilities of occurrence, these distances show the same results for both studies. The retreat distances of the Deltares (2014a) study are shown in a range because of inaccuracies in the visual interpretation of the data.
Table 3.5 Retreat distances with probabilities of occurrence
Deltares (2014a) Initial model Probability of occurrence RD RD
1999 10-3 40-45 m 43 m
10-4 58 – 63 m 59 m
10-5 80 - 85 m 83 m
2000 10-3 40-45 m 43 m
10-4 58 – 63 m 59 m
10-5 80 - 85 m 82 m
2004 10-3 36 – 41 m 37 m
10-4 55 - 60 m 56 m
10-5 78 – 83 m 80 m
3.4
S
TOCHASTIC DISTRIBUTIONSD
NA
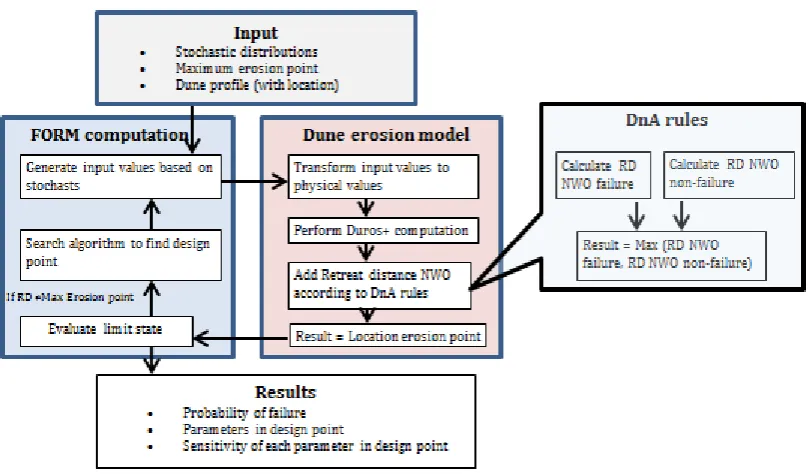
RULESSection 3.2 described the initial probabilistic dune erosion model without inclusion of the impact on of NWO’s dune erosion. The impact of NWO’s on dune safety will be implemented according to the DnA rules (Deltares and Arcadis, 2014a) in this initial probabilistic dune erosion model. The DnA rules contain several uncertainties, which can be divided in model uncertainty and parameter uncertainty. Stochastic distributions for these uncertainties have to be developed to implement the DnA rules in the probabilistic model.
Model uncertainty depends on how accurate the DnA formulas in combination with DUROS+ describe reality. Important characteristic of model uncertainty is that this kind of uncertainty is present even if there is not a single unknown model parameter. The discrepancy between the predicted model outcomes and reality is called model inadequacy (Kennedy, M and O’Hagan, A, 2001). Choices of the inclusion/exclusion of relevant events (model assumptions) and a lack of understanding the underlying true physics leads to model inadequacies. Parameter uncertainty comes from the input parameters for the model whose exact values are unknown.
Stochastic distributions have to be developed for these uncertainties to include the DnA rules in the probabilistic dune erosion model. For NWO failure, stochastic distributions will be developed for model uncertainty, parameter uncertainties (NWO dimensions and critical threshold for wet/dry NWO’s, see section 2.3.1). For NWO non failure, stochastic distributions will be developed for the -factor, which is the only variable/parameter in the equation (see equation 2.12).
3.4.1 NWO failure: Model uncertainty
34 3.4.1.1 Analysis model uncertainty
An initial erosion point without the influence on dune safety of NWO’s will be calculated with the dune erosion models. This erosion point will be shifted according to the DnA rules, which is the ‘result of the DnA rules’. The dune erosion model will also calculate the influence of the NWO on dune safety. The difference between the result of the dune erosion model with and without NWO is the ‘result of the dune erosion model’.
DUROS+ showed the same results as the DnA rules, except for the situation when the erosion point is beneath the NWO. But it is likely that DUROS+ does not produce very reliable results for these cases (see Appendix E1).
The same analysis is executed for DurosTA as for DUROS+. The initial erosion point of DurosTA is located at another location than the DUROS+ erosion point, while the same input is used. However, this analysis is about the extra dune retreat distance behind this point. So, this difference does not influence the results when this erosion point is used for the calculations with the DnA rules. DurosTA shows on average 16 per cent with a standard deviation of 13 per cent larger retreat distances than the DnA rules.
The same analysis as for DurosTA is executed for XBeach. Again, the initial erosion point of XBeach differs from DUROS+ and DurosTA. However, this is not a problem as mentioned earlier, because this analysis is about the extra retreat distance as result of the impact on dune erosion of NWO’s. XBeach shows on average 33 per cent with a standard deviation of 12 per cent larger retreat distances than the DnA rules.
Differences between the models are caused by the fact that the DUROS+ and the DnA rules are completely based on a volume balance while DurosTA and XBeach are process-based models. Bathymetry developments influence the wave height development and erosion processes at the dune in DurosTA and XBeach.
3.4.1.2 Stochastic distribution for model uncertainty: and Critical Threshold
DnA model uncertainty will be implemented in the model the same way as DUROS+ model uncertainty because this model has the closest relation with the DnA rules (both methods are based on a volume balance). This means that the DnA model uncertainty is implemented in the model based on a normal distribution with mean = 0 and standard deviation = 0.15. The sign that is used for this stochastic distributions in the rest of the report is:
DurosTA and XBeach showed larger retreat distances than the DnA rules, so it should be studied if the model uncertainty has large influence on dune safety with the probabilistic model.
The influence of the critical threshold for wet/dry NWO's can be investigated apart from the general model uncertainty because this threshold is an extra parameter in the DnA rules. The critical threshold for wet/dry NWO’s is set to 2.5m in the DnA rules, this value contains uncertainty. There is no indication whether this should be higher or lower than the mean, so a normal distribution suits for this uncertainty. The mean will be 2.5m with a standard deviation of 0.25 m.
3.4.2 NWO failure: Parameter uncertainties