O F F SHORE T I D E G A U G E D A T A
by
G A A L C O C K and J M V ASS IE
Irish Sea Celtic Sea
Southern N o r t h Sea N o r t h Bay of Biscay Northern N o r t h Sea
1 9 7 2 , 1 9 7 3 , 1974 1973
1973 1973 1974
D A T A REPORT NO. 7 1975
Worm ley, Godalming, Surrey, GU8 BUB.
(0428 - 79 - 4141)
(Director: Dr. A.S. Laughton)
Bidston Observatory, Birkenhead,
Merseyside, L43 7RA. (051 - 653 - 8633)
Crossway, Taunton,
Somerset, T A 1 2DW. (0823 - 86211)
(Assistant Director: Dr. D.E. Cartwright) (Assistant Director: M.J. Tucker
OFF SHORE T I D E G A U G E DATA
b y
G . A . A L C O C K and J.M. V A S S I E
Irish Sea Celtic Sea
S o u t h e r n N o r t h Sea North Bay of B i s c a y N o r t h e r n N o r t h Sea
1 9 7 2 , 1 9 7 3 , 1 9 7 4 1 9 7 3
1 9 7 3 1 9 7 3 1 9 7 4
DATA REPORT NO,
1 9 7 5
Institute of Oceanographic Sciences B i d s t o n Observatory,
B i r k e n h e a d ,
A b s t r a c t
Type I Off-shore tide gauge
Page
Type II Off-shore tide gauge 5
Drift removal and Tidal Analysis 9
R e p o r t Format 14
D e p l o y m e n t Station 'GE ' 1972 16
'LCBl ' 1973 18
'C ' 1973 20
'LB ' 1973 22
'¥I ' 1973 24
'WE ' 1973 26
'ZO ' 1973 28
'LCB2 ' 1973 30
'J ' 1974 32
tp ' 1974 34
'E ' 1974 35
'H ' 1974 37
A B S T R A C T
This report describes the results from various
deployments of O.S.T.G.s (Off Shore Tide Gauges) by
the Bidston L a b o r a t o r y of the Institute of
Oceanographic Sciences in the U.K. shelf seas from
1972 to 1974. The positions of the deployment
stations are shown on Fig.l.
A description of the loggers and sensors used
on the gauges is given, followed by details of data
reduction and analysis. D e t a i l s of the launch and
recovery phases of each deployment are included and
the m e a s u r e m e n t s made by each sensor are presented
60'N
Br#*t
\ L C 8 2 200m
1 .
TYPE I O.S.T.G. (Designated IOS¥ on computer plots)
(i) L o g g e r and transducers
This type of OSTG was developed at the I.O.S. W o r m l e y
Laboratory (formerly N a t i o n a l Institute of O c e a n o g r a p h y ) "by
P. Collar and R. Spencer and has been used in a series of
deployments along the northwest European continental shelf
(Collar and Cartwright 1972, Cartwright 1975). It
incorporates a sea-bed mounted pressure transducer interfaced
to a 12 channel N o r m a l a i r - Garret data logger housed in a
56 cm diameter aluminium pressure sphere. The FM (frequency
m o d u l a t e d ) transducer consists of a diaphragm w h i c h when
flexed by changing hydrostatic pressure varies the gap of a
parallel plate timing capacitor in a LC oscillator circuit.
The pressure casing enclosing the transducer circuitry is
evacuated so that absolute rather than relative pressure is
measured. The frequency output is divided down to about
100 Hz and is counted over a period of 890s to average out the
unwanted fluctuations due to waves: this sampling period gives
approximately 50 dB (99.999^) attenuation of energy from 10s
period w a v e s , but only 0,006 dB (0.14^) attenuation of
semi-diurnal tidal energy (Collar and S p e n c e r 1970). Pressure
sensitivities of the FM07 sensor were 0.97 Hz cm"^ for the deployment at station "GE" 1972, 0.98 Hz cm-1 for station "C" 1973, and 0.84 Hz cm-1 for station "ZO" 1973. Pressure
sensitivities of the F M 3 2 sensor were 1.27 Hz cm-1 for station "J" 1974 and 1.47 Hz c m " ! for station "H" 1974.
The data logger has twelve input channels. Two are pulse counting channels having resolutions of 1 in 10^ and 1 in 10^ respectively and are used to record the 4 most significant and 3 least significant digits of the pressure transducer output. Two have parallel 4 decade B.C.D. (binary coded decimal)
the transducer pressure casiog aod io contact w i t h the sea, and the other from a thermistor mounted inside the sphere. Two
other analogue channels m o n i t o r the supply voltages to the
transducer and logger circuits. A voltage sawtooth of period
2h derived from a low torque potentiometer driven by a high
precision mechanical clock is applied to a fifth analogue
channel; this provides a recorded time check for each scan of
the twelve channels and is used to check continuity of scans in the data processing. The integration period of 890s and
the subsequent 10s scanning and recording sequence are
controlled by 900s pulses from a crystal clock. The reading
from each channel is recorded serially in either 3 or 4 decade
B.C.D. on % in magnetic tape and a parity bit is added during
each scan by the digital serializer, the packing density on
the tape is 150 bits per inch. A synchronizing signal is
recorded on a second track of the tape to assist in translating
the magnetic tape to paper tape during the data processing.
(ii) Calibration
All pressure/frequency calibrations w e r e carried out by m e m b e r s of the R e s e a r c h Technology Group of I.O.S. Bidston using the pressure chamber at W o r m l e y . P r e s s u r e in the oil-filled chamber was controlled using a Texas Precision
Gauge incorporating a quartz bourdon tube w i t h an optical
servo-system; a n o t h e r servo-system controlled the speed of
rotation of a pump to maintain pressure in the chamber...
Temperature in the insulated c h a m b e r was kept constant to
within 0.1°C by a b a n k of chillers. Once the temperature of
the chamber had settled to the predetermined value, a
calibration run was made over the available pressure range of
0 . 2 X 10® N m ~ ^ to 2 X 10® N m ~ ^ (approximately equivalent to
a water depth of 20m to 200m), and this was repeated for a range of temperatures in order to provide information on the
temperature dependence of the p r e s s u r e / f r e q u e n c y relationship.
F M 0 7 had a temperature coefficient equivalent to 39.6 cm
3.
37.9 cm at station "C" 1973 (95m); and 45.7 cm at station "ZO" 1973 (23m). F M 3 2 had a temperature coefficient
equivalent to 28.5 cm at station "J" 1974 (94m) and
27.3 cm at station "H" 1974 (l37m).
The calibration of the thermistors was carried out at
Bidston u s i n g a Lauda w a t e r bath, the temperature of which
could be controlled to a few m i l l i d e g r e e s , and a digital
test set to display the output from the appropriate logger
channel. A l l the data from the pressure and temperature calibrations w e r e fitted to low order polynomials using a
least squares method computer program.
(iii) L a u n c h and recovery
The sphere containing the data logger and interfacing
electronics was mounted in a tripod framework made of
tubular steel w i t h the pressure transducer mounted on the
base of the framework and b e n e a t h the sphere. The tripod
was supported on a disposable heavy ballast frame consisting
of welded girders and the two frames were connected by three
corrodible m a g n e s i u m alloy links and a pyrotechnic release
mechanism. A c o u s t i c transmitting and receiving magneto-strictive scrolls w e r e carried above the sphere and were
used in recovery of the gauge.
The tide gauge was deployed by winching it down on a
wire to within a few metres of the sea bed; the w i r e being
attached by a Levitt release m e c h a n i s m to lines fixed to
framework. When the gauge was near the sea bed, a brass
m e s s e n g e r was sent down the wire, triggered the release and
the gauge dropped on to the sea bed.
The tide gauge was located prior to recovery using one
or two pairs of hydrophones streamed from the ship to pick
was fired by acoustic command and the gauge rose to the surface u n d e r the sphere's positive b u o y a n c y . A flashing
Xenon lamp helped visual sighting of the tide gauge when it
was on the surface and it was hauled on board after grappling the line attached to the framework.
(iv) Data processing
The magnetic tape from the logger was translated into
A S C I I II code on punched paper tape using a N o r m a l a i r Garrett
tape translator and punch at W o r m l e y , and this tape was processed at Bidston using the in-house IBM 1130 computer. The data on the paper tape were read into disk storage using a program, developed by M . A m i n , w h i c h translates the A S C I I II code into m a c h i n e compatible code, checks each scan of the twelve channels for illegal characters and correct scan length and sets any incorrect scan to zero.
A second correction program checked the record for continuity using the data recorded on the mechanical clock channel, and checked the absolute values and differences between sequential values against predetermined upper and lower bounds for all channels except the pressure frequency channels. The two pressure frequency channels were checked for correct overlap and combined to form the integrated
frequency count over the 890s period. All scans w i t h errors were listed together w i t h values of integrated frequency at
3h intervals; all corrected data w e r e stored on disk.
A third program calculated the temperatures recorded by the thermistors mounted in the sphere and pressure transducer casing and used the latter to correct the pressure frequency, using the frequency temperature coefficient, to the reference
temperature at w h i c h the pressure/frequency calibration had been carried out. The polynomial fit for this calibration was then used to calculate the values of pressure recorded by
IITE II O.S.T.G. (Designated lO&B on c o m p u t e r plots)
(i) L o g g e r and transducers
The data logger was developed by Marconi Space and Defence Systems Ltd., in conjunction w i t h the Bidston Laboratory of I.O.S. (Skinner and Rae 1974). The logger can sample a maximum
of twenty input channels at periodic intervals and record their
values by means of an incremental tape recorder in a computer compatible format. A n y input channel is capable of sampling
either B.C. (Direct C u r r e n t ) or frequency modulated A.C.
(Alternating C u r r e n t ) inputs - the FM inputs can be sampled for periods of 15/64, 15/16, 3%^ 15 or 60 seconds or
"continuously", i.e. the integrating time is virtually equal to the sampling period of the data from the channels. The n u m b e r of channels scanned can be truncated to less than
twenty and the "data recycling time" can be 1^, 3^, 7^, 15, 30 or 60 m i n u t e s . An integration time of 899.9949 and sampling
time of 900s for each channel were used for all deployments,
and all twenty channels have been used in order, where possible, to achieve redundancy recording on two separate channels the pressure or temperature output from each transducer. Each channel contains a voltage to FM converter which permits
handling of voltage inputs in the same way as signals. Each channel is recorded as four six bit binary characters, each w i t h an associated parity bit to give odd parity. The most
significant character is used for control purposes and the
Sensor packs used w i t h the logger incorporated both a pressure and a temperature sensor and w e r e completely self-contained units w i t h their own sensor electronics and power supplies. Different types of pressure sensor based on either vibrating wire, quartz crystal and strain gauge systems have been used on the tide gauge. Two types of vibrating wire sensor have been used: the Vibroton model 8140 (Lefcort 1968) and the Ocean Applied R e s e a r c h model W S - 7 0 4 . In each type, a tungsten wire is stretched between a rigid frame and a
diaphragm and mounted in a magnetic field. A n y movement of the diaphragm due to a change of pressure w i l l increase or decrease the tension of the w i r e and hence change its natural frequency of oscillation. The wire is connected in the
feed-back loop of an amplifier and thus makes a variable frequency oscillator w h e r e frequency is a function of pressure. To achieve temperature compensation^ the coefficient of expansion of the supporting frame is designed to b a l a n c e the expansion of the w i r e , the transducer of the Vibroton sensor is
evacuated and that of the OAR is filled w i t h a small amount of dry nitrogen.
The quartz crystal type sensors used w e r e Hewlett Packard Oceanographic pressure probes model D-101 and consist of a 5 MEz quartz resonator coupled by piezoelectric action to an electronic oscillator and mounted in an oil filled case
adjacent to a pressure case containing the electronic
circuitry. A second closely matched quartz crystal resonator is mounted in the pressure case and is therefore not exposed to hydrostatic pressure and is used for t e m p e r a t u r e
compensation by heterodyning the frequency outputs of the two crystals. The sensors used had crystals w i t h matched turning points at about 0°C, so that the temperature coefficient was a minimum at this temperature.
7.
of output to input voltage of the traoaducer W h e a t a t o n e bridge network. The circuit waa originally developed for temperature measurement, using a platinum reaiatance thermometer in the bridge network, and waa the basia of the temperature aenaora used on the tide gauge (Butlin 1974). The thermometer la
fitted into the copper heat sink in which each of the pressure
sensors are m o u n t e d . The temperature resolution of the system
was of the order of 1 m ° C .
(ii) Calibration
A l l the transducers w e r e calibrated for pressure sensitivity
uaing the facilitiea at W o r m l e y ; tempeeture calibrations were carried out at Bidaton, aa deacribed in the previoua section (ii).
For the La Chapelle B a n k deployment in June 1973, the VIB 1/2, HP 3/2, and SG 2/I aenaora were uaed, with pressure
senaitivitiea of 0 . 0 3 8 hz cm"!, 0 . 1 2 8 hz cm"l, and 0.070 hz cm"l respectively; and temperature coefficients of 6.0 cm
22.5 cm and 213 cm°C"^ respectively.
F o r the Liverpool Bay deployment in June 1973, the VIB l/l,
VIB 1/3 and HP 3/l sensors w e r e used, w i t h pressure sensitivities of 0.040 hz cm"^, 0 . 0 3 8 hz cm"^, and 0.126 hz cm"^ respectively;
and temperature coefficients 2.8 cm 9.9 cm and
O H
26.0 cm C " respectively.
F o r the Jonsdap "WI" deployment in September 1973, the
VIB 1/2 and SG 2/3 sensors w e r e used, w i t h pressure sensitivities
1 — 1
of 0.039 hz cm and 0 . 0 4 6 hz cm respectively; and temperature
coefficients 5.1 cm and 182 cm respectively. For the
Jonsdap "WE" deployment in S e p t e m b e r 1973, the V I B I/3 and SG 2/I sepsors were used, w i t h pressure sensitivities of 0 . 0 3 6 hz cm"^ and 0.091 hz cm respectively; and temperature coefficients
11.3 cm and 176 cm respectively.
0.128 hz cm" , and 0.071 hz cm" respectively; and temperature
coefficients of 3.2 cm 4.5 cm °C"^, 22.5 cm ^C~^, and
218 cm respectively.
F o r the north N o r t h Sea "F" deployment in O c t o b e r 1974,
the OAR 4/1, V I B I/2, and SG 2/5 sensors w e r e used, w i t h
— 1 — 1
pressure sensitivities of 0 . 0 4 0 hz cm" , 0 . 0 3 7 hz cm" , and
0 . 0 4 7 hz cm"^ respectively, and temperature coefficients of
1.3 cm °C"^, 4.9 cm °C"^, and 181 cm respectively. For
the north N o r t h Sea "E" deployment in N o v e m b e r 1974, the
OAR 4/2, V I B 1/3, and SG 2/3 sensors were u s e d , w i t h pressure
sensitivities of 0.043 hz cm ^, 0 . 0 4 0 hz cm ^, and 0.041 hz cm~^
respectively, and temperature coefficients of 3.4 cm ^C"^,
9.0 cm °C"^, and 247 cm °C"^ respectively.
(iii) Launch and recovery
The data logger and its batteries were housed in a 56 cm
diameter aluminium sphere w i t h sufficient space left within
the sphere for sensor batteries, acoustic release electronics
and ancillary sensor electronics. W a t e r tight connectors
mounted on the ports of the sphere enabled sensors external
to the sphere to be powered and their output signals fed into
the sphere. The sphere and a n u m b e r of sensor packs w e r e mounted
in an aluminium sub-frame w h i c h in turn was protected by a heavy
steel outer frame.
During the launch phase, a toroidal b u o y was deployed first
followed by its anchor weight. The tide gauge was then lowered
on to the sea bed by winch w i t h the telemetry cable taped to its
w i r e . The data being recorded on the tape w e r e monitored
throughout the launch and after satisfactory data had been
received from the gauge on the sea bed, the telemetry link was
disconnected and the spar buoy released. F i g . 2 shows the
deployment configuration.
Before recovery, the tide gauge's acoustic command system
was switched to its transmission mode to aid location of the
OFF SHORE TIDE GAUGE MOORING SYSTEM INSTITUTE OF OCEANOGRAPHIC SCIENCES. BIDSTON
FLASHING LIGHT
RADAR REFLECTOR
I
TOROID0
TELEMETRY CONNECTION TO SHIP USED DURING DEPLOYMENT ONLYFLASHING LIGHT (
/
CHAIN SWIVEL D SHACKLE
12mm WIRE ROPE LENGTH 11/2 D
Q
1200 LB ANCHOI CHAIN
SPAR BUOY
o
8 m m WIRE ROPE LENGTH 11/2 D
WITH TELEMETRY
CABLE ATTACHED
TIDE GAUGE
12mm WIRE ROPE 1^/2D 12mm WIRE ROPE i V z D
up, followed by the anchor weight and toroidal buoy. If the spar buoy was missing then a grapple was used to drag for the wire connecting the tide gauge to the anchor weight.
(iv) Data processing
The magnetic tape from the logger was copied, w i t h a density of 1800 bpi, on to a 9 track magnetic tape using a program
written by A . Davies for the IBM 360/65 computer of the Liverpool U n i v e r s i t y Physics D e p a r t m e n t . The data from all the channels were listed and each channel m a n u a l l y checked for sensor failure prior to recovery. Subsequently the program was re-run to punch on to cards the data from the appropriate channels. The IBM 1 1 3 0 computer was used to check the frequency data from each
temperature sensor channel, calculate and plot the temperatures and store them on disk. A second program checked and calculated the frequencies from each pressure sensor channel, used the
temperature value and the pressure frequency/temperature
coefficient to correct each pressure frequency to the frequency at the reference temperature, and calculated the pressures using the pressure/frequency calibration. The ^ hr values of pressure were plotted, stored on disk and punched on to cards.
Drift Removal and Tidal A n a l y s i s
An interpolation program was used on the IBM 370/165
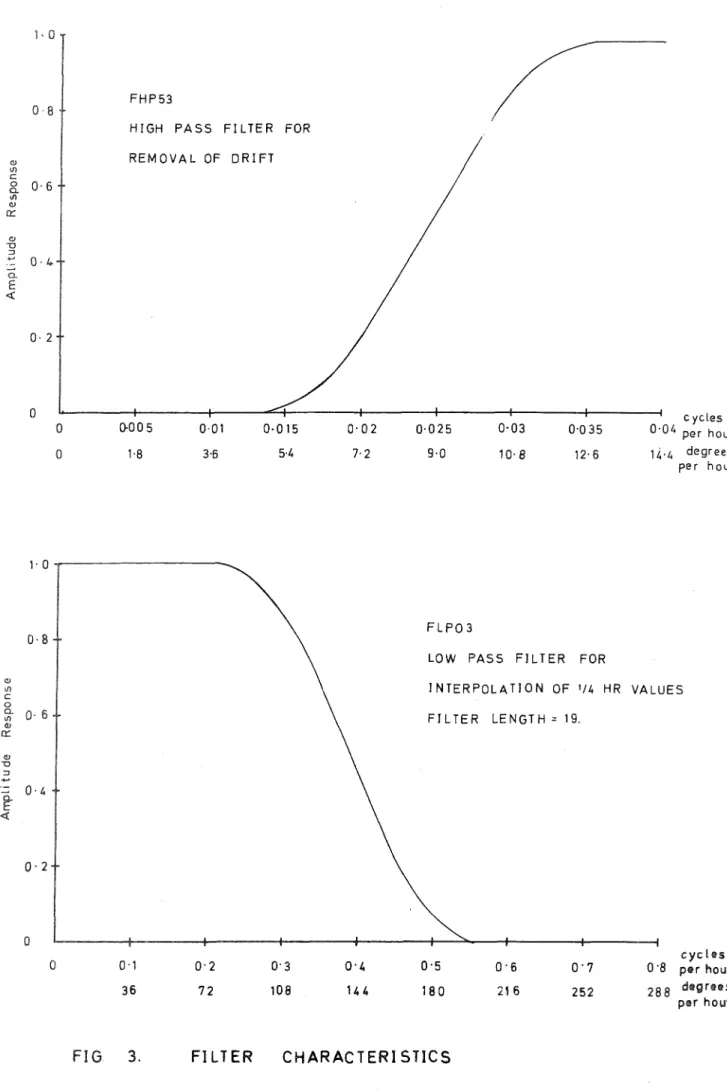
computer at the SRC D a r e s b u r y Laboratory, using the Bidston 1130 as a R J E (Remote Job E n t r y ) terminal, to produce an output on punched cards of hourly values, on the h o u r (GMT), of the pressure record. This program smoothed the data using a low pass filter, FLP03, of half length 18 and a cut off frequency (halfpower point) of 0.35 cycles per hour (126° per hour) -thus the amplitude response of the sixth diurnal band was
a.
E <
^ 0
0 8
0 6
0 4
0 2
F H P 5 3
HIGH PASS FILTER FOR
REMOVAL OF DRIFT
0-00 5 0-025 0 0 35
c ycles per hour
degrees per h o u r
1 0
F L P 0 3
LOW PASS FILTER FOR
INTERPOLATION OF 1/4 HR VALUES
FILTER LENGTH - 19.
0 1
36
0 2
7 2
0 3
108
0 4 0 5
1 8 0
0 - 6
21 6
0 7
2 5 2
0 "8 per hour
2 8 8 ' 8 per hour
to launch and after recovery). Root mean square errors due to
the interpolation method are of the order of 0 . 0 2 mb. F o r
those deployments of the type I tide gauge for w h i c h no
temperature record w a s available, h o u r l y values of the integrated
frequency were computed using the interpolation program and the
corresponding temperature corrections made using h o u r l y values
of temperature measured by an adjacent bottom-mounted current
m e t e r and supplied by J. Howarth.
Each hourly value obtained using the interpolation program
was the total pressure measured by the tide gauge, i.e. the sum
of the pressures due to the w a t e r column and air column above
the sensor. The latter was subtracted u s i n g the hourly value
of atmospheric pressure computed for the tide gauge position
u s i n g a computer program w h i c h fitted a plane to pressures at
adjacent shore stations supplied by the B r i t i s h , French and
Irish M e t e o r o l o g i c a l Services. The computed w a t e r pressures
w e r e converted to elevation using the hydrostatic equation,
for which the appropriate value of density w a s calculated
from density/depth profiles at the station obtained w i t h the
CTD (Conductivity/Temperature/Depth) Instrument during the
cruise and processed b y S. Loch.
The record of hourly values of the w a t e r head measured by
the tide gauge contained drift signals superimposed on the
tidal signal; this drift was a combination of geophysical
non-tidal effects such as surges, and any transducer
time-dependent drifts (in the case of the capacitance plate
transducer, probably caused by m e c h a n i c a l instability of the
diaphragm (Collar and Spencer 1970)). The non-tidal drift was
removed using a program on the 370 w h i c h , by applying a tidal
analysis to sequential blocks of 25 hourly values using the
main tidal constituent in species 1, 2, 4 and 6, generated a
drift curve composed of a series of the n e a r l y tide-free Zo
values. This process allowed a slight leakage of tidal energy
11.
t h e r e f o r e a tenth order polynomial w a s fitted to the drift curve
and the polynomial removed from the original record to leave the
pure tidal record. The drift curve contained most of the energy
b e l o w 0.5 cycle per day. Twelve hours of data w e r e lost at the
b e g i n n i n g and end of each record.
For some records this technique w a s not powerful enough tu
remove the drift, e.g. the V i b r o t r o n l/l sensor deployed at
station 'LCB2' had a drift w h i c h w a s h i g h l y non-linear w i t h an
overall drift of n e a r l y 30m compared w i t h a tidal range of 3.5m.
C o n s e q u e n t l y , a high pass numerical filter, FHP 53, w a s
designed w i t h a cut off frequency (half-power point) of 0.027
cycles per hour (9,8° per hour). This filter had a half length
of 72 and so three days of data w e r e lost from the b e g i n n i n g
and end of the record. The response of this filter is shown in fig. 3.
The two methods of removing drift w e r e tested using a test deck formed by adding 32 tidal constants for Southend to a
drift curve from the F M - t y p e sensor in such a w a y that the
m a x i m u m v a r i a t i o n of the drift curve equalled the tidal range,
and then removing the drift using the 25 hr analyses method and the h i g h pass filter m e t h o d . A 29 day period of the resulting drift-free record obtained using each method was analysed and the results compared w i t h the original Southend constants. The results are displayed in Table 1 and it can be seen that b o t h m e t h o d s satisfactorily removed the drift.
Tidal analyses of a 29 day period of the drift-free record
obtained from each deployment w e r e carried out using the T.I.F.A. (Tidal Institute F l e x i b l e A n a l y s i s ) program w h i c h utilises the h a r m w n i c method of a n a l y s i s . For the Jonsdap "WI" and n o r t h N o r t h Sea deployments, the analyses w e r e carried out using
the T . I . R . A . (Tidal Institute Recursive A n a l y s i s ) program. For all deployments except "H" Jonsdap "Wl", the amplitude and phase lag relative to G r e e n w i c h epoch of 27 major and 8 related constituents w e r e computed, the time zone b e i n g G r e e n w i c h M e a n
and all related in a m p l i t u d e and phase to and 0 ^
to N ; T and K to S . For n o r t h N o r t h Sea "H", 10 major
" 2 Ci
and 5 related constituents w e r e computed, to 0^; to K^;
Ng and Lg to , and to S^. For J o n s d a p "WI", 22 major and
17 related constituents w e r e computed, to 2Q^; and
to 0^^ P^, and to K^; to 00^; M N S g and
2Ng to N g , O g , and to and to ; and M S N ^
to 2SM . A l l relations w e r e computed from tidal analyses of
records from shore tide gauges in the deployment area, except
for Jonsdap "WE" for w h i c h equilibrium tide relations w e r e used
due to the proximity of the deployment p o s i t i o n to a n a m p h i d r o m i c
CONSTITUENT SOUTHEND
H A R M O N I C CONSTANTS
H (ft)
G
(deg)
25 ER A N A L Y S E S
M E T H O D
H
(ft)
G
(deg)
H I G H PASS FILTER
M E T H O D
H (ft) G (deg) Zo
ii
0 0 ^2N_
fi-i
M ,
T!
2SMr
M O . M ) M K :
SNj MS^ 2MN, M MSNf 2MSt 2SM,
20. 000 19. 990 20. 002
0. 180 126. 70 0. 183 127. 07 0. 180 126. 36
0. 456 188. 62 0. 4 5 1 188. 4 0 0. 453 188. 98
0. 007 152. 34 0. Oil 155. 14 0. 008 147. 93
0. 025 299. 36 0. 025 299. 94 0. 025 299. 45
0. 136 344. 32 0. 137 344. 90 0. 137 344. 4 0
0. 383 9. 78 0. 385 10. 36 0. 385 9 . 87
0. 019 71. 4 0 0. 019 71. 98 0. 019 71. 49
0. 016 23. 46 0. 016 24. 04 0. 016 23. 55
0. 0 3 4 91. 16 0. 040 93. 44 0. 035 96. 20
0. 015 201. 08 0. 015 206. 09 0. 015 191. 39
0. 227 351. 47 0. 227 351. 46 0. 227 351. 57
0. 4 3 2 94. 08 0. 426 94. 24 0. 429 94. 33
1. 188 325. 67 1. 187 325. 66 1. 188 325. 77
0. 363 317. 98 0. 363 317. 97 0. 363 318. 08 6. 771 352. 88 6. 767 352. 89 6. 771 352. 89
0. 566 29. 51 0. 580 30. 16 0. 579 30. 4 4
0. 122 35. 65 0. 122 35. 65 0. 122 35. 65
1. 9 9 4 48. 85 1. 991 48. 85 1. 988 48. 85
0. 574 47. 01 0. 573 47. 01 0. 572 47. 01
0. 130 269. 62 0. 135 269. 00 0. 133 267. 73
0. 170 120. 17 0. 168 120. 97 0. 168 120. 55
0. 056 96. 18 0. 054 94. 60 0. 053 96. 55
0. 160 298. 31 0. 159 296. 75 0. 159 297. 4 4
0. 111 309. 31 0. ill 309. 30 0. 110 309. 41
0. 351 6. 67 0. 351 6. 42 0. 352 6. 69
0. 008 100. 73 0. 007 98. 13 0. 008 84. 82
0. 127 63. 56 0. 126 64. 60 0. 127 63. 9 0
0. 086 8. 86 0. 091 9. 21 0. 090 8. 5 4
0. 160 35. 30 0. 162 35. 58 0. 161 35. 77
0. 041 62. 76 0. 037 60. 4 4 0. 038 62. 37
0. 165 82. 44 0. 168 82. 12 0. 169 82. 06
0. 042 132. 93 0. 045 132. 48 0. 044 131. 73
Refereoces
Butlin, R . S , 1974. "Description of phase shift oscillator
circuit for temperature and pressure measurements". I.O.S. Report N o . 8 .
Cartwright, D.E. 1975. "Shelf-boundary tidal measurements
between Ireland and N o r w a y " . 7th Liege Colloquium on
ocean h y d r o d y n a m i c s . (in press).
Collar, P.G. and Spencer, R. 1970. "A digitally recording
off-shore tide gauge". Proceedings of conference on
electronic engineering in ocean technology. Institution of Electronic and Radio Engineers.
Collar, P.G. and C a r t w r i g h t , D.E. 1972. "Open sea tidal
m e a s u r e m e n t s near the edge of the northwest European
continental shelf". Deep-sea Research, ]_9, pp.673-689,
Lefcort, M . G . 1968. "Vibrating wire pressure transducer
technology". Journal of Ocean Technology, 2, 2,
pp.37-44 .
Report of SCOR W o r k i n g Group 27, "Tides of the open sea".
1975. "An intercomparison of open sea tidal pressure
sensors". Unesco technical papers in marine science,
N o . 2 1 .
Skinner, L.M. and Rae, J.B. 1974. "The use of pressure
sensors for tidal and w a t e r level m e a s u r e m e n t s " . P r o c e e d i n g s of the European Symposium on off shore
data acquisition systems, Southampton. Society of
14,
F O R M A T
The report is split into sections, one f o r each deployment,
each section comprising a page of launch and recovery details,
a page of data reduction details, and the record from each
sensor displayed in two computer plots and a table of Lhe
tidal constituents obtained by analysis of the tidal record.
Launch and recovery details
OSTG position
W a t e r depth
OSTG details
Time of deployment
Time of recovery
CTD casts
Comments
General area. Station identification and year. Latitude and Longitude.
Measured at launch by CTD and/or
sonar, or taken from A d m i r a l t y Chart.
Type, L o g g e r number. Sensor type(s) and number(s).
Time of launch of gauge from ship, time that gauge was on sea bed.
Time that gauge surfaced or was brought
on board ship.
Time and duration of any CTD casts on station.
Comments on the launch and/or recovery.
Data reduction details
Timing
Raw data
Times of specific scans and timing error.
Times of start and end of raw sea-bed
pressure data.
Temperature record Details of t e m p e r a t u r e recordfs) available,
Atmospheric pressure Stations used to c o m p u t e atmospheric pressure record.
Drift-free data
Tidal analysis
Times of start and end of drift-free
hourly w a t e r head data. Method used to produce drift free data.
Period analysed and station used for related constituents.
C o m p u t e r plots
(1) Plot of temperature record(s).
( 2 ) Plot of tidal record and drift curve of the
h o u r l y record of w a t e r head data.
Analysis
Table of amplitude and phase (G - referred to lunar
transit at Greenwich and time zone S = O ) of 27
m a j o r and 8 related consituents of tidal record
1 6 ,
OSTG poBition
D e p t h of w a t e r
OSTG details
Time of deployment
Time of recovery
CTD casts
Comments
Station 'GE', Irish Sea, 1972 Lat 53026.5'N Long 0 5 O 2 2 ' W .
85m (chart 1598).
Type I, logger 41, sensor FM 4882/07.
Launched from "John M u r r a y " 1830 GMT day 251 (Sept.7th).
On sea bed 1930 GMT.
Surfaced 1130 GMT day 284 (Oct.10th) "John M u r r a y " .
1 cast 2000 GMT day 251.
13h period of ^ h casts 0 6 1 0 to 2003 GMT day 264 (Sept.20th).
25h period of ^h casts 0 2 0 0 day 276 (Oct.2nd) to 0300 day 277.
During the initial deployment on day 250 (Sept.6th), the tide gauge was prematurely released before launch and one leg of the frame hit the deck. On inspection the only observable damage was a crack on the bottom framework but the deployment was postponed. A thorough internal inspection of the tide gauge revealed no damage.
Timing
Raw pressure data
Temperature data
A t m o s p h e r i c pressure data
Drift free data
Tidal analysis
Scan 242 1930.00 GMT day 250 (Sept.6th) Scan 3486 1429.25 GMT day 284 (Oct.10th)
Clock fast, gained 35s over 33d 19h.
Start 2122.34 GMT day 251 (Sept.7th) End 0 9 5 2 . 0 0 GMT day 284
Complete records of sphere and transducer temperature.
H o u r l y values from Dublin (Irish Met S e r v i c e ) 3h values from R o n a l d s w a y and V a l l e y (British Met Office).
Start 1400 GMT day 252 (Sept.8th)
End 1700 GMT day 283 (Oct. 9th)
25h analyses used to produce drift curve w i t h fitted 10th degree polynomial removed
from original record.
TIFA 0000 GMT day 253 to 2300 GMT day 281
using related constituents from Holyhead (1 year analysis 1958/1959).
OSTG FLMl/O/ SEP/OCT 1972
IRISH SEA 'GE' LAT 53 2G.5N LCN3 05 22W
S i A TEMPERATURE. (DEGREES LELSTUS)
a EgE as S54 am BG2 am =4
gun nn
s t a t i o n 'GE', Irish Sea, Lat 53°26.5'N Long 05°22'W
W a t e r head data 0 0 0 0 day 253 to 2 3 0 0 day 281 1972.
^Related constituent using Holyhead (1 y e a r analysis
1958/1959).
Type I, Logger 41, Sensor FMOT
Symbol
Q i
^ 1 ^ 1 " ^ 1 ^ 1 ^ 1
* 2N_
P2 ^ 2 ^ ^ 2
^ 2 S
^ 2 * K g
2SM2
^ 3
^ 4 M S ^ 2MN_
o ^ 6 2MS_
o
H G
(cm) (deg)
3.0 0.1
10.2 4 2 . 1
0.1 298.7
3.3 178.2
9.6 191.1
0.9 259.7
5.6 257.1
5.0 187.9
27.4 285.0
5.2 291.8
138.3 309.2
5.7 315.7
2.3 0.3
43.7 344.2
13.3 336.4
2.6 259.9
1.6 243.1
2.7 40.5
7.2 54.0
4.6 97.3
0.6 254.8
0.6 262.6
0.6 304.6
OSTG position
D e p t h of w a t e r
OSTG details
Time of deployment
Time of recovery
CTD casts
Comments
Station 'LCBl', N o r t h B a y of B i s c a y 1973 Lat 47045'N Long 07Ol2'V
174m (Admiralty chart 1104)
Type II, logger 02, sensors HP 3/2, SG 2/l, and Vih l/l.
Tide gauge shackled and lowered from "John M u r r a y " 1031 GMT day 152 (June Ist).
On sea bed 1042 G M T .
Tide gauge on board "John M u r r a y " 2017 GMT day 185 (July 4th).
3 casts at 1129 GMT, 1137 GMT, 1151 GMT day 152.
19,
Timing
Raw pressure data
2nd scan at 1413.45 GMT day 150 (May 3oth) 2nd telemetry scan on recovery at 2043.54 GMT day 185 (July 4th).
Clock slow, lost 8s in 35d 6|^h.
Start 1051.15 GMT day 152 End 2006.22 GMT day 185
Temperature data
A t m o s p h e r i c pressure
data
Drift free data
Tidal analysis
Comments
Complete record of
HP 3/2 and SG 2/l.
sensor temperatures from
3h values from St. M a r y ' s (Scilly Isles M e t Office), Brest-Guipavas (French Met Service), and Ocean W e a t h e r Ship "Kilo" (Daily W e a t h e r Reports).
Start 0600 GMT day 153 End 0100 GMT day 185
25h tidal analyses used to produce drift curve w i t h fitted 10th degree polynomial removed from original record.
TIRA 0000 GMT day 155 to 2300 GMT day 183
using related constituents from Brest (1 y e a r analysis 1973).
H P 3 / 2 TEkPERATlfE (DEGREES CELSIUS)
S G 2 / 1 TEkfERATLK: (DEGREES CELSIUS)
s t a t i o n 'LCBl', N . B a y of B i s c a y . Lat 47°45'N Long 07°12'¥
W a t e r head data 0 0 0 0 day 155 to 2 3 0 0 183 1973
^Related constituent using B r e s t analysis (1 year 1973)
Type II, Logger 02, Sensors H P 3/2 and SG 2/l.
S y m b o l B P 3/2 SG 2/l
H G E G
(cm) (deg) (cm) (deg)
2.3 2 80.3 2.2 280.8
0 6.7 326.2 6.5 326.8
M 0.6 2 8 9 . 4 0.6 293.0
* 2.7 64.9 2.6 65.1
K 7.2 70.8 7.0 71.0
0.6 102.5 0.6 97.0
* 2N 3.9 51.2 3.7 52.0
4.3 73.5 4 . 0 69.1
Ng 26.9 82.8 25.7 83.6
* ^ 2 4.8 83.4 4.6 84.2
M 128.9 102.4 123.5 102.6
Lg 4.6 111.8 4.2 117.4
* T 2.5 124.0 2.3 125.6
Sg 4 5 . 0 137.1 41.8 138.7
* Kg 12.6 134.7 11.7 136.3
2SM2 0.2 131.0 0.7 305.1
Mg 1.0 336.4 1.0 334.2
0.6 292.8 0.6 273.3
M 1.0 320.9 1.0 316.0
M S 0.3 348.0 0.6 309.8
2MN 0.1 314.3 0.1 69.7
Mg 0 . 1 10.0 0.2 15.5
2MSg O.Og 38.7 0.2 323.7
OSTG position
D e p t h of w a t e r
OSTG details
Time of deployment
Time of recovery
CTD casts
Comments
Station ' C , C e l t i c Sea 1973.
Lat 5lO02.9'N Long 0 6 0 5 6 . 6 ' W .
95m (chart 1598)
Type I, logger 41, sensor FM 4882/07
Launched from "John M u r r a y " 1923 GMT day 153 (June 2nd)
On sea bed 1929 GMT.
Surfaced 0941 GMT day 187 (July 6 t h ) On board "John M u r r a y " 0 9 4 5 GMT.
1 cast 1727 GMT day 153.
13h period of ^ h casts from 1216 GMT day 165 (June 14th) to 0116 GMT day 166.
25h period of ^ h casts from 0528 GMT day 172
(June 2l8t) to 0 6 3 0 GMT day 173.
21
Timing
Raw pressure data
Scan 9 2100.00 GMT day 152 (June 1st)
Scan 3347 1529.35 GMT day 187 (July 6th) Clock fast, gained 258 over 34d 18^^.
Start 1937.35 GMT day 153 (June 2nd)
End 0837.10 GMT day 187
T e m p e r a t u r e data
A t m o s p h e r i c pressure data
Drift free data
Complete record of sphere temperature but sea temperature circuit failed on deployment.
Temperature record from bottom mounted current m e t e r used for correction of frequency record.
H o u r l y values from Roches Point and Rosslare
(Irish M e t . Service). 3h values from St.
M a r y s , Scilly Isles (British Met. Office).
Start 1200 GMT day 154 (June 3rd)
End 1100 GMT day 186 (July 5th)
25h tidal analyses used to produce drift
curve w i t h fitted 10th degree polynomial removed from original record.
Tidal analysis TIFA 0000 GMT 157 to
constituents from St,
1968 to 1973).
2300 185 using
Mary's (6 y e a r
related analysis
(OLGRZS CELSIUS)
juuum.
laO Ifil lEB iB3
! % % I :
SOFT F%E idRl
W a t e r head data 0 0 0 0 day 157 to 2300 day 185 1973
^Related constituent using St.Mary's, Scilly Islands
(6 years analysis 1968/1973)
Type I, Logger 41, Sensor FM07.
*
*
*
*
Symbol H G
(cm) (deg)
Qi 1.9 313.6
Ol 4.8 353.6
^ 1 0.8 327.2
Pi 1.3 111.9
4.1 114.2
^1 0.4 151.5
4.3 100.9
4 . 4 156.3
^ 2 31.1 124.0
^ 2 6.2 119.1
^ 2 162.6 144.2
^2 9.3 149.8
^2 3.3 181.7
^2 55.0 189.5
^ 2 15.8 186.5
SSMg 0.5 76.0
^ 3 0.9 54.1
2.4 188.8
^ 4 4.6 221.3
1.4 278.4
2 M N .
o 0.9 114.6
«a 1.2 157.1
2MS_
o 0.9 214.4
2 2 .
OSTG position
D e p t h of w a t e r
OSTG details
Time of deployment
Time of recovery
CTD casts
Comments
Station 'LB', Liverpool B a y , 1973
Let 5 3 0 3 0 ' N Long 03013'V.
9.9m ODN (Mersey Docks and H a r b o u r Company chart of L i v e r p o o l Bay 1970).
Type II, logger 03, sensors H P 3/l, V I B l/l,
VIB 1/3.
Launched 1237 GMT day 155 (June 4th) from "John M u r r a y " .
On sea bed 1241 G M T .
Oo board "Vigilaat" 0900 GMT day 204
(July 23rd).
N o n e . A v e r a g e density value for J u n e / J u l y
from data recorded at Liverpool B a y
Light V e s a e l 1935-1946.
An initial recovery attempt was made on 20th July but conditions were too rough. The vessel "Vigilant" was used for
Timing
Raw pressure data
Temperature data
Scan one at 1044-40 GMT day 154 (June 3 r d )
Scan 5486 at 1359-43 GMT day 211 (July 30th) Clock slow, lost 3s in 57d 3h.
Start 1437-10 GMT day 155 (June 4th)
End 1 4 2 2 - 1 2 GMT day 198 (July 17thj
Complete record of temperature from each sensor.
A t m o s p h e r i c pressure 3h values from Bidston O b s e r v a t o r y ,
linearly interpolated to give h o u r l y values.
data
Drift free data
Tidal A n a l y s i s
Comments
Start 1900 GMT day 158 (June 7th)
End 1000 GMT day 195 (July 14th)
FHP 53 filter used.
TIFA days 159 to 187 using related constituents from Hilbre Island (1 y e a r analysis 1964/1965).
D u e to logger m a l f u n c t i o n , the data were retrieved from the magnetic tape and listed b y M a r c o n i Ltd., and relevant channels subsequently m a n u a l l y punched on cards by personnel of the
« f 3 / l TE&PERATURE
msnmi
CETG mmng
L D t P P O O L BAY ' L B ' LAT 5 3 SON LM5 0 3 1 3 #
vmixa TQPowTur
(OEO^ES CELSILE)
Vm/l IQfERATUC (DECREE CELSILE)
--=-= <:::: :;::,. <: =:::
~
=:::::c:::::::::J :::::::::=-c:::::::j :::;::::..
=::::: r:::::::>
=
:;::::::::>I
::=:-"'"
•
"'" Ii•
•
::=> :::::::=--=:-.:;:=> ::==
::;:::;::> :;::,. <::::=:::::
=
=-==
r:::::::> =-::=>=-•
•
=-<:: ='" \I ::::::> ~ ~==
;::::::::>='" =
= : .:=
:::>
==
-=:--F='"~ It
" I" I I I I I I , I t ' , I I I I I I ~
station 'LB', Liverpool B a y , Lat 53°30'¥ Long 03°i3'¥
W a t e r head data 0 0 0 0 day 159 to 2300 day 187 1973
^Related constituents using H i l b r e Island (l y e a r
analysis 1964/65)
Type II, L o g g e r 03, Sensors H P 3/1, VIB l/1 and VIB l/3,
Symbol E P 3 / 1 VIB l/l VIB 1/3
H G H G H G
(cm) (deg) (cm) (deg) (cm) (deg)
Qi 4.3 341.7 4 . 1 351.4 4 . 1 350.1
Ol 10.3 32.6 10.7 34.9 10.6 34.6
^ 1 1.0 342.9 0.9 335.2 1.0 331.1
" Pi 4.3 172.6 4.6 171.7 4.3 177.0
^ 1 11.8 179.3 12.6 178.4 12.9 177.0
^1 1.1 277.8 1.4 263.7 1.3 261.5
* 2*2 10.4 262.1 9.8 259.7 9.9 259.4
5.4 7.8 3.1 27.9 3.4 26.7
* 2 57.2 295.4 54.2 293.0 54.6 292.7
"^2 12.2 294.0 11.5 291.6 11.6 291.3
^ 2 306.4 316.8 287.7 315.3 2 9 0 . 4 315.6
^ 2 17.4 335.5 15.3 337.5 15.7 338.5
" ^2 5.9 358.3 5.6 357.5 5.7 357.4
^2 100.7 359.5 95.4 358.7 96.4 358.6
29.5 357.8 28.0 357.0 28.3 356.9
2SMg 0.6 303:0 0.9 244.5 0.7 249.0
^ 3 2.9 297.9 3.0 306.0 3.0 304.0
m 8.2 163.6 9.0 168.3 8.7 168.3
- 4 18.0 192.4 17.2 195.3 17.1 196.3
M S ^ 7.5 247.4 7.6 250.4 7.5 250.4
2MN 2.8 25.6 2.4 336.5 2.6 342.5
"a 3.3 54.8 3.6 8.2 3.7 13.6
2MS_
6
2.1 82.4 2.3 55.4 2.4 59.9
OSTG position
D e p t h o f w a t e r
OSTG details
Time of deployment
Time of recovery
CTD casts
Station Southern N o r t h Sea, 1973
Lat 52028'N Long 0 2 O l 3 ' E .
39m (PDR)
Type II, logger 03, sensors SG 2/3, V I B 1/2,
Launched from s.s, "Profiler" and in w a t e r
1843 GMT day 249 (Sept.6th).
On sea bed 1848 GMT.
On hoard "John M u r r a y " 1642 GMT day 292 (Oct.19th).
1 cast 1900 GMT day 249.
casts from 1659 GMT day 255 to 0 6 0 0 GMT day 256.
1 cast day 261, day 280, day 286.
25.
Timing
R a w pressure data
1st telemetry read out 1915.15 GMT day 249 Last scan 1045.17 GMT day 310.
Clock slow, lost 2s in 60d 15^h.
(1) Start 2052.45 G M T day 249 End 1557.45 GMT day 257 (2) Start 0952.46 GMT day 270 End 1622.46 GMT day 292
T e m p e r a t u r e data A s for raw pressure data
For SG 2/3 and VIB l/2
A t m o s p h e r i c pressure H o u r l y data from Valkenburg Z E and De Kooy
data (Netherlands M e t . Institute), 3h data from
Gorlestone (British Met. Office).
Drift free data (1) Start 0 2 0 0 day 253
End 0500 day 257
( 2 ) Start 1600 day 270
End 1200 day 289
FEP 53 filter u s e d .
Tidal analysis
Comments
TIRA analysis of 15 days of data from days 271 to 285 using related constituents from Lowestoft (lyear analysis 1964/1965).
D i s c o n t i n u i t y of ^ 225 mb at 1800 G M T day 252.
Due to a logger malfunction, the tape drive
stopped after 1600 GMT day 257 and re-started for scan at 1000 GMT day 270.
The constants w e r e also derived using a response analysis b e c a u s e of the high noise level on the records, and the standard error was computed
using the f o r m u l a 1
R e s i d u a l variance x 27.3
S . E . = i X
Recorded variance ]&o^of days of data
Standard errors for diurnal band w e r e 19.7% in amplitude and 11.3° in phase for VIB 1/2 and
17.56% and 10.1° for SG 2/3.
Station 'VI', S o u t h e r n N o r t h Sea 1973
Lat 52°28'N Long 0 2 ° 1 3 ' E
Drift free w a t e r head FHP53 filter
Days 271 to 285 1973
* Related constituent using Lowestoft (1 y e a r analysis
1964/1965)
S y m b o l VIB l/2 SG2/3
H G H G
(cm) (deg) (cm) (deg)
2Q. 1.5 211.7 1.4 315.2
* 2.2 246.8 2 . 0 350.3
* Q4 4 . 2 105.2 3.8 106.1
* 0.9 76.0 0.8 76.9
14.3 162.3 12.8 163.2
* -rr! 0.2 152.2 0.2 151.7
*
?!
3.8 310.7 4 . 1 310.2* s ! 0.9 264.1 1.0 263.6
9.6 320.3 10.4 319.8
* 0.7 202.2 0.8 201.7
* 0.8 4 0 . 4 0.8 39.9
* 2.0 147.6 1.7 126.0
oof
1 1.9 188.2 1.7 166.6
* MNS_ 0.2 318.5 0 . 4 305.0
* 2N^ 2.8 2 9 4 . 7 5.3 281.2
2.0 149.4 3.8 135.9
* 7.4 2 4 8 . 0 9.3 243.0
*
Op 2.0 263.9 2.6 258.9
M ; 38.0 276.9 4 8 . 0 271.9
*
Lp
1.4 311.4 1.7 306.4* T
9 0.6 307.7 0.6 322.9
Sg 12.1 305.6 12.8 320.8
*
Kp 3.5 308.2 3.7 323.4
* M S N , 0.3 2 9 6 . 4 2.0 68.4
2SM2 0.2 263.6 1.3 35.6
MOq 1.2 73.7 0.8 98.2
0.7 170.1 2.2 179.7
MK=
1.2 185.4 2.0 184.1
M N 2 . 0 4 . 1 6.3 205.9
6.5 30.7 2.4 272.0
2.6 245.6 7.1 101.5
M S ^ 2.7 36.9 8.2 64.3
2MN_ 1.5 293.7 1.8 243.3
^ 6 2.1 341.1 1.0 232.7
M S N : 5.6 119.3 3.0 86.6
2MS% 6.5 139.5 4 . 1 147.1
2 S M :
OSTG I0SB03
J]\GDAP 'WI' SEP/OCT 1 9 7 3 LAT 5 2 2 3 4 LCN3 0 2 13E
Viai/g lEMlHlMUt
iun#*&y m STIR)
SOB/3 T E M B W T U E (OEBREES CELSIUS)
\
! X % % X : ; ; ; ; ;
OSTG position
D e p t h of w a t e r
OSTG details
Time of deployment
Time of recovery
CTD casts
Comments
Station 'WE', Southern N o r t h Sea, 1973
Lat 52027.I'N Long 030l4.5'E.
35m (PDR)
Type II, logger 02, sensors SG 2/l, V I B l/3.
Launched from s.s. "Profiler" and on sea bed
1034 GMT day 251 (Sept.8th).
On board "John M u r r a y " 1527 GMT day 296 (Oct.23rd).
1 cast at 1235 GMT and 1255 GMT day 251
1 cast at 1759 GMT day 258 1 cast at 0644 GMT day 261 1 cast at 1851 GMT day 285
27,
Timing
R a w pressure data
T e m p e r a t u r e data
1st telemetry read out 1059.30 GMT day 251
Last scan 1014.24 GMT day 310. Clock fast, gained 6s in 58d 23-jh.
Start 1207.00 GMT day 251
End 1206.56 GMT day 294 Start 1207.00 G M T day 251 End 0951.56 G M T day 293
VIB 1/3
SG 2/1
Complete record of temperature data for b o t h sensors.
A t m o s p h e r i c pressure data
Drift free data
H o u r l y data from Valkenburg ZH and De K o o y (Netherlands M e t Institute), 3h data from G o r l e s t o n e ( B r i t i s h Met Office).
Start 1700 G M T day 254 for VIB 0000 GMT day 255 for SG End 0700 GMT day 291 for VIB
2300 G M T day 286 for SG
F H P 53 filter used.
Tidal analysis
C o m m e n t s
TIFA 0000 G M T day 258 to 2300 G M T day 286
using equilibrium tide relations.
D i s c o n t i n u i t i e s of 120 mb at 1700 GMT day 260
350 0 2 0 0 271
150 1000 274
The constants w e r e also derived using a response analysis because of the high
noise level on the records and the standard error computed.
Standard errors for diurnal band were 1 8 , 4 %
in amplitude and 10.5° in phase for VIB 1/3 and 19.16% and 11.0 for SG 2/l.
Standard error for semidiurnal band was
Station 'WE', Southern North Sea 1973
Lat 52°27.1'N Long 03°14.5'B
Drift free water head FHP 53 filter. Days 258 to 286
1973
^Related constituent using equilibrium tide
Symbol VIB 1/3 SG 2/l
E G E G
(cm) (deg) (cm) (deg)
Q 2 . 6 1 6 0 . 0 3 . 9 1 4 0 . 7 o } 1 1 . 2 1 7 6 . 4 1 2 . 7 1 7 8 . 7 0 . 5 1 8 3 . 1 0 . 5 7 2 . 1 * n j 0 . 2 3 3 8 . 6 0 . 2 3 3 5 . 9
* pi 3.7 338.6 4.0 335.9 11.2 338.6 12.1 335.9
* 0.1 338.6 0.1 335.9
* 0.2 338.6 0.2 335.9
5 1 1.5 94.2 1.7 75.7
o o l 1 . 1 1 2 5 . 9 1 . 0 8 8 . 0
* 2N 0.3 240.5 0.5 231.5 6.2 183.6 6.5 182.2 2.5 240.5 3.6 231.5 * 0 ; 0.5 240.5 0.7 231.5 15.4 53.9 16.5 44.1
L% 1.0 131.8 0.8 119.7
* Tg 0.2 170.8 0.1 166.6
S^ 2.7 170.8 2.3 166.6
* 0.7 170.8 0.6 166.6
2SM^ 1.9 333.9 1.3 325.1 M0_ 0.5 298.3 0.4 268.0 0.4 282.1 0.8 291.0 MKg 0.6 249.0 0.3 224.7
M N 1.7 55,5 1.8 57.8
8.4 102.0 9.3 95.1 SNj 1.6 132.5 1.9 130.5 M S ^ 6.2 143.4 6.5 137.5
2MN_ 0.7 143.4 0.9 43.8
2.0 100.9 2.6 89.3
MSN^ 1.1 107.5 1.3 90.4
2MSb 2 g 142.0 3.4 133.1 2SMc 0.6 203.4 0.7 208.9
SG2/1 inEGHEES Ul 5IU5)
TE&ftRATlW LFtGRLES CEi-SIUSi
! % % % % I ; ; ;
OSTG p o s i t i o n
D e p t h of water
OSTG details
Time of deployment
T i m e of recovery
CTD casts
Comments
S t a t i o n 'ZO', S o u t h e r n N o r t h Sea, 1973
Lat 54*19.5'N Long 01*14.5'E.
23m (chart 1408)
T y p e I, logger 41, sensor FM 4 8 8 2 / 0 7
T i d e gauge launched from s.s. 'Profiler' and in w a t e r for tests at 1258 GMT day 252 (9th S e p t e m b e r ) . Finally released at 1446 GMT.
T i d e gauge o n hoard 'John Murray' at
1440 GMT day 297 (24th October).
Series of ^ h casts from 1831 GMT day 256 to
0659 GMT day 257.
29,
Timing 1st autoscan 1745.00 GMT day 248
Scan a f t e r recovery 1514.10 GMT day 297
Clock fast, gained 509 in 48d 21^^.
Raw pressure data
Temperature data
Start 1507.33 GMT day 250 End 0651.50 GMT day 292
T h e r m i s t o r channels failed after 3d ISfh. Temperature data used from Current M e t e r deployed nearby.
A t m o s p h e r i c pressure 3h data from Kilnsea and Gorlestone (British
data Met O f f i c e ) , H o u r l y data from De K o o y (Dutch
Met Institute).
Drift free data Start 0000 GMT day 254
End 2300 GMT day 288
FHP 53 filter used.
Tidal analysis TIFA analysis for period 0 0 0 0 GMT day 259 to
2300 GMT day 287 using related constituents from Inner D o w s i n g (1 y e a r 1972/1973).