Analysis and Optimisation of
Model-Based Insulin Sensitivity and Secretion
Tests
Nor Azlan Othman
A thesis submitted for the degree of
Doctor of Philosophy
in
BioEngineering
at the
University of Canterbury,
Christchurch, New Zealand.
iii
Acknowledgements
Firstly, praise to Allah for showering his blessings and grace towards me.
To my supervisors, Distingushed Prof J.Geoff Chase, Dr. Paul D. Docherty and Dr. Geoffrey Shaw, thanks for having faith in me. Thanks for the inputs and guidance throughout the completion of this thesis.
To all my colleagues in the Centre of BioEngineering, Dr Chris, Dr Chiew, Dr Matt, Dr Ummu, Guo, Musabir, Hisham, Jennifer, Shun, Hina, Alexander, Liam, Felicity, Daniel, Kent, thanks for the friendship and help.
To all my friends in Christchurch, NZ, to get to know all of you is an honour, to be friend with all of you is the best thing happens in my life but to have all of you by my side through good times and bad is priceless.
To my family, thanks for all the unconditional support and encouragement.
v
Table of Contents
Abstract ... xiii
Chapter 1. Introduction ... 1
1.1 Glucose ... 2
1.2 Insulin ... 4
1.3 Pathogenesis of Type 2 diabetes mellitus (T2DM) ... 6
1.4 Preface ... 10
Chapter 2. Review of model-based insulin sensitivity (SI) tests ... 12
2.1 Introduction ... 12
2.2 Overview of insulin sensitivity test ... 13
2.2.1 Euglycaemic hyperinsulinaemic clamp (EIC) ... 13
2.2.2 Intravenous glucose tolerance test (IVGTT) ... 14
2.2.3 Oral glucose tolerance test (OGTT) ... 16
2.2.4 Homeostasis model assessment (HOMA) ... 17
2.2.5 Dynamic insulin sensitivity and secretion test (DISST) ... 17
2.3 Summary ... 18
Chapter 3. 3-parameter identification of model-based insulin sensitivity assessment ... 22
3.1 Introduction ... 22
3.2 DISST Model ... 25
3.3 Parameter identification ... 28
3.3.1 2-parameter identification approach... 28
3.3.2 3-parameter identification approach... 29
3.4 Summary ... 30
Chapter 4. The necessity of identifying the basal glucose set-point in the Type 2 Diabetes ... 31
4.1 Introduction ... 31
4.2 Methods ... 33
4.2.1 Participants ... 33
4.2.2 Clinical procedure ... 34
4.2.3 Physiological model ... 35
4.2.3.1 DISST Model ... 35
4.2.4 Parameter identification ... 36
vi
4.4 Results ... 38
4.5 Discussion ... 43
4.6 Summary ... 47
Chapter 5. Impact of identifying the basal glucose set-point on model-based assessment of insulin sensitivity ... 48
5.1 Introduction ... 48
5.2 Methods ... 49
5.3 Statistical analysis ... 50
5.4 Results ... 50
5.5 Discussion ... 56
5.6 Summary ... 61
Chapter 6. Model-based identification of endogenous insulin secretion ... 62
6.1 Introduction ... 62
6.2 Existing deconvolution approach ... 64
6.3 UN model ... 70
6.4 Summary ... 72
Chapter 7. Development of a proportional-derivative control model for the endogenous insulin secretion response to glucose ... 73
7.1 Introduction ... 73
7.2 Methods ... 75
7.2.1 Participants and Data ... 75
7.2.2 Clinical procedure ... 75
7.2.3 Physiological models ... 76
7.2.3.1 DISST model ... 76
7.2.3.2 Proportional-derivative (PD) endogenous insulin secretion (UN) model ... 76
7.2.4 Parameter identification ... 77
7.3 Statistical analysis ... 79
7.4 Results ... 80
7.5 Discussion ... 83
7.6 Summary ... 86
Chapter 8. The efficacy of the PD UN model in identifying the condition stage of a participant ... 87
8.1 Introduction ... 87
vii
8.3 Statistical analysis ... 90
8.4 Results ... 90
8.5 Discussion ... 97
8.6 Summary ... 102
Chapter 9. Conclusions and future work... 104
9.1 Conclusions ... 104
9.2 Future work ... 108
9.2.1 The role of basal glucose (GB) ... 108
9.2.2 Endogenous insulin secretion model (UN) ... 109
9.2.3 Real time assessment of insulin sensitivity and secretion ... 109
viii
List of Figures
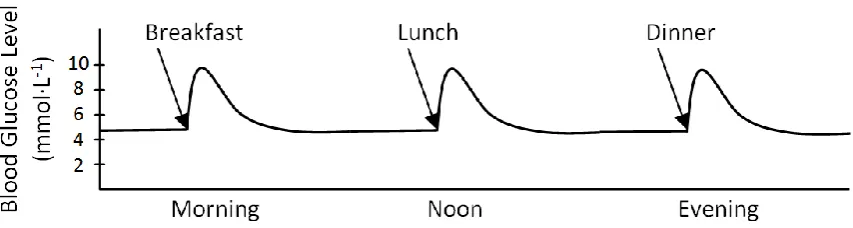
Figure 1.1: Schematic illustration of the effect of blood glucose level after meal... 3
Figure 1.2: Effect of insulin on glucose uptake and metabolism. Adapted from http://biology-pictures.blogspot.co.nz/. ... 5
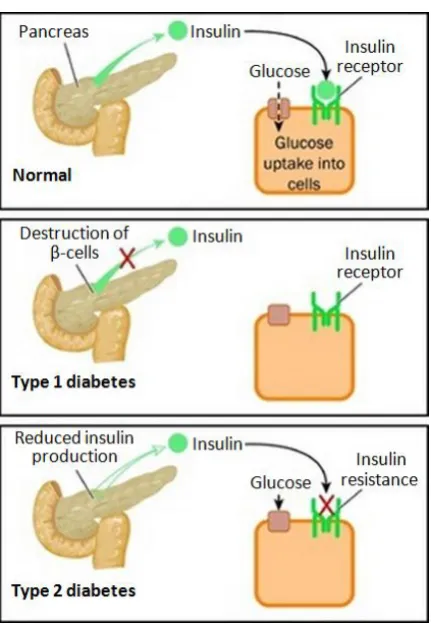
Figure 1.3: Illustration of the pathophysiological differences between normal, type 1 and type 2 diabetes. Adapted from endocrineweb.com/endocrinology/overview-pancreas. ... 8
Figure 1.4: A generalisation of the inter-relationships between insulin production, insulin sensitivity and glucose concentration during the pathogenesis of type 2 diabetes (T2D). Note that NGT and IGT are normal glucose tolerance and impaired glucose tolerance, respectively. Adapted from (Docherty 2011). ... 9
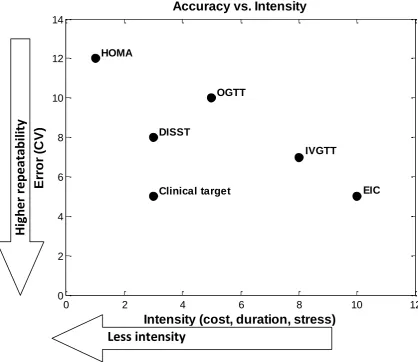
Figure 2.1: Comparison of different SI tests based on the test’s intensity and accuracy in terms of repeatability (CV in %). The clinical target area is added for a better clinical test. Adapted from (Jamaludin 2013; Lotz 2007). ... 20
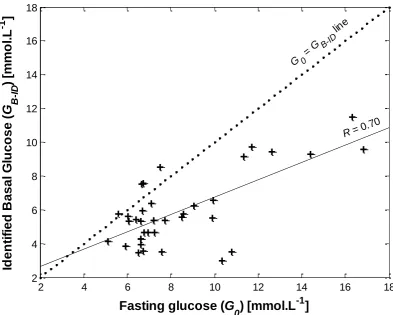
Figure 4.1: Relationship between G0 and GB-ID across tests. The 1:1 G0 = GB-ID line (dots) is to
show the bias between approaches. The solid line has R=0.70. ... 40
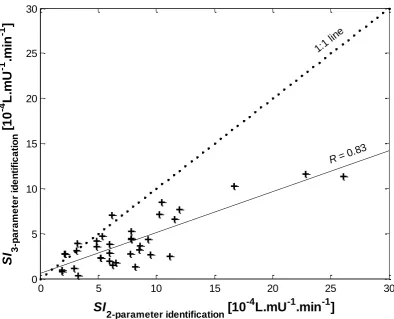
Figure 4.2: Relationships between SI values of 2- and 3- parameter identification approach across tests. The 1:1 line (dots) is to show the bias between approaches. The solid line has R=0.83. ... 41
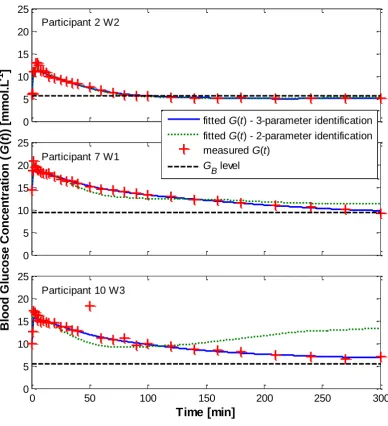
Figure 4.3: Blood glucose participant-specific profile (G(t)) for participants 2, 7, 10 with 2- and 3- parameter identification approach. ... 42
Figure 4.4: Residual error (mean and standard error, 𝑆𝐸 = 𝑆𝐷𝑁) between the measured glucose data and the response model by Equation 2 for all 36 tests. The residuals reflect model accuracy after bolus dosing and mixing errors are passed. ... 43
Figure 5.1: Relationship between G0 and identified GB across all participants and weeks. .... 52
Figure 5.2: Relationships between SI values identified from the typical 2-parameter (x = [SI, VG]) and 3-parameter (x = [GB, SI, VG]) DISST model across all participants and weeks.
... 53
Figure 5.3: Distribution of fasting and identified basal glucose concentration and identified insulin sensitivity between the 2-parameter (x = [SI, VG]) and 3-parameter (x = [GB, SI, VG]) DISST model. ... 54
ix
Figure 5.5: Bland Altman plot of insulin sensitivity values from 2- and 3- parameter
identification approaches of DISST model. ... 56
Figure 6.1: Physiologic anatomy of an islet of Langerhans in the pancreas. Adapted from (Guyton & Hall 2006). ... 65
Figure 6.2: Schematic representation of human proinsulin. (Figure taken from cebix.com/index.php/science/c-peptide-biology). ... 66
Figure 6.3: The physiological model of DISST. Adapted from (Docherty et al. 2009). ... 67
Figure 6.4: Measured C-peptide concentration and UN profile identified by DISST model. ... 69
Figure 6.5: Measured glucose concentration and UN profile identified from the PD UN model. ... 71
Figure 7.1: Simulated (solid blue line) and measured (red ‘+’ symbol) of; (A) plasma insulin, (B) glucose, (C) C-peptide for a typical participant response to the DISST model, and (D) Endogenous insulin secretion profile identified from the PD modelled UN model (solid blue line) and from deconvoluted C-peptide measurement (dashed green). ... 80
Figure 7.2: Residual error (mean and standard error, 𝑆𝐸 = 𝑆𝐷𝑁) between the measured C-peptide data and the response modelled by PD UN model. ... 81
Figure 7.3: Ratio of 𝜙𝐷𝜙𝑃 as a function of SI, with line defined for R = 0.33. ... 82
Figure 7.4: Distribution of 𝜙D against 𝜙P for all tests. ... 82
Figure 8.1: Illustration of insulin secretion from pancreatic β-cell. UB is defined as basal insulin, U1 is first phase and U2 is the second phase of insulin secretion. ... 89
Figure 8.2: Distribution of 𝜙𝐷/𝜙𝑃 against G0 where X = 19.11 min and Y = 2.79 min. Insert picture is the insulin resistance (as measured by glucose disposal) and first phase insulin secretion plot versus 2 hour glucose levels in NGT, IGT and T2D (adapted from (Ferrannini 1997)). ... 92
Figure 8.3: Distribution of 𝜙𝐷over 𝜙𝑃 during the intervention study. The 𝜙𝐷/𝜙𝑃 = 5, 10, and 100 dotted lines are shown for context. ... 93
Figure 8.4: Relationship between plasma glucose concentration and UN profile from 3 different participant response to the DISST and PD UN model. ... 95
Figure 8.5: Distribution of the ratio of 𝜙𝐷/𝜙𝑃against BMI value for all 204 tests. ... 96
Figure 8.6: Distribution of each derivative and proportional gain versus BMI value. ... 96
x
List of Tables
Table 3.1: Nomenclatures of DISST model ... 27
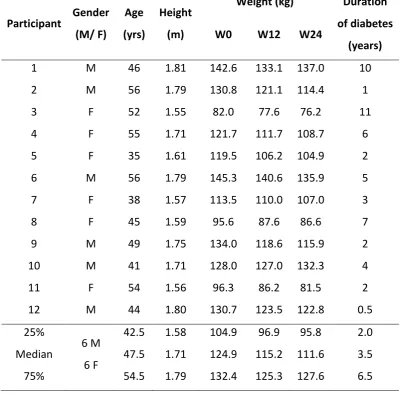
Table 4.1: Participant characteristics at baseline (W0) week 12 (W12) and the end of the trial at week 24 (W24) as well as their duration of diabetes. ... 34
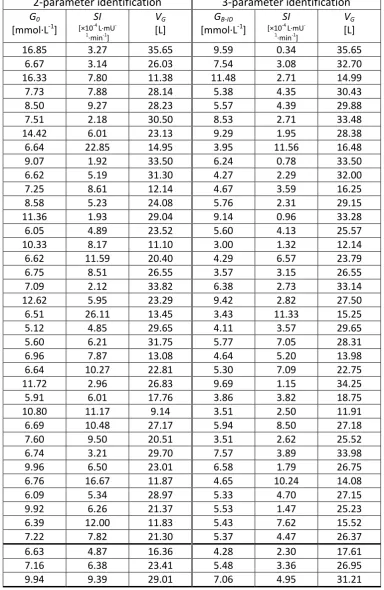
Table 4.2: Tabulated data of G0, GB-ID, SI and VG identified from two modelling approaches
across 36 tests. ... 39
Table 5.1: Tabulated data of initial G0, GB, SI identified from two modelling approaches
across all participants. ... 51
Table 6.1: A-priori identification of C-peptide kinetics parameters. ... 68
xi
Nomenclature
Acronyms and abbreviation
Physiological conditions
T1D Type 1 Diabetes
T2D Type 2 Diabetes
NGT Normal Glucose Tolerance
IFG Impaired Fasting Glucose
IGT Impaired Glucose Tolerance
IR Insulin Resistance
Insulin sensitivity tests
EIC Euglycemic Hyperinsulinaemic Clamp
IVGTT Intravenous Glucose Tolerance Test
IM-IVGT Insulin Modified IVGTT
OGTT Oral Glucose Tolerance Test
HOMA Homeostasis Model Assessment
DISST Dynamic Insulin Sensitivity and Secretion Test
DISTq Quick Dynamic Insulin Sensitivity test
Institutions
ADA American Diabetes Association
IDF International Diabetes Federation
WHO World Health Organization
Model parameters
𝐶 Plasma C-peptide concentration 𝑌 Interstitial C-peptide concentration
xii
𝐺 Basal plasma glucose concentration 𝐺0 Fasting plasma glucose concentration 𝐺𝐵 Basal plasma glucose concentration 𝑉𝑄 Interstitial insulin distribution volume
𝑛𝐼 Plasma-interstitial diffusion rate 𝑛𝐶 Interstitial insulin degradation rate
𝑃𝑡 Exogenous glucose input rate
𝑝𝑔𝑢 Non-insulin mediated glucose disposal rate 𝑉𝐺 Glucose distribution volume
𝑆𝐼 Insulin sensitivity
𝑈𝑁 Endogenous insulin secretion 𝑈𝐵 Basal insulin secretion
xiii
Abstract
Type 2 diabetes (T2D) is a chronic disease characterised by a range of dysfunctions in
glycaemic regulation. These dysfunctions are known to include insulin resistance (IR),
hyper-insulin secretion, hypo-hyper-insulin secretion and altered hepatic glucose balance, all in the
course of developing the disease. IR, in particular, is a condition in which the circulating
insulin is less effective in lowering the glucose levels in blood. Insulin hypersecretion is most
associated with pre-diabetes, but can sometimes occur in early diabetes in concert with
sufficient IR. Insulin hyposecretion, on the other hand, is most often present in longer-term
diabetes and is a result of reduction in β-cell mass. Hence, the ability to accurately monitor
and diagnose these stages of progression would offer unique insight and clinical
opportunity.
As an individual progresses towards T2D, the amount of insulin required to deal with the
glucose loads increases. This outcome is ultimately driven by low insulin sensitivity (SI = IR-1). Additionally, T2D is said to have a lower insulin secretion capability, and thus, resulted in
consistently increase glucose levels in the blood. Thus, more specifically, precisely observing
and understanding the metabolic disorder as changes in both SI and endogenous insulin
secretion (UN) may provide further insight into the heterogeneous etiology of type 2
diabetes, and clinical intervention opportunities.
Although, several test protocols and mathematical modelling strategies have been
xiv
thesis is to find how to effectively improve the precision and clinical utility of these
model-based assessments when assessing the SI and UN. This thesis focuses on minimising the
identification error or accurately identify the SI value particularly for individual with
established T2D. In addition, this thesis also develops and analyses a proportional-derivative
(PD) control model that may potentially be able to replace the conventional and accepted
methods for estimating the participant-specific UN profile, which are not precise and thus
introduce error.
In particular, many modelling strategies use fasting glucose (G0) as basal glucose
concentration (GB) when assessing the insulin sensitivity. With the assumption of GB = G0,
most of the model-based SI assessment able to produce a highly correlated of an SI value to
gold standard euglycaemic hyperinsulinaemic clamp (EIC). However, some of the
model-based like dynamic insulin sensitivity and secretion test (DISST), was developed in a
relatively healthy, normoglycaemic cohort. Thus, the assumption of GB = G0 might be untrue
as prior studies have suggested that GB and G0 should be treated differently particularly for
T2D individuals. Hence, the outcomes of identifying GB potentially provide accurate
assessment of SI value, in particular, for pre-diabetes individual, are investigated and
quantified for the first time.
It is understandable that UN plays a leading role in glucose homeostasis. Pathological
changes in UN can enable early diagnosis of metabolic dysfunction before the emergence of
type 2 diabetes. A PD control model that defines UN as a function of glucose concentration is
xv
prediabetic state. In addition, it offers the ability to add precision to estimating SI and
additional diagnostics around UN.
Thus, finally, the proposed PD UN model is further analysed to provide more information in
determining each participant’s glycemic condition. The characterised gains of derivative
control, 𝜙𝐷 and proportional control, 𝜙𝑃 are used in identifying and discriminating the UN
profile for each metabolic state. Hence, the outcome will potentially improve the overall
1
Chapter 1. Introduction
Diabetes has gone from rarity to global epidemic. Global estimations of diabetes prevalence
by King et. al. estimate that there will be a total of 300 million adults with diabetes in 2025
(King et al. 1998). The World Health Organization (WHO) estimates an increase of more than
110%, from 171 million in 2000 to 366 million in 2030, of diabetes case worldwide (Wild et
al. 2004). The International Diabetes Federation (IDF) estimates that the total number of
people living with diabetes will rise about 55% from 382 million in 2013 to 592 million in
2035 (IDF 2013). While these estimates vary wildly, they share common themes of
exponential growth and large number of people with diabetes.
Diabetes continues to increase in prevalence and significance due to developments in
economics and urbanization that lead to sedentary lifestyles changes leading to reduced
physical activity and increasing obesity (Whiting et al. 2011). Diabetes is characterised by
high levels of insulin resistance and insulin secretory dysfunction that affect glucose uptake
and utilization by most cells of the human body. Thus, a combination of resistance to insulin
action and an increasingly inadequate compensatory insulin secretory response results in
changing the metabolic state of an individual a healthy state, through pre-diabetes and early
onset type 2 diabetes to manifest diabetes (Ferrannini 1997; WHO 2006). In particular, an
absolute deficiency of insulin secretion occurs in manifest diabetes (ADA 2014). Hence,
understanding the underlying metabolic disorder in the pathogenesis of diabetes could
provide valuable information to instigate therapies to mitigate or delay the onset of the
2
This chapter reviews and discusses the physiological characteristics of glucose and insulin
that are associated with insulin resistance and the pathogenesis of type 2 diabetes.
1.1
Glucose
Glucose is a simple sugar or monosaccharide that consists of three elements: carbon,
hydrogen and oxygen. Glucose is the most important carbohydrate and is used by the body
as the main source of energy. During the conversion of glucose to pyruvate via glycolisis,
energy is released for use in the cells (Guyton & Hall 2006). Hence, adequate glucose is
essential in providing energy to maintain cellular function and thus, the body.
Figure 1.1 illustrates the level of glucose in the blood stream in a simulated healthy
individual. Immediately after a meal, the digestive system breaks down the carbohydrate in
food into glucose. The glucose produced is absorbed into the blood stream and results in
sharp increase in blood glucose level. A healthy individual has a blood glucose level of 72 -
90 mg·dL-1 (4 - 5 mmol·L-1) before a meal. However, the blood glucose level of most healthy individuals will increase above 140 mg·dL-1 (7.78 mmol·L-1) after a meal containing large amounts of carbohydrates (Guyton & Hall 2006). In response to the increased blood glucose
level, pancreatic β-cells secrete a significant amount of insulin to lower the blood glucose
level back to a safe level.
Glucose is transported around the body passively via the blood stream. Insulin is required to
3
muscles and adipose tissue. Glucose can also be directly taken up by cells itself in the brain
[image:18.595.85.512.159.273.2]and central nervous system without the need of insulin.
Figure 1.1: Schematic illustration of the effect of blood glucose level after meal.
Although, glucose is used by the cells to produce energy, excess glucose can be stored in the
liver and muscles, primarily as glycogen, for future use. However, the body’s ability to store
glycogen is limited. Hence, further excess glucose is then stored in adipose tissue as fat.
Naturally, the body constantly regulates the blood glucose level as a part of metabolic
homeostasis. A healthy fasting blood glucose level is in the range of 4 – 5 mmol·L-1. However, if this glucose balancing system is disrupted, it can lead to hyperglycemia, where
the blood glucose level is elevated above safe levels (≥ 200 mg·dL-1, 11.1 mmol·L-1) (ADA 2014; WHO 2006). If left untreated, hyperglycemia can lead to the emergence of T2D and
significant complications (Duckworth 2001; Laakso 1999a,b). On the other hand, if blood
glucose levels fall too low, into the range of 20 – 50 mg·dL-1 (1.11 – 2.78 mmol·L-1), hypoglycaemia occurs (Guyton & Hall 2006), which carries its own significant risk (Cryer
1997; Cryer & Polonsky 2008; McCrimmon & Frier 1994; Wilson 1983)and thus adds risk to
4
An individual is defined as having impaired fasting glucose (IFG) when the value of fasting
plasma glucose is in the range of 100 mg·dL-1 (5.6 mmol·L-1) to 125 mg·dL-1 (6.9 mmol·L-1), or impaired glucose tolerance (IGT) when the plasma glucose value in the range of 140 mg·dL-1 (7.8 mmol·L-1) to 199 mg·dL-1 (11 mmol·L-1) at the 2-hour mark of an oral glucose tolerance test (OGTT) (ADA 2014). These IFG and IGT individuals have been referred to as having a
pre-diabetes state, indicating a high risk of further development of diabetes (ADA 2014;
Shaw et al. 1999; Tuomilehto et al. 2001; Vendrame & Gottlieb 2004). Maintaining a
balanced glucose level in the blood is crucial for health. Failing to continually control blood
glucose levels leads to the development of metabolic disorders, particularly diabetes, all of
which have significant complications that can reduce quality and length of life.
1.2
Insulin
One of the primary hormones produced by pancreatic β-cells of the islets of Langerhans is
insulin (Guyton & Hall 2006). The insulin hormone is composed of two polypeptide chains, A
(21 amino acids) and B (30 amino acids) chains. These two amino acids are connected by
disulfide bonds (Chevenne et al. 1999).
Insulin plays the primary significant role in maintaining glucose homeostasis. The β-cells,
representing 60% of all the cells of the islets of Langerhans, secrete insulin in response to
elevated glucose levels in the blood stream. These insulin secretions enable glucose to be
absorbed by muscle and adipose tissue cells, regulate storage and release of glucose in the
liver, and promote fat synthesis and storage (Guyton & Hall 2006; Jefferson et al. 2001).
5
Figure 1.2 illustrates the important role played by insulin in glucose uptake. Once released
into the blood stream, insulin is then distributed to interstitial fluid. There, it binds to its
receptor of muscle and adipose tissue cell outer membranes. This action, in turn, activates
an intercellular reaction that include translocation of glucose transporter proteins from
intracellular vesicles to the plasma membrane (Holman & Kasuga 1997; Myers & White
[image:20.595.115.488.279.490.2]1996), which then results in influx of glucose (Jefferson et al. 2001).
Figure 1.2: Effect of insulin on glucose uptake and metabolism. Adapted from
http://biology-pictures.blogspot.co.nz/.
Once, glucose enters the cell, it undergoes energy-releasing glycolysis process that. In the
case of energy abundance, insulin also plays a critical role in storing the excess energy
mainly in the liver and muscles by converting the glucose into glycogen through
glycogenesis. Moreover, it also promotes the synthesis of fatty acids through lipogenesis,
6
Initially, the β-cells secrete insulin into the portal vein and it travels through the liver to the
heart before entering the blood circulation. From 60 – 80% of endogenous insulin secretion
is extracted during this first pass extraction by the liver after being released (Cobelli & Pacini
1988; Ferrannini & Cobelli 1987; Meier et al. 2005; Toffolo et al. 2006). Later, insulin is also
cleared by the kidneys, as well as through cellular degradation after mediating glucose
uptake (Guyton & Hall 2006; Jefferson et al. 2001). Hence, there are multiple clearance
paths.
In general, the secretion of insulin by the pancreatic β-cells is bi-phasic in healthy individuals
(Guyton & Hall 2006; Jefferson et al. 2001). The strong spike of first phase secretion is
released from stored and pre-produced insulin immediately after a sudden increase in
glucose level within a short period of time. Later, a prolonged second phase secretion is
more slowly and gradually released to eventually bring glucose levels back to normal.
Importantly, the healthy pancreas secretes the right amount of insulin in response to the
appearance of glucose in the blood stream. Failure to produce enough insulin to clear the
excess glucose leads to elevated glucose levels in the blood and ultimately to prolonged
hyperglycemia and T2D.
1.3
Pathogenesis of Type 2 diabetes mellitus (T2DM)
Diabetes mellitus is a chronic disease characterized by prolonged or uninterrupted elevated
blood glucose levels (hyperglycemia) resulting from defects in insulin secretion, insulin
action, or both (ADA 2014). Naturally, glucose homeostasis is achieved when the level of
7
Regulation is accomplished via glucose uptake by the cells via insulin mediated uptake.
However, as the body’s ability to regulate glucose levels in blood deteriorates, the glucose
stays in the blood stream until it is cleared, more slowly, through renal clearance of the
kidneys (Arleth et al. 2000). This abnormal condition occurs in established diabetes and
results in prolonged elevated blood glucose concentrations.
There are two major types of diabetes, Type 1 and Type 2 (Guyton & Hall 2006). Figure 1.3
illustrates the etiopathogenesis of these two types. In general, Type 1 diabetes (T1D) results
from the body’s failure or inability to produce insulin. The etiology of T1D is characterised by
the destruction of the pancreatic β-cells caused by an auto-immune disorder or as a result
of the action of genetic markers (ADA 2014; Bluestone et al. 2010). Individuals with T1D
need to have exogenous insulin to maintain a safe level of glucose in the blood stream.
T2D results from the body’s inability to produce enough insulin. Prior studies and definitions
have characterized T2D by fasting hyperglycemia and an excessive rise in the plasma glucose
concentration above baseline following glucose or meal ingestion (DeFronzo et al. 1983)
resulting from impaired insulin utilization (insulin resistance) coupled with the body’s
inability to compensate with insulin production (insulin deficiency). Hence, there is a
fundamental difference in the two forms of diabetes.
Theoretically, it can be said that type 2 diabetes is related to the development of IR and
impaired β-cells. Over time, T2D is developed due to consistent and excessive insulin
resistance leading to increase requirements for insulin production that, if not halted,
8
eventually results in a total loss of insulin secretion. Hence, the glucose level in the blood
[image:23.595.191.407.154.467.2]increases, increasingly without restraint.
Figure 1.3: Illustration of the pathophysiological differences between normal, type 1 and type 2 diabetes. Adapted from endocrineweb.com/endocrinology/overview-pancreas.
As a result, it is generally agreed that insulin resistance is the predominant driver of the
pathogenesis of T2D (Docherty 2011). A study has reported that up to 10 years ahead of a
formal diagnosis of type 2 diabetes, those who developed the disease had 60% higher mean
IR than those that did not (Martin et al. 1992). It is also found that amongst obese
individuals, IR is the strongest predictor of subsequent type 2 diabetes and cardiovascular
disease risk (McLaughlin et al. 2007). Figure 1.5 shows a clear relationship between insulin
production, insulin sensitivity and glucose concentration in blood stream. The nature of
9
declining, as illustrated in Figure 1.4. This behaviour is known as Starlings curve of the
pancreas (Clark et al. 2001; Gastaldelli et al. 2004). A similar curve was also presented in
Ferrannini et. al. (Ferrannini 1997).
Figure 1.4: A generalisation of the inter-relationships between insulin production, insulin sensitivity and glucose concentration during the pathogenesis of type 2 diabetes (T2D). Note
that NGT and IGT are normal glucose tolerance and impaired glucose tolerance, respectively. Adapted from (Docherty 2011).
As an individual moves from normal glucose tolerance (NGT) to IGT, the glucose
concentration often remains the same. However, the SI value decreases as IR increases, as
defined. This decrease results in higher demands on insulin production to stabilize blood
glucose levels. As a result, this physiological change often goes unnoticed for a long time.
Thus, the disease can be well established long before diagnosis when insulin production
becomes significantly impaired and blood glucose levels rise. Hence, early identification of
insulin resistance or sensitivity, as well as insulin production, could potentially ameliorate
10
1.4
Preface
The main objective of this thesis is to better understand the identification of SI and β-cell
function through the secretion of endogenous insulin. This thesis focuses on two parts: 1)
accurately assessing SI value particularly for individuals with established T2D from the
perspective of model-based SI assessment; and 2) identifying a smoother physiologically UN
profile based on a development of PD control model. A brief overview of the thesis includes:
Chapter 1 discusses the physiological characteristics of glucose and insulin that are associate with IR and the pathogenesis of T2D.
Chapter 2 reviews current and established model-based SI assessments.
Chapter 3 introduces a 3-parameter modelling approach for SI assessment. The approach is compared to a previous 2-parameter identification for individuals with established T2D.
Chapter 4 validates the importance of introducing GB as a variable in a 3-parameter
identification approach using DISST model.
Chapter 5 underlines the impact of identifying GB as a variable towards assessing the SI
11
Chapter 6 explores a different modelling approach of identifying the UN profile through the
development of PD UN model as opposed to the typical approach of deconvolution of
C-peptide measurements.
Chapter 7 presents a PD model that defines UN as a function of changes in glucose
excursion.
Chapter 8 reflects how the information gathered from PD UN model can be used in
discriminating the condition state of an individual.
Chapter 9 summarises and concludes the outcomes of this thesis.
12
Chapter 2. Review of model-based insulin sensitivity
(
SI
) tests
This thesis revolves around model-based assessment of insulin sensitivity and insulin
secretion in the clinical evaluation of the etiology and diagnosis of diabetes. This chapter
provides an overview of current model-based methods for assessing insulin sensitivity (SI),
which is, as noted, an important metabolic marker of risk for type 2 diabetes.
2.1
Introduction
T2D is a metabolic disease that affects the body’s ability to regulate blood glucose
concentrations (DeFronzo & Ferrannini 1991; Ferrannini 1997; Martin et al. 1992). Studies
show that T2D is characterized by fasting and postprandial hyperglycaemia (DeFronzo et al.
1983; Firth et al. 1986; Kirkman et al. 2006; Rizza 2010) and causes complications
comorbidities with significant personal, social and economic cost (Bonow & Gheorghiade
2004; Gakidou et al. 2011; King 1999; Lam & LeRoith 2012; Santaguida et al. 2005).
Although, this hyperglycaemia is attributed to a combination of impaired insulin utilization
(insulin resistance) and a limited ability to compensate with insulin production (net insulin
deficiency), many investigations found that SI (SI = IR-1) is a key causative and diagnostic factor in T2D (DeFronzo & Ferrannini 1991; Ferrannini 1997; Harris et al. 2003; Martin et al.
1992) and is also associated as a major risk factor for cardiovascular disease (Hanley et al.
13
test that able to accurately identify SI would be clinically advantageous as a diagnostic and
to better understand the physiological changes in T2D.
Many already developed tests measure SI as the efficiency in the use of insulin to reduce
blood glucose (Ferrannini & Mari 1998; Pacini & Mari 2003). Each test employs a different
clinical method, and thus results in a different level of accuracy or resolution. Hence, the
researcher or clinician has to choose the best test in terms of intensity, cost, accuracy and
physiological relevance. Therefore, a high resolution, simple, repeatable clinical measure of
insulin sensitivity would have clinical and research benefits for diagnosis, research, and
evaluating the impact of interventions (ADA 1998).
The aim of this chapter is to provide an overview on the most frequently used insulin
sensitivity tests and, in particular, model-based SI assessments. However, the vast majority
of these tests and models have been extensively reviewed and discusses by Lotz (Lotz
2007), Docherty (Docherty 2011) and Jamaludin (Jamaludin 2013). Hence, the focus here, in
this chapter, is to give a summary of these tests in terms of diagnostic accuracy, as well as
clinical burden and intensity of assessing the insulin sensitivity and secretion.
2.2
Overview of insulin sensitivity test
2.2.1 Euglycaemic hyperinsulinaemic clamp (EIC)
The EIC is regarded as the gold-standard for investigating and quantifying insulin resistance
or insulin sensitivity (Ferrannini & Mari 1998; Pacini & Mari 2003). It measures the amount
14
introduced in 1979 (Defronzo et al. 1979), this test infuses insulin at a constant rate and
glucose at a variable rate to “clamp” the plasma glucose concentration at a normal fasting
concentration, typically around 4.6 – 5.0 mmol·L-1 (McAuley et al. 2001).
The EIC defines an insulin sensitivity index (ISI) as the mean glucose infusion rate is divided
by the mean insulin concentration. Both variables are measured at a steady state level at
the end of the test. It has good repeatability (Defronzo et al. 1979; Mari et al. 2001;
Monzillo & Hamdy 2003). However, it is very difficult to perform, time consuming, and
increasingly avoided even by clinical researchers (Ferrannini & Mari 1998; Radziuk 2000). In
addition, the test needs a total of 180 to 300 minutes to complete, with consistent
attendance by highly trained medical personnel, making it too intensive for subjects and
clinicians.
Although the EIC test is the gold standard reference for insulin sensitivity value, it does not
provide an evaluation of a participant’s insulin production at the same time. A second EIC
test using a sustained physiological glucose concentration, instead of
hyper-insulinaemia, is performed to estimate the insulin production. Thus, insulin production and
sensitivity cannot be identified concurrently with the EIC test, and neither is accurately
estimated at the physiological levels or actions.
2.2.2 Intravenous glucose tolerance test (IVGTT)
The IVGTT is the most well-used and common dynamic insulin sensitivity test protocol. This
15
series of blood samples are taken, and 20 or more samples are then assayed for glucose and
insulin concentration, and, sometimes, connecting peptide (C-peptide) concentration, as
well. Since the SI value cannot be identified directly from the data, a non-linear least-square
parameter identification approach, typically using the minimal-model (MM) of
glucose-insulin dynamics is used to analyse the data (Bergman et al. 1985; Bergman et al. 1979b;
Bergman et al. 1981; Boston et al. 2003; Caumo et al. 1999).
The minimal model identifies two metabolic parameters, insulin sensitivity (SIMM) and
glucose effectiveness (SGMM). SIMM defines the sensitivity of insulin to mediate glucose
uptake and inhibit liver glucose production (Bergman 1989; Bergman et al. 1985). SGMM, on
the other hand, quantifies the ability of glucose to decay from plasma at constant basal
insulin (Ader et al. 1985; Best et al. 1996). In addition, the minimal model has been used
with other models to identify metrics of first and second phase insulin secretion (Toffolo et
al. 1980).
The insulin sensitivity metrics from the IVGTT have been well-validated against the EIC
(Beard et al. 1986; Bergman et al. 1987; Saad et al. 1994). However, some studies have
shown significant difference to the EIC with R = 0.44 – 0.85 (Donner et al. 1985; Foley et al.
1985; Galvin et al. 1992). Furthermore, the IVGTT is also known to produce ambiguous
insulin sensitivity values and erratic correlations with the EIC (Bonora et al. 1989; Ferrannini
& Mari 1998). Although, the IVGTT and minimal model are less clinically intense than the
EIC, it remains a research-only application as the test is still impractical for use in wider
clinical setting due to its length, intensity and complexity of parameter identification
16
2.2.3 Oral glucose tolerance test (OGTT)
The OGTT is a simple test that involves oral consumption of a drink containing a pre-defined
glucose content. A standard dose of glucose, often 75g glucose in 250 mL of flavoured
water, is ingested by mouth and blood glucose levels are checked one and/ or two hours
later. The OGTT is used to diagnose patients of pre-diabetes, type 1 or type 2 diabetes (ADA
2014). The two most common protocols are the 75g 2-hour trial and the 50g 1-hour trial.
The OGTT by itself, does not calculate insulin sensitivity directly and insulin production
characteristics are not frequently measured or estimated. Its simplicity and accurate
portrayal of the ability to dispose of glucose have made it the most common clinical
diagnostic of diabetes (ADA 2014). In particular, the OGTT only measures the body’s ability
to remove a glucose load throughout the 1 or 2-hour trial, but provides no measure of
secretion. Instead, it yields the net combination of SI and secretion seen as glucose removal.
A series of mathematical equations have been suggested to be applied, together with the
OGTT, to assess the insulin sensitivity (Cederholm & Wibell 1990; Gutt et al. 2000; Matsuda
& DeFronzo 1999; Piche et al. 2007; Stumvoll et al. 2000). The OGTT is rarely used to assess
SI in clinical investigation. It is instead very well used as an accepted method for the
17
2.2.4 Homeostasis model assessment (HOMA)
HOMA identifies insulin sensitivity and an index of β-cell function based on measured
plasma glucose and insulin in a fasting state using a very simple physiological glucose-insulin
model (Levy et al. 1998; Matthews et al. 1985; Turner et al. 1979). HOMA has been
validated against the EIC. As this method solely depends on the precision of the fasting
glucose and insulin measurements, a small error may affect the overall calculation of both
indices of SI and β-cell function (Pacini & Mari 2003). Hence, the correlation between the
EIC and HOMA varies between R = 0.22 and R = 0.93 (Bonora et al. 2000; Lorenzo et al.
2010; Mari et al. 2001; Mather et al. 2001; Matthews et al. 1985; Pacini & Mari 2003; Piche
et al. 2007), with most having on the poor side.
2.2.5 Dynamic insulin sensitivity and secretion test (DISST)
The DISST was designed to obviate the limitations of other tests. It provides quantitative
measures of insulin sensitivity and insulin secretion. It is a dynamic test with a physiological
model-based assessment, similar to the insulin modified IVGTT (IM-IVGTT). The DISST was
developed to be an accurate IVGTT alternative that enables a shorter test duration, more
physiological dosing, less frequent sampling, and higher robustness, all with a lower total
cost of clinical testing (Lotz 2007; Lotz et al. 2010; Lotz et al. 2008).
The DISST uses a low dose of intravenous glucose bolus of 5 – 20 g and is followed by a low
dose of intravenous insulin bolus of 0.5 – 2 U. Blood samples are measured and assayed for
18
and also UN through a developed pharmaco-kinetic and pharmaco-dynamic model that
represent the pathways and interactions between insulin, C-peptide and glucose in the
human body.
The DISST produces a highly correlated metric of insulin sensitivity to the EIC test through
in-silico study (R = 0.99) (Lotz et al. 2008). In-vivo studies also yielded a high correlation (R =
0.82) (McAuley et al. 2011). In addition, the DISST was able to identify participant-specific
UN profiles through deconvolution of measured C-peptide. As C-peptide is equimolarly
secreted together with insulin from pancreatic β-cells (Rubenstein et al. 1969), the
deconvolution method is considered to be effective in indentifying UN profiles (Van Cauter
et al. 1992). Thus, the DISST is a unique test that can quantify both insulin sensitivity and
secretion at the same time with low cost but high robustness.
The DISST was further developed by Docherty (Docherty 2011), who eliminated the need for
insulin and C-peptide assays via an iterative parameter identification method. The quick
dynamic sensitivity test (DISTq) reduces the clinical intensity and assay cost of the DISST and
correlated well to the fully sampled DISST in an in-silico Monte-Carlo analysis with R=0.89
(Docherty et al. 2009). With the low cost and high accuracy of the DISTq, it would be able to
screen more patients for type 2 diabetes risk (Docherty et al. 2011b).
2.3
Summary
Figure 2.1 shows the relationship between accuracy and intensity of different SI tests. The
19
concurrently identify both insulin production and insulin sensitivity, both of which are
required for accurate diagnosis and understanding of the etiology of diabetes. A second
clamp protocol is needed to assess UN. Hence, it is only limited to research setting, as it is
too complex, intense and costly for wider clinical application.
The IVGTT with a minimal model analysis is suggested as a valid alternative to the EIC and is
widely used by researchers. However, the IVGTT test has not achieved wide acceptance in a
clinical application given that they are also very complex and time consuming. Additionally,
relying on the minimal model in analysing and assessing SI, often leads to issues, particularly
in over-parameterisation that causes the inability to distinguish between insulin and
non-insulin mediated glucose disposal (Docherty et al. 2011a; McDonald et al. 2000; Pillonetto et
al. 2002). Hence, the test is known to produce inconsistent SI values and unpredictable
correlation to the EIC particularly for individual with higher insulin resistance (Docherty et
al. 2011a; Pillonetto et al. 2003; Quon et al. 1994).
The OGTT and HOMA are cheaper and simpler compared to the IVGTT and EIC (Figure 2.1).
A mathematical model is needed to analyse data obtained from the OGTT to identify an SI
value. However, the OGTT is not often used in applications that require accurate assessment
of SI. However, the OGTT is widely accepted and used as a method to diagnose type 2
20
Figure 2.1: Comparison of different SI tests based on the test’s intensity and accuracy in terms of repeatability (CV in %). The clinical target area is added for a better clinical test.
Adapted from (Jamaludin 2013; Lotz 2007).
HOMA, on the other hand, identifies SI values based on fasting glucose and insulin values.
However, with only one sample required of both glucose and insulin concentration, it does
not fully represent the insulin-glucose dynamics. Thus, HOMA is used only in research that
requires a simple, SI surrogate.
The DISST is a dynamic model-based test, similar to the IM-IVGTT. The DISST was developed
to capture high resolution estimates of SI and also the UN profile. With high correlation to
the gold standard EIC with R = 0.82 in in-vivo, the DISST insulin sensitivity is a more
representative measure than other insulin sensitivity metrics due to its physiological model
0 2 4 6 8 10 12
0 2 4 6 8 10 12 14 E rr o r (C V )
Intensity (cost, duration, stress) Accuracy vs. Intensity
21
of pharmaco-kinetic and pharmaco-dynamic of glucose, insulin and C-peptide
measurements. It also delivers a well-accepted UN secretion profile that others do not.
Although the DISST seems to be the best protocol for assessing SI and UN based on higher
repeatability and lower intensity (Figure 2.1), there remains a scope better at diagnosis by
improving the DISST model. The DISST, like any other model-based SI assessment, uses the
assumption that basal glucose level is equal to the fasting glucose level when assessing
insulin sensitivity. However, this assumption is untested and may be untrue for individuals
with established T2D. Originally, the DISST identifies SI together with a glucose distribution
volume (VG) in a 2 parameter approach employing the iterative integral method (IIM).
However, if basal glucose is considered as a variable, a 3 parameter approach is needed,
where basal glucose is identified together with the SI and VG value. Hence, SI can be
potentially assessed with better accuracy in this case, particularly for T2D individuals.
In addition, the DISST identifies the participant-specific UN profile based on deconvolution of
C-peptide measurement. Although it remains to be the best method in identifying
endogenous insulin, due to the fact that C-peptide and insulin are co-secreted from β-cells,
these C-peptide measurements are relatively sparse. Hence, while diagnostically effective,
there is room for improvement and to reduce sampling and thus cost, which is the focus of
22
Chapter 3. 3-parameter identification of model-based
insulin sensitivity assessment
This chapter discusses an adaptation to enable identification of 3 parameters, comprising
GB, SI and VG, when assessing SI value for individuals particularly with established T2D.
3.1
Introduction
The pathogenesis of T2D is well known, and is characterized by IR and β-cell dysfunction
(Kahn 2003). β-cell dysfunction is associated with reduced and inconsistent endogenous
insulin production, while IR as a condition refers to a state in which the body becomes less
effective or unable to use secreted endogenous insulin for lowering blood glucose. An
individual can have IR with, or without, β-cell dysfunction and reduced insulin secretion.
These conditions contribute to major metabolic disorders, such as glucose intolerance or
hyperglycemia, and, if left untreated, ultimately lead to the emergence of T2D.
In particular, IR is a strong early predictor of subsequent T2D, up to 10 years in advance
(DeFronzo & Ferrannini 1991; Ferrannini 1997; Harris et al. 2003; Martin et al. 1992). It is
also associated with increased cardiovascular disease risk (Hanley et al. 2005; McLaughlin et
al. 2007; Zimmet et al. 1999) as part of an overall syndrome of conditions that can emerge.
Early identification of IR would thus benefit diagnosis and offer the opportunity to reduce
23
The ability to quantify SI and UN is essential to improving the understanding of the complex
physiology underlying type 2 diabetes. The first is associated with IR, while the second is
associated with the ability to endogenously secrete insulin to reduce glucose level. Thus, it is
necessary to assess both to enable complete diagnosis.
Throughout the years, many experimental tests have been designed to quantitatively assess
SI and UN (Bergman et al. 1985; Hovorka & Jones 1994). Mathematical models of glycaemic
dynamics, in particular, have been coupled with clinical data to identify these 2 key aspects
in the pathogenesis of type 2 diabetes. However, none have yet been accepted as a clinical
standard, and are primarily used as research tools.
SI is defined as the ability of insulin (exogenous or endogenous) to lower blood glucose
concentration by stimulating glucose uptake and suppressing its glucose production (Pacini
& Mari 2003). The EIC is regarded as the gold standard method for identifying SI (Ferrannini
& Mari 1998; Pacini & Mari 2003), due to its good accuracy and high repeatability (Defronzo
et al. 1979; Monzillo & Hamdy 2003). The EIC measures SI through the amount of glucose
necessary to compensate for a hyper-physiologically increased insulin level while
maintaining a normal, fasting glucose concentration of about 5 mmol·L-1 (Pacini & Mari 2003).
However, the EIC is increasingly avoided by clinical researches due to its experimental
complexity, the need for clinical expertise in administering the test, and its time consuming
design (Ferrannini & Mari 1998; Radziuk 2000). Thus, the IVGTT with minimal model
24
(Pacini & Bergman 1986). However, the IVGTT is known to produce ambiguous insulin
sensitivity values and erratic correlations with the EIC (Bonora et al. 1989; Ferrannini & Mari
1998). This difficulty is particularly true for those with low SI (higher IR) (Pillonetto et al.
2002; Quon et al. 1994), which is, paradoxically, the target population requiring the most
accuracy in an SI test. It is also costly and clinically intensive due to the frequent, typically
1-3 min, sampling.
The DISST is a low intensity test that incorporates a clinical protocol similar to the IM-IVGTT
(Bergman et al. 1979b; Ward et al. 2001). The DISST data modelling and data fitting
methods were customized to the clinical protocol to allow a robust measurement of SI that
avoids the problems encountered with FS-IVGTT assessment in insulin resistant patients
(Caumo et al. 1999; Cobelli et al. 1986; Docherty et al. ; Krudys et al. 2006). The DISST also
compares very favourably with EIC in assessing SI with strong correlation of R = 0.82, and
produced highly repeatable SI and UN metrics (Lotz 2007; Lotz et al. 2010; Lotz et al. 2008;
McAuley et al. 2011). In addition, it provides UN and SI resolution where the
supra-physiological EIC does not (Lotz 2007; McAuley et al. 2011).
The pharmacokinetics and pharmacodynamics of the DISST model relates the rate of
glucose decay to the concentration of insulin available in the interstitium to provide a metric
of SI (Lotz 2007; Lotz et al. 2010). Like all other model-based assessments of SI (Bergman et
al. 1979b; Bergman et al. 1981; Bergman et al. 1987; Boston et al. 2003; Caumo et al. 1999),
the DISST model-based approach uses the participant’s measured G0 as their modelled GB so
that G0 = GB. Hence, SI is identified together with VG in a 2-parameter identification
25
Although, the DISST model, with the assumption of G0 = GB, produces an SI value that is
highly correlated to the EIC value. However, the model was developed in a relatively
healthy, normoglycemic cohort (Lotz ; Lotz et al. 2010). Understandably, G0 is defined as a
glucose concentration taken early in the morning after an overnight fast of 8 hours or more.
While, GB, on the other hand, is defined as the stable overnight glucose concentration
(Holman & Turner 1981). Hence, the assumption of G0 = GB might be untrue for some cases,
particularly those involving low SI value. More specifically, prior studies show that G0 levels
and insulin concentrations are slightly higher in the morning than their overnight “basal”
levels, especially for participants with diabetes (Holman & Turner 1977,1978,1979,1981).
In addition, the evidence suggests that GB and G0 should be treated as separate entities for
individuals with established diabetes as the levels are determined by relative insufficiencies
in SI, UN and rates of gluconeogenesis (Cahill 1971; Cahill et al. 1959; Steele et al. 1968).
Therefore, identifying GB as a variable may provide more precise information particularly
when assessing SI value especially for individuals with T2D. Hence, a new 3-parameter
identification approach is developed in this chapter, where GB is identified in concert with SI
and VG.
3.2
DISST Model
The DISST provides quantitative measures of both SI and UN (Lotz et al. 2010; McAuley et al.
2011; McAuley et al. 2007). The DISST is similar to the insulin modified IVGTT, which
26
DISST model describes the UN secretion profile from the deconvolution of C-peptide
concentration (Van Cauter et al. 1992):
C-peptide Pharmaco-kinetic Model
𝐶̇ = −(𝑘1+ 𝑘3)𝐶 + 𝑘2𝑌 +
𝑈𝑁
𝑉𝑝 (3.1)
𝑌̇ = −𝑘2𝑌 + 𝑘1𝐶 (3.2)
The insulin kinetics are described (Lotz et al. 2010):
Insulin Pharmaco-kinetic Model
𝐼̇ = −𝑛𝑘𝐼 − 𝑛𝐿 𝐼
1 + 𝛼𝐼𝐼−
𝑛𝐼
𝑉𝑝(𝐼 − 𝑄) +
𝑈𝑒𝑥
𝑉𝑝 + (1 − 𝑥𝐿)
𝑈𝑁
𝑉𝑝 (3.3)
𝑄̇ = − (𝑛𝐶+ 𝑛𝐼
𝑉𝑄) 𝑄 +
𝑛𝐼
𝑉𝑄𝐼 (3.4)
Finally, SI is identified from a glucose insulin pharmacodynamic (PD) model (Chase et al.
2005):
Glucose-Insulin Pharmaco-dynamic Model
𝐺̇ = −𝑝𝑔𝑢(𝐺 − 𝐺𝐵) − 𝑆𝐼(𝐺𝑄 − 𝐺𝐵𝑄𝐵) +𝑃𝑡
𝑉𝐺 (3.5)
27
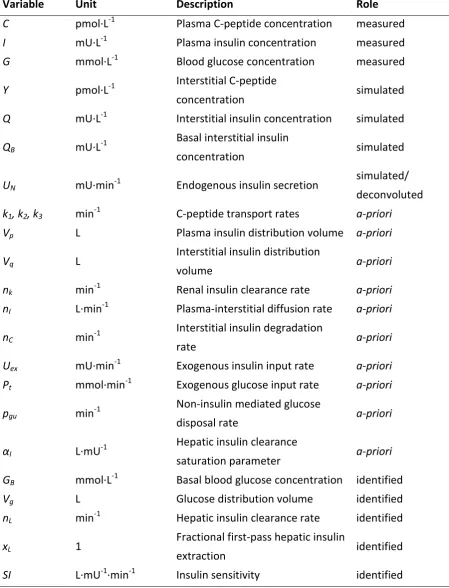
Table 3.1: Nomenclatures of DISST model
Variable Unit Description Role
C pmol·L-1 Plasma C-peptide concentration measured
I mU·L-1 Plasma insulin concentration measured
G mmol·L-1 Blood glucose concentration measured
Y pmol·L-1 Interstitial C-peptide
concentration simulated
Q mU·L-1 Interstitial insulin concentration simulated QB mU·L-1
Basal interstitial insulin
concentration simulated
UN mU·min-1 Endogenous insulin secretion
simulated/ deconvoluted k1, k2, k3 min-1 C-peptide transport rates a-priori
Vp L Plasma insulin distribution volume a-priori
Vq L
Interstitial insulin distribution
volume a-priori
nk min-1 Renal insulin clearance rate a-priori
nI L·min-1 Plasma-interstitial diffusion rate a-priori
nC min-1
Interstitial insulin degradation
rate a-priori
Uex mU·min-1 Exogenous insulin input rate a-priori
Pt mmol·min-1 Exogenous glucose input rate a-priori pgu min-1
Non-insulin mediated glucose
disposal rate a-priori
αI L·mU-1
Hepatic insulin clearance
saturation parameter a-priori
GB mmol·L-1 Basal blood glucose concentration identified
Vg L Glucose distribution volume identified
nL min-1 Hepatic insulin clearance rate identified
xL 1
Fractional first-pass hepatic insulin
extraction identified
28
3.3
Parameter identification
3.3.1 2-parameter identification approach
Initially, the DISST model uses a 2-parameter (x = [SI, VG]) identification approach when
assessing the SI value, having made the assumption of G0 = GB. Previously, these
participant-specific parameter values of SI and VG were identified based on the physiological simulation
of interstitial insulin and measured glucose data using the iterative integral method
(Docherty et al. 2012). The glucose samples that were taken in the first 5 minutes after the
glucose bolus were disregarded by the identification methods, as this period is heavily
influenced by mixing kinetics that are not captured by the whole body model of glucose
metabolism (Edsberg et al. 1987; Lotz et al. 2010). Linear interpolation was then used as an
estimate of the glucose response to the test stimulus.
In the identification procedure, the integral formulation of Equation 3.5 was rearranged and
separated into the coefficients of the known and unknowns parameters, yielding:
−𝑆𝐼 ∫ (𝐺𝑄 − 𝐺𝑡 𝐵𝑄𝐵)
0
𝑑𝑡 ⏟
𝐶𝑆𝐼
+ 1
𝑉𝐺∫ 𝑃𝑡𝑑𝑡
𝑡
0 ⏟
𝐶𝑉𝐺
= 𝐺𝑡− 𝐺0+ ∫ 𝑝𝑔𝑢(𝐺 − 𝐺𝐵)𝑑𝑡
𝑡
0
⏟ 𝐶
(3.6)
These coefficients of CSI, CVG and C were evaluated over the sample times from t = 0 until
𝑡 = 𝑡1, 𝑡2, ⋯ , 𝑡𝑒𝑛𝑑 at the end of the test. These sample periods were chosen to minimise the
fitting error and the variability of the identified insulin sensitivity (Docherty et al. 2011a).
29 [
𝐶𝑆𝐼𝑡=0𝑡=𝑡1 𝐶𝑉𝐺𝑡=0𝑡=𝑡1
𝐶𝑆𝐼𝑡=0𝑡=𝑡2 𝐶𝑉
𝐺𝑡=0𝑡=𝑡2
⋮
𝐶𝑆𝐼𝑡=0𝑡=𝑡𝑒𝑛𝑑
⋮
𝐶𝑉𝐺𝑡=0𝑡=𝑡𝑒𝑛𝑑]
[1−𝑆𝐼
𝑉𝐺
⁄ ] = [
𝐶𝑡=0𝑡=𝑡1
𝐶𝑡=0𝑡=𝑡2
⋮
𝐶𝑡=0𝑡=𝑡𝑒𝑛𝑑]
(3.7)
where 𝑡𝑖 (𝑖 = 1, 2 … ) < 𝑡𝑒𝑛𝑑 capture different integration intervals.
The values of VG are limited to identification of values within 12 to 25% of the participant’s
bodyweight to reduce the effect incomplete mixing might have on the SI term (Defronzo et
al. 1979; Ferrannini & Mari 1998; Lotz 2007; Lotz et al. 2010). However, while this
2-parameter identification approach might be true for a more normoglycemic, healthy cohort,
it may not hold in T2D or high insulin resistance.
3.3.2 3-parameter identification approach
Previous studies have suggested that GB and G0 should be treated as separate entities
especially for individuals with established diabetes (Holman & Turner
1977,1978,1979,1981). Hence, the participant-specific parameter values of GB, SI and VG can
be identified in a 3-parameter identification approach by adapting the Gauss Newton
parameter identification method (Björck 1996). The iteration function is defined:
where 𝐱𝑖 = [𝐺𝐵𝑖, 𝑆𝐼𝑖, 𝑉𝐺𝑖]𝑇 and i is the iteration number. The Jacobian matrix (J) and the
residual matrix (ψ) are defined:
30 where n is the number of measured samples, 𝛿𝐺𝛿𝜓1
𝐵𝑖 is the derivative of the residual matrix
with respect to GB, G(xi,t1) is the modelled glucose concentration at t = t1 given xi, GS(t1) is
the measured glucose level at t = t1.
VG is similarly limited to within the range of 12% to 25% of participant’s body weight to
avoid any parameter estimation issues. Equation 3.8 is iterated using Equation 3.9 until
convergence to a tolerance.
3.4
Summary
With an assumption of G0 = GB, like most model-based assessments of SI employed, the SI
value is well addressed by DISST model using a 2-parameter identification approach.
However, previous studies have demonstrated that G0 is not equal to GB especially for
individual with established diabetes. Hence, the original DISST model, while appropriate for
more normoglycaemic cohorts, needs to model basal glucose level as a variable for
assessing individuals with established T2D. This chapter presents the equations and
rationale for a novel 3-parameter identification approach.
𝐉(𝐱𝑖) =
[ 𝛿𝜓1 𝛿𝐺𝐵𝑖 𝛿𝜓1 𝛿𝑆𝐼𝑖 𝛿𝜓1 𝛿𝑉𝐺𝑖 𝛿𝜓2 𝛿𝐺𝐵𝑖 𝛿𝜓2 𝛿𝑆𝐼𝑖 𝛿𝜓2 𝛿𝑉𝐺𝑖 ⋮ ⋮ ⋮ 𝛿𝜓𝑛 𝛿𝐺𝐵𝑖 𝛿𝜓𝑛 𝛿𝑆𝐼𝑖 𝛿𝜓𝑛
𝛿𝑉𝐺𝑖]
, 𝛙(𝐱𝑖) = [
𝐺(𝐱𝑖, 𝑡1) − 𝐺𝑆(𝑡1)
𝐺(𝐱𝑖, 𝑡2) − 𝐺𝑆(𝑡2)
⋮
𝐺(𝐱𝑖, 𝑡𝑛) − 𝐺𝑆(𝑡𝑛)
31
Chapter 4. The necessity of identifying the basal
glucose set-point in the Type 2 Diabetes
This chapter underlines the importance of identifying GB as a variable, as opposed to other
typical model-based SI assessments, where GB is set equal to G0. In particular, the impact of
this approach is assessed for individuals with established T2D, where assessing SI accurately
is important.
4.1
Introduction
The DISST is an alternative modelling approach that allows a lower intensity test compared
to the IM-IVGTT that is often used to assess those with T2D and those with high insulin
resistance (Bergman et al. 1979b; Ward et al. 2001). The DISST SI value is highly correlated
to the EIC SI value (R=0.82), which is widely regarded as the reference method (McAuley et
al. 2011). In particular, the DISST is able to produce highly repeatable SI metrics and also
provides quantitative measures of UN via deconvolution of C-peptide data (Lotz 2007; Lotz
et al. 2010; Lotz et al. 2008; McAuley et al. 2011).
However, the DISST model and identification methods use the participant’s measured G0 as
their GB setting GB = G0. The GB term in the DISST model effectively has the role of
determining the set-point towards which the modelled glucose response moves. This choice
32
al. 1981; Bergman et al. 1987; Boston et al. 2003; Caumo et al. 1999). However, it is
important to note that the DISST model was developed in a relatively healthy,
normoglycemic cohort (Lotz ; Lotz et al. 2010). Hence, re-defining the role of GB as a variable
in the DISST based approach to assessing SI could more clearly capture the observed
glycaemic behaviour especially in T2D.
More specifically, studies have shown that G0 levels and insulin concentrations are slightly
higher in the morning than their overnight “basal” levels, especially for participants with
established diabetes (Holman & Turner 1977,1978,1979,1981). Thus, the assumption of GB =
G0 needs to be reviewed. In addition, prior evidence suggests that GB and G0 should be
treated as separate entities for individuals with established diabetes as the levels are
determined by relative insufficiencies in SI, UN,and rates of gluconeogenesis (Cahill 1971;
Cahill et al. 1959; Steele et al. 1968).
Hence, this chapter presents a novel modelling approach that identifies GB as a variable in a
3-parameter identification (x = [GB, SI, VG]). The goal is to capture more accurate glucose
dynamics, particularly for individuals with established type 2 diabetes. Results are thus
expected to be improved over the 2-parameter identification approach, especially for T2D