www.editada.org
_______________________________________________________________________________________
© Editorial Académica Dragón Azteca S. de R.L. de C.V. (EDITADA.ORG), All rights reserved.
Mental Workload Assessment Software in Spanish Language: Development and
Validation
Manuel Alejandro Barajas-Bustillos1, Aide Aracely Maldonado-Macias1, Juan Luis Hernández-Arellano2 1Instituto de Ingeniería y Tecnología, Universidad Autónoma de Ciudad Juárez
2Instituto de Arquitectura, Diseño y Arte, Universidad Autónoma de Ciudad Juárez
[email protected] [email protected]
Abstract. Mental workload assessment is a complex construct that requires effective software solutions that enables the application of a group of techniques in Spanish language. As methods, the Quality Function Deployment (QFD) is used to translate customer needs into technical requirements for software development. A case-based methodology is used for software design and a usability assessment is conducted. Client’s requirements were established from ergonomists and a software application is designed. According to the System Usability Scale (SUS), the software present good usability indicators. The results obtained were statistically validated by the Wilcoxon test.
Keywords: QFD, Usability, SUS, Wilcoxon, mental workload.
Article Info
Received Sep 26, 2018 Accepted Sep 11, 2019
1
Introduction
The use of computer programs (software) for handling and processing of information is extended worldwide for a plenty variety of applications. Software applications have been successfully deployed in different environments, although it has not been possible to implement them in all of them. One of the areas of opportunity for software implementation can be found in cognitive ergonomics assessment, particularly for the evaluation of mental workload.
Mental workload (MW), according to Stanton, Salmon, & Rafferty [1] is the proportion of mental resources demanded in the performance of one or more tasks. For MW evaluation purposes, there are two different techniques the empirical ones, which include subjective and physiological performance measures, and analytics ones, which consist of mathematical models and their simulations [2]. Subjective techniques are designed to obtain the operator's perception of mental workload, and their application involves the use of questionnaires.
At present, subjective techniques are the most commonly used [3]. In subjective techniques, the NASA-TLX technique is one of the most extensively studied and used. NASA-TLX is a multidimensional subjective evaluation technique presented by Hart and Stavel and in 1988 [4], and according to several authors, it's one of the most used subjective techniques in the evaluation of mental workload[1, 5–7].
Most subjective techniques are paper-based questionnaires. However, the use of software solutions is convenient and highly recommended to enhance the treatment of a large amount of data in a more reliable manner. Problems such as missing values or typographical errors due to human errors when the paper-based questionnaires are registered into databases can be eliminated; although there are techniques for dealing with these errors [9] these techniques have limitations [10] that may influence the analysis, so it is advisable to try to avoid such errors.
41
consultation; in addition, the results obtained by such websites lack proper validation. In the case of RAW TLX, which is the most recent version of NASA TLX, there is currently no software to facilitate its application and evaluation.
This work explores the needs of researchers, specifically cognitive ergonomists, to be provided with a software application that implements mental load assessment techniques to facilitate and enhance their research. These needs can be:
Storing the results obtained from different evaluations and to be able to recover these results in order to make comparisons of the mental workload in different subjects.
A software that enables to obtain reliable results. A software that can be easy to use.
1.1 Background
Cognitive ergonomics (CE) is the branch of ergonomics that deals with the cognitive part and, according to the definition by the International Ergonomics Association, CE deals with mental processes such as perception, memory, reasoning and motor response[11].On the other hand, according to Ferrer and Dalmau CE have they focus on the processes of perception, memory, information processing, reasoning, and motor response, focusing on the interaction of people and other elements of the system, also called cognitive processes[3]. Based on the above, the assessment of mental workload is one of the activities within the scope of Cognitive Ergonomics[12].
As mentioned before in the previous section, NASA TLX is a multidimensional subjective evaluation technique. This technique defines six dimensions of subjective load: mental demand, physical demand, temporal demand, effort, performance, and frustration level[4, 6]. In general, this technique involves two steps performed sequentially, in the first step paired comparisons are mad among the 6 dimensions that distinguish this technique for weighting purposes. The second step consists of an assessment of each dimension, using a scale from 1 to 100. Generally, this technique is performed immediately after the task has been performed[1, 13].A common NASATLX modification is called RAW TLX, which is obtained when subscales are averaged without completing the paired comparisons[14, 15].
The QFD for software design.
The Quality Function Deployment (QFD) is an original Japanese method developed by Yoji Akao in the 1960s that aims to ensure quality from the first stage in the development of new products[16]. The QFD methodology attempts to satisfy the needs of users, taking their desires through the design stages to the production of the product. Through QFD, quality becomes a function of product development.[17].
A typical QFD matrix has two portions [17–19]:
The horizontal part contains client information. It lists the needs and wishes of the customer and determines their relative importance. It also lists customer feedback and complaints.
The vertical part contains technical information that responds to information obtained from the client. It translates client needs and wishes in such a way that it can be measured, examines the relationship between the customer and technical requirements, and contains competitive technical data, objectives or goals set by a company to achieve competitiveness.
By following the QFD method, the "House of Quality" is formed, which is a representation of the customer's requirements and the technical solutions that would be applied.
On the other hand, Usability, according to the international standard ISO 9241-11 is a feature that allows a product to be used effectively, efficiently and satisfactorily[20]. Similarly, for Jakob Nielsen [21], usability refers to the characteristics of a product, such as learning ability, efficiency, memorability, low levels of error and satisfaction. Questionnaires are perhaps the most popular usability evaluation instruments[22].One of the questionnaires for usability evaluation is System Usability Scales (SUS), which has only 10 items. Some of the advantages are:
Is easy to administer to participants.
Can be used on small sample sizes with reliable results.
42
2
Methodology
In order to meet the above needs, this work considers the use of Quality Functions Deployment (QFD) to translate customer requirements into technical requirements for the software development, the evaluation of the usability of the software and the validation of the results of the mental workload evaluation obtained by the software, this because usability is one of the concepts that is taking most importance in the development of the software, and in addition, the statistical validation of the results is of great importance to developers, consequently the methodology was divided into four stages.
2.1 Establishment of the client's requirements
To establish the client's requirements for the development of a Mental Workload Assessment Software (MWAS) , the following steps established by QFD methodology were followed [16–19, 24]:
1. Identify the client's needs and requirements (WHATs), develop a WHAT List. 2. Analysis of WHATs, ranking them in order of importance.
3. This step lists and structures the technical measures (HOWs) identified by the product development team, creating a list. This list will determine what the product or service should have according to the customer's needs, the next step is to define the technical requirements necessary to be able to meet them.
4. In this step, the WHAT vs HOW Relationship Matrix is established, which is a tool to identify the degree of relationship between each WHAT and each HOW.
5. The Technical Correlation Matrix is established, which is the evaluation of the HOWs development team analyzes their interrelationships and how strong these relationships are, which can be obtained through engineering analysis and experience.
6. The last stage is related to the analysis of the HOWs, is in this last step is where finally the technical objectives are calculated that must be achieved to meet the specifications required by the product in development finally.
For the implementation of the client's requirements, each one of the requirements and the proposed technical solutions were analyzed.
2.2 Software Design
Based on the requirements of the software to be developed, there are a number of common characteristics[25–27]:
Main window. The contents of the program must be shown and must be designed considering the function of the program and can contain: the menu bar, work area, taskbars, among others. The colors must be harmonious with the rest of the system, in addition, they must not "damage the eye" making use of "strident" colors, also must limit the number of colors used because they can cause confusion.
Secondary window. This window will show some functions that are not very common and that are not contemplated in the main window, as well as configuration options. These should be of the modal type they should not yield the focus until the action on them is finished.
Menu bars. These contain a collection of actions that the user can apply in use, these actions can be open a document, exit the program, among others. Sometimes a simple menu bar is more than enough, in case a greater number is necessary they will have to follow a logical sequence and according to their function, for example, the manipulation of files in the menu called File, the configuration options in Tools, among others.
Content Panels. These are the main work area; a program will typically have one. Because they will be the main method of displaying information the color used in them should be adequate to avoid distractions, incomplete information, among others, also is recommended the use of scroll bars to navigate within the information contained. Common Controls. These controls are those that develop basic activities within the software, and these can be buttons,
43
2.3 Usability Evaluation
To evaluate the usability of the MWAS, the SUS questionnaire was used. The level of usability that the MWASshould be determined based on the client's requirements. The number of evaluations was conditioned to the level of usability presented by the MWASin its first version.
2.4 Validation of results
The validation of the results provided by MWAS was performed following the next steps:
Questionnaires from previous mental workload evaluations obtained through paper-based forms were selected. The selected questionnaires were registered in an Excel spreadsheet that was previously prepared with NASA TLX
calculus and, the mental workload scores were obtained.
The selected questionnaires were captured in MWAS and scores were obtained.
The results obtained by both methods were taken, and a nonparametric test was performed.
3
Results
3.1 Establishment of the client's requirements
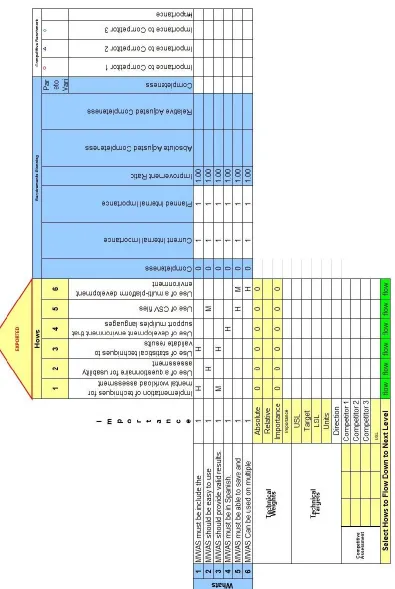
Following the steps of the QFD method was created the House of Quality, which is shown in Figure 1, in which it is possible to observe the Technical Correlation Matrix that shows, with the letter H the high correlations between WHAT and HOW, while with the letter M the Medium correlations are shown.
The WHATs and HOWs of this work are shown below:
WHAT1: MWAS must include the implementation of NASA TLX.
HOW1: For this requirement, it was decided that in addition to NASA TLX the RAW TLX technique should be
implemented because this last technique is a variation of NASA TLX and its implementation is very similar.
WHAT2: MWAS should be easy to use.
HOW2: In the case of this requirement, it was decided to make use of SUS, a questionnaire for the usability evaluation
of the user interface (UI). In order to ensure the usability level of MWAS, a minimum SUS score of 80 was established.
WHAT3: MWAS should provide valid results.
HOW3: To ensure the validity of the results provided by MWAS, statistical tests will be used.
WHAT4: MWAS must be in Spanish.
HOW4: The IDE used in development can create UIs in several languages.
WHAT5: MWAS must be able to save and compare results.
HOW5: In this requirement, it was decided to make use of CSV files because they are widely used by various software.
WHAT6: MWAS Can be used on multiple platforms.
HOW6: To solve this client requirement a cross-platform IDE for Rapid Application Development was chosen.
44
45
3.2 Software design
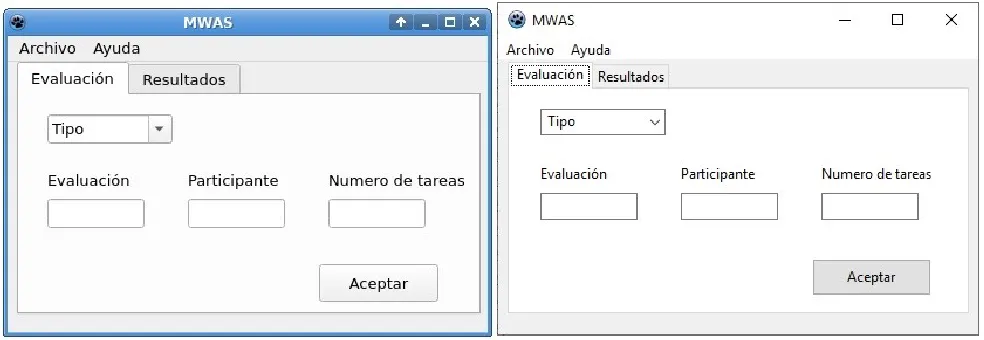
[image:6.612.48.540.220.390.2]For MWAS it was decided to make use of the main window in which, using tabs, the evaluator chooses if wants to apply an evaluation or obtain the results. In the Evaluation tab, text boxes have been added where the number of evaluations will be placed and the participant, when selecting the type (NASA TLX or RAW TLX), a secondary modal window will be shown where the participant will carry out the evaluation. If the Results tab is selected, text boxes will be added in which the evaluation number from which the results are to be obtained will be entered. Figure 2 shows the MWAS main windows on Linux and Windows.In addition, it was decided to omit the use of custom colors since these are also influenced by the visual theme of each system.
Fig. 2. MWAS in Linux and Windows platform.
.
3.3 Usability Evaluation
The evaluation of MWAS usability was carried out by 5 evaluators who had to experience in the evaluation of the mental workload. According to client’s requirements, and using the SUS scale of usability, the level of the program should be minimum 80. In the first evaluation the results were 67.5. To improve the usability of MWAS, and to take as reference the comments of the evaluators, the program was modified.
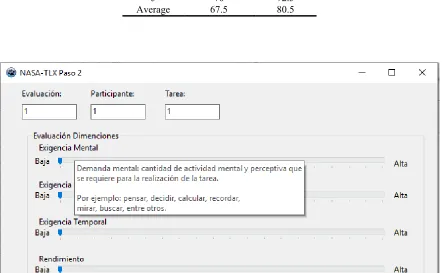
One of the changes suggested by the evaluators was to change the design of the UI in a way that the different items were not showed together, so that the NASA-TLX evaluation form was modified, separating into two different forms, a one form to perform the paired comparison and another for the evaluation of the different dimensions. Another of the suggested changes was to incorporate a tooltip that shows information about the use item selected. In Figure 3 the tooltips are shown.
46
Table 1. SUS scores of MWAS
SUS scores
Evaluator Evaluation First Evaluation Second
1 67.5 82.5
2 70 80
3 67.5 82.5
4 62.5 85
5 70 72.5
[image:7.612.85.527.186.459.2]Average 67.5 80.5
Fig. 3. Example of a ToolTip used in MWAS.
3.4 Validation of results
The selected questionnaires were 15 evaluations of four different tasks applied at different times and on different days. The 15 subjects who participated were asked to fill out a NASA TLX evaluation form. Once the forms were complete, the mental workload was calculated using an MS Excel © v.2013 spreadsheet. Subsequently, the evaluations of NASA TLX carried out by the 15 subjects were captured into MWAS, and the results were obtained. Table 2 shows the results of the mental workload scores obtained using both Excel and MWAS.
Table 2. SUS scores of MWAS
Task
NASA-TLX Score RAW TLX Score WP Score
Excel MWAS Excel MWAS Excel MWAS
1 760.00 760.00 286.00 286.00 1.583 1.584
2 720.00 720.00 255.33 255.33 1.517 1.517
3 756.66 756.67 265.33 265.33 1.055 1.055
[image:7.612.105.502.606.701.2]47
Based on the results showed in Table 2 and making use of SPSS© v.24, a series of nonparametric statistical tests were performed, specifically the Wilcoxon test, because the results are obtained based on subjective methods which make use of a qualitative scale, the data obtained do not meet a standard distribution and the use of non-parametric tests is necessary.The results of the 2 implementations are shown in Tables 3 and 4.
Table 3. Results of the Wilcoxon test between the results obtained among the implementation of NASA TLX of MWAS and Excel.
Hypothesis Test Summary. NASA TLX implementation
Null Hypothesis Test Sig. Decision
1 The median of
differences between Excel and MWAS
equals 0.
Related-Samples Wilcoxon Signed Rank
Test
0.157 Retain the
null hypothesis.
Asymptotic significances are displayed. The significance level is .050.
Table 4. Results of the Wilcoxon test between the results obtained among the implementation of RAW TLX of MWAS and Excel.
Hypothesis Test Summary RAW TLX implementation
Null Hypothesis Test Sig. Decision
1 The median of
differences between Excel and MWAS
equals 0.
Related-Samples Wilcoxon Signed Rank
Test
0.317 Retain the
null hypothesis.
Asymptotic significances are displayed. The significance level is .050.
As can be observed in Tables 3 and 4, it can be stated that the implementation of NASA TLX and RAW TLX of MWAS is valid with a 95% confidence interval and α = 0.05.
4
Conclusions
This work describes the steps of setting requirements, evaluating usability and validating the results obtained through MWAS, which are basic steps for the development of software of various types.
The use of QFD in the establishment of customer requirements in product development is widely known, in the case of software development, the use of QFD is limited. According to K. Prasad, the implementation of QFD in the development stage minimizes human interference of those who do not have deep technical knowledge about the functionality, capacity, economy, and applicability of the software[28].Thanks to the use of QFD 6 customer requirements were identified, which were implemented during the development of MWAS.
48
assessments. The score of 80 obtained by MWAS in the SUS assessment of usability indicates a good level, while it meets the client's requirements presents a great opportunity for improvement.
Regarding the statistical validation of the result,this is an important step if the software is intended to be used in the academic environment, an example of the above is the work of Liu, X., Kanungo, T., &Haralick, R. M performed in the validation of computer vision software [32].In the case of theof the results provided by MWAS,these were statistically valid, so the user's requirement is reached.With respect to preventing errors in the capture of results, as the evaluation is done directly in MWAS, the possible error is not allowed.
Based on the above, it can be concluded that the implementation of NASA TLX and RAW TLX into MWAS meets the requirements of the client, due to presents a good level of usability and the results obtained by it are statistically valid.
5
References
1. Stanton, N., Salmon, P.M., Rafferty, L.A.: Human Factors Methods: A Practical Guide for Engineering and Design. Ashgate Publishing, Ltd. (2013).
2. Xie, B., Salvendy, G.: Review and reappraisal of modelling and predicting mental workload in single- and multi-task environments. Work & Stress. 14, 74–99 (2000). https://doi.org/10.1080/026783700417249.
3. Ferrer, R., Dalmau, I.: Ergonomía cognitiva y carga mental. In: Manual de Psicosociología aplicada al trabajo y a la prevención de los riesgos laborales. pp. 159–190. Ediciones Pirámide (2014).
4. Hart, S.G., Staveland, L.E.: Development of NASA-TLX (Task Load Index): Results of Empirical and Theoretical Research. In: Hancock, P.A. and Meshkati, N. (eds.) Advances in Psychology. pp. 139–183. North-Holland (1988). https://doi.org/10.1016/S0166-4115(08)62386-9.
5. Bommer, S.C., Fendley, M.: A theoretical framework for evaluating mental workload resources in human systems design for manufacturing operations. International Journal of Industrial Ergonomics. 63, 7–17 (2018). https://doi.org/10.1016/j.ergon.2016.10.007.
6. Rubio, S., Díaz, E., Martín, J., Puente, J.M.: Evaluation of Subjective Mental Workload: A Comparison of SWAT, NASA-TLX, and Workload Profile Methods. Applied Psychology. 53, 61–86 (2004). https://doi.org/10.1111/j.1464-0597.2004.00161.x.
7. Young, M.S., Brookhuis, K.A., Wickens, C.D., Hancock, P.A.: State of science: mental workload in ergonomics. Ergonomics. 58, 1–17 (2015). https://doi.org/10.1080/00140139.2014.956151.
8. TLX @ NASA Ames - Home, https://humansystems.arc.nasa.gov/groups/tlx/.
9. Hair, J.F., Black, W.C., Babin, B.J., Anderson, R.E.: Multivariate Data Analysis. Pearson Education Limited, Harlow, Essex (2014).
10. Little, R., Rubin, D.: The Analysis of Social Science Data with Missing Values. Sociological Methods & Research. 18, 292–326 (1989). https://doi.org/10.1177/0049124189018002004.
11. International Ergonomics Association: Definition and Domains of Ergonomics | IEA Website, https://www.iea.cc/whats/index.html.
12. Barajas-Bustillos, M.A., Maldonado-Macías, A.A., García-Alcaraz, J.L., Arellano, J.L.H., Sosa, L.A.: Considerations of the Mental Workload in Socio-Technical Systems in the Manufacturing Industry: A Literature Review. In: Realyvasquez-Vargas, A., Maldonado-Macías, A.A., and Arredondo-Soto, K.C. (eds.) Advanced Macroergonomics and Sociotechnical Approaches for Optimal Organizational Performance. p. 328. IGI Global, Hershey PA, USA (2019).
13. Tubbs-Cooley, H.L., Mara, C.A., Carle, A.C., Gurses, A.P.: The {NASA} Task Load Index as a measure of overall workload among neonatal, paediatric and adult intensive care nurses. Intensive and Critical Care Nursing. (2018). https://doi.org/10.1016/j.iccn.2018.01.004.
14. Hart, S.G.: Nasa-Task Load Index (NASA-TLX); 20 Years Later. Proceedings of the Human Factors and Ergonomics Society Annual Meeting. 50, 904–908 (2006). https://doi.org/10.1177/154193120605000909. 15. Grier, R.A.: How High is High? A Meta-Analysis of NASA-TLX Global Workload Scores. Proceedings of the
Human Factors and Ergonomics Society Annual Meeting. 59, 1727–1731 (2015).
https://doi.org/10.1177/1541931215591373.
49
17. Sánchez, J.G.L., Grajales, M.Á.J., Aguilar, J.S.: Despliegue de la Función de Calidad para el Diseño de Limpiador Automático de Rodillo. Conciencia Tecnológica. 51–54.
18. QFD Explicado, http://asq.org/quality-progress/2003/03/problem-solving/qfd-explicado.html.
19. Govers, C.P.M.: What and how about quality function deployment (QFD). International Journal of Production Economics. 46–47, 575–585 (1996). https://doi.org/10.1016/0925-5273(95)00113-1.
20. International Organization for Standardization: ISO 9241-11:2018,
http://www.iso.org/cms/render/live/en/sites/isoorg/contents/data/standard/06/35/63500.html. 21. Nielsen, J.: Usability Engineering. Morgan Kaufmann, San Diego (1993).
22. Barajas-Bustillos, M.A., Maldonado-Macías, A.A., Hernández-Arellano, J.L., Avelar-Sosa, L., Reyes Martínez, R.M.: Methodology for Developing a Usability Assessment Questionnaire in Spanish as a Bilingual Strategy for Software Improvement: A Validation Approach. Applied Psycholinguistics and Multilingual Cognition in Human Creativity. 149–177 (2019). https://doi.org/10.4018/978-1-5225-6992-3.ch007.
23. Assistant Secretary for Public Affairs: System Usability Scale (SUS), https://www.usability.gov/how-to-and-tools/methods/system-usability-scale.html.
24. Chan, L.-K., Wu, M.-L.: Quality Function Deployment: A Comprehensive Review of Its Concepts and Methods. Quality Engineering. 15, 23–35 (2002). https://doi.org/10.1081/QEN-120006708.
25. Cooper, A., Reimann, R., Cronin, D., Noessel, C.: The essentials of interaction design. John Wiley & Sons, Inc, Indianapolis (2014).
26. Mayhew, D.J.: The usability engineering lifcycle. Morgan Kaufmann, San Diego (1999).
27. Shneiderman, B., Jacobs, S., Cohen, M., Diakopoulos, N., Elmqvist, N., Plaisant, C.: Designing the user interface : strategies for effective human-computer interaction. Addison-Wesley, Reading, MA (2016).
28. Prasad, K., Chakraborty, S.: A QFD-based decision making model for computer-aided design software selection. Management Science Letters. 6, 213–224 (2016).
29. Pressman, R.S., Maxim, B.R.: Software Engineering: A Practitioner’s Approach. McGraw-Hill Education (2015). 30. Castillo, R.I.B., Sánchez, V.G.C., Villegas, O.O.V., Lozoya, A.L.: Node Based Visual Editor for Mobile
Augmented Reality. 1. 7, 35–48 (2016).
31. Neubert, T.-A., Dusch, M., Karst, M., Beissner, F.: Designing a Tablet-Based Software App for Mapping Bodily Symptoms: Usability Evaluation and Reproducibility Analysis. JMIR mHealth and uHealth. 6, e127 (2018). https://doi.org/10.2196/mhealth.8409.