ORIGINAL RESEARCH
Is CT Still Useful in the Study Protocol of
Retinoblastoma?
P. Galluzzi T. Hadjistilianou A. Cerase S. De Francesco P. Toti C. Venturi
BACKGROUND AND PURPOSE: Intralesional calcium deposition is considered a key element for differ-entiating retinoblastoma from simulating lesions. Our aim was to assess whether MR imaging associated with ophthalmologic investigations (ophthalmoscopy and ultrasonography) could replace CT in the detection of diagnostic intralesional calcifications in retinoblastoma.
MATERIALS AND METHODS: Ophthalmoscopic findings, MR images, CT scans, and histologic exami-nation of 28 retinoblastomas from 23 consecutive children (11 males, 12 females; age range at admission, 1–35 months; mean age, 11 months; median age, 9 months) were retrospectively evalu-ated. Ultrasonography was performed in 18 patients with 21 retinoblastomas. MR imaging included T2-weighted spin-echo and gradient-echo images, fluid-attenuated inversion recovery images, and T1-weighted spin-echo images with and without contrast enhancement. Clinical data were integrated with MR imaging data to evaluate the utility of both approaches to discover calcifications; particularly, a correlation between intralesional signal-intensity void spots on MR imaging and hyperattenuating areas on CT scans was performed.
RESULTS: Ophthalmoscopy detected calcifications in 12 of 28 eyes (42.85%). Ultrasonography de-tected calcifications in 20 of 21 eyes (95.23%). CT showed hyperattenuating intralesional areas consistent with calcifications in 27 of 28 eyes (96.42%). MR imaging showed intralesional signal-intensity void spots in 25 of 28 eyes (89.28%). All spots detected with MR imaging matched the presence of calcifications on CT scans. Gradient-echo T2*-weighted and fast spin-echo T2-weighted images showed the highest degree of correlation with CT. When we put together ophthalmoscopy, ultrasonography, and MR imaging data, no calcifications detected on CT were missed, and the differential diagnosis was thorough.
CONCLUSIONS:A combination of clinical data and MR images may remove potentially harmful ionizing radiation from the study protocol of retinoblastoma.
E
arly diagnosis and treatment of retinoblastoma greatly im-prove the patient’s survival rate and quality of vision. Be-cause fine-needle aspiration biopsy carries a significant risk of procedure-related tumor seeding,1,2patients with retinoblas-toma are treated on the basis of clinical and imaging data, without a histologic diagnosis. Thus, noninvasive diagnostic accuracy is crucial. A decisive additional support of the oph-thalmoscopic diagnosis is given by matching intralesional cal-cifications.3,4The detection of intraocular calcium deposition is a key element to differentiate retinoblastoma from simulat-ing lesions. Histology reports show that retinoblastomas cal-cify inⱕ95% of cases5; CT has a designated sensitivity in de-tecting calcifications in retinoblastoma of 81%–96%,6-10 whereas the sensitivity of sonography has been reported to be ⱕ92.5% of cases.4In children younger than 3 years of age, an intrabulbar calcified mass is most likely a retinoblastoma.11,12 However, in children older than 3 years of age, other intraoc-ular lesions, such as retinopathy of prematurity, toxocariasis, Coats’ disease, retinal astrocytoma, and optic nerve drusen may appear as a calcified masses.3,10Retinoblastoma may veryrarely occur in older patients, but we have had a new diagnosis in a child older than 15 years of age (personal observation).13 CT or MR imaging or both are usually required to detect optic nerve, choroid, and scleral infiltration stages; disease spread beyond the eye; or intracranial disease. Imaging studies are used for diagnostic purposes only in very selected in-stances, as in cases in which ophthalmoscopy is impossible, such as with the presence of opaque ocular refractive media and massive retinal detachment or for differentiating lesions simulating retinoblastoma.11,14-23
The purpose of this study was to assess the utility of the association of ophthalmologic evaluation and MR imaging in the detection of intralesional calcifications in retinoblastoma, to evaluate whether CT is still mandatory in the protocol study of retinoblastoma and simulating lesions.
Materials and Methods
The population of this prospective study included 23 consecutive children (11 males, 12 females). Patients’ ages ranged from 1 to 35 months (mean age, 11 months; median age, 9 months). Fifteen pa-tients had unilateral retinoblastoma, and the remaining 8 had bilat-eral retinoblastoma. Patients’ clinical data were collected from inpa-tient and outpainpa-tient medical records of the referral center for retinoblastoma of our institution, including sex, age, affected eyes, and ophthalmoscopic data. Ultrasonographic data were available in 18 patients with 21 affected eyes. Three patients with bilateral retino-blastoma had already been submitted to enucleation of 1 eye before the admission to the department of ophthalmology. Parents gave in-formed consent for MR imaging and CT scanning in all the cases. The
Received March 6, 2009; accepted after revision April 27.
From the Unit of Diagnostic and Therapeutic Neuroradiology (P.G, A.C., C.V.), Azienda Ospedaliera Universitaria Senese, Siena, Italy; InterDepartmental Center of Nuclear Mag-netic Resonance (P.G, A.C., C.V.), Policlinico “Le Scotte,” Siena, Italy; and Unit of Ophthalmology (T.H., S.D.F.) and Department of Human Pathology and Oncology (P.T.), University of Siena, Siena, Italy.
Please address correspondence to Paolo Galluzzi, MD, Unit of Diagnostic and Therapeutic Neuroradiology, Azienda Ospedaliera e Universitaria Senese, Policlinico “Le Scotte,” Viale Bracci 1, 53100 Siena, Italy; e-mail: [email protected]
study protocol was approved by the ethics committee of our institution.
Two experienced ophthalmologists (T.H., S.D.F.) performed ophthalmoscopy, which always included careful examination of the ocular fundus and a search for intralesional calcifications.
MR imaging of the orbit was performed on a 0.5T unit (Gyroscan NT5; Philips Medical Systems, Best, the Netherlands) in 2 patients with 3 retinoblastomas and on a 1.5T unit (Gyroscan ACS-NT15; Philips Medical Systems) in 21 patients with 25 retinoblastomas.
In both patients studied on the 0.5T unit, unenhanced transverse spin-echo T1-weighted images (TR, 500 ms; TE, 25 ms; thickness, 3 mm; NEX, 2) and transverse fast-field echo T2* gradient-echo images (TR, 415 ms; TE, 27 ms; thickness, 3 mm; flip angle, 15°; NEX, 3) were obtained; in 1 patient, sagittal spin-echo T1-weighted images after gadolinium injection (TR, 500 ms; TE, 25 ms; thickness, 3 mm; NEX, 2) were obtained.
In the patients studied on the 1.5T unit, unenhanced transverse spin-echo T1-weighted images (TR, 500 ms; TE, 20 ms; thickness, 3.3 mm; NEX, 2) and transverse turbo spin-echo (TSE) T2-weighted im-ages (TR, 4000 ms; TE, 120 ms; echo-train length, 11; thickness, 3 mm; NEX, 2) were obtained in all of them (25 eyes). Unenhanced transverse fast-field echo T2* gradient-echo images (TR, 376 ms; TE, 23 ms; thickness, 3.3 mm; flip angle, 15°; NEX, 3), transverse fat-suppressed turbo fluid-attenuated inversion recovery images (TR, 5000 ms; TE, 100 ms; TI, 2000 ms; echo-train length, 18; thickness, 2.2 mm; NEX, 3), transverse 3D TSE T2-weighted images (3D TSE T2) (TR, 3000 ms; TE, 150 ms; echo-train-length, 17; thickness, 1.5 mm; gap,⫺0.8 mm; NEX, 1), and transverse 3D fast-field echo T2* gradi-ent-echo images (TR, 80 ms; TE, 23 ms; thickness, 2 mm; gap, ⫺1 mm; flip angle, 15°; NEX, 2) were obtained in 19 patients (21 eyes), 18 patients (22 eyes), 10 patients (10 eyes), and 4 patients (4 eyes), respectively. After intravenous injection of gadolinium, trans-verse spin-echo T1-weighted images (TR, 500 ms; TE, 20 ms; thick-ness, 3.3 mm; NEX, 2) and transverse fat-suppressed spin-echo T1-weighted images (TR, 550 ms; TE, 14 ms; thickness, 3.3. mm; NEX, 2) were obtained in 15 patients (19 eyes).
In all patients, orbit examination was performed with a surface coil (used as a receiver coil) positioned over both orbits, parallel to the coronal plane. In most patients, MR imaging was performed by using chloral hydrate for sedation (100 mg/kg of body weight).
MR images were qualitatively evaluated for evidence of intrale-sional signal-intensity-void spots by 2 experienced neuroradiologists (P.G., A.C.), unaware of ophthalmologic, CT, and histopathologic results. Intralesional spots were recorded as present, absent, or uncer-tain. In cases of initial disagreement, the final decision was made by consensus.
CT scans of the orbits were obtained in all 23 patients (Sytec and BrightSpeed; GE Healthcare, Milwaukee, Wis). Unenhanced CT of
the orbits was performed in all 23 patients with 28 retinoblastomas. Contiguous 1.25- to 1.5-mm-thick sections parallel to the can-thomeatal line through the orbits were obtained. An experienced neu-roradiologist (C.V.), blinded to MR imaging, ophthalmologic, and histologic findings, examined the CT scans to evaluate the presence of hyperattenuating intraocular areas consistent with calcifications. Correspondence between intraocular intralesional spots on MR im-aging and intraocular hyperattenuating areas on CT was then evaluated.
Histologic examination was performed in all 28 enucleated eyes. The eyes were fixed in saline-buffered formalin, sampled, embedded in paraffin, sectioned, and stained with hematoxylin-eosin.
Results
In all the enucleated eyes, the diagnosis of retinoblastoma was histologically confirmed, with evidence of calcifications in 27 of 28 eyes.
Calcifications were ophthalmoscopically detected in 12 of 28 eyes (42.85%). Ultrasonography showed posterior shadow-ing, consistent with calcifications, in 20 of 21 eyes (95.23%). CT showed hyperattenuating intralesional areas consistent with calcifications in 27 of 28 eyes (96.42%). Comparison be-tween signal-intensity voids detected on each MR image and calcifications on CT is summarized in the Table.
3D TSE T2-weighted and 3D gradient-echo T2*-weighted images showed the highest specificity (100%), followed by 3.3-mm-thick gradient-echo T2* images (87.5%). When all 3 se-quences were performed, there was 100% correspondence be-tween signal-intensity voids on MR images and calcifications on CT scans.
Discussion
Accurate and expedient diagnosis of retinoblastoma by a care-ful ophthalmoscopic examination through clear optical media is usually quite easy.24When refractive media are clear, the presence of large calcified areas is also easily documented by ophthalmoscopy.
Sonography is performed to assess the presence of vitreal or subretinal masses, the configuration and acoustic reflectivity of such masses, and the possible presence of retinal detach-ment. Sonography may be also used to detect the presence of intraocular calcifications successfully; particularly, calcium has been detected inⱕ92.5%4of cases in the most frequent retinoblastoma forms of growth (ⱕ95.23% in our personal records). However, sonographic capacity for detecting small calcified masses is limited by the presence of complex intraoc-ular interfaces associated with vitreous opacities, retinal masses, subretinal fluid, and retinal detachment.
Correspondence between signal-void spots on MR imaging and calcifications on CT
Sequence True-Positive (%) True-Negative (%) False-Positive False-Negative (%) Uncertain (%)
SE T1 13/28 (46.42) 1 (3.57) 7 (25) 7 (25)
TSE T2 17/28 (60.71) 1 (3.57) 5 (17.85) 5 (17.85)
FS FLAIR 15/22 (68.18) 1 (4.54) 4 (18.18) 2 (9.09)
GE T2* 21/24 (87.5) 1 (4.16) 3 (12.5)
3D TSE T2 10/10 (100)
3D GE T2* 4/4 (100)
SE T1 gd 11/20 (55) 5 (25) 4 (20)
FS SE T1 gd 9/19 (47.36) 1 (5.26) 5 (25) 4 (20)
Note:—SE indicates spin-echo; GE, gradient-echo; TSE, turbo-spin-echo; FS, fat-suppressed; FLAIR, fluid-attenuated inversion recovery; gd, gadolinium.
HEAD
&
NECK
ORIGINAL
Studies such as CT and MR imaging provide valuable help in the differential diagnosis between retinoblastoma and the simulating lesions, also supplying a detailed study of intra-and extraocular structures (including the brain). Moreover, they are not impaired by those conditions that weaken sonog-raphy and ophthalmoscopic examinations.
CT and MR imaging represent the primary modalities for visual-pathway imaging in children. MR imaging is the method of choice in depicting ocular lesions;8,11,25-27however, CT is still the method of choice for detecting intraocular cal-cium and investigating orbital pathologies.28,29
The disadvantages of CT are reduced soft-tissue contrast and spatial resolution compared with MR imaging; the pres-ence of the potential risk of iodinated contrast administration; and radiation exposure, especially in those patients with the hereditary form of the disease, who have elevated radiosensi-tivity. MR imaging is considered the method of choice for follow-up imaging in already diagnosed cases, especially to detect preclinical intracranial localization of the neoplastic disease.30The MR imaging appearance of retinoblastoma is usually specific enough to differentiate retinoblastoma from simulating lesions11; however, currently, MR imaging is not considered as specific as CT in detecting intraocular calcification.
The effect of calcium on tissue signal intensity in MR im-aging is variable:31,32calcified tissues are far more frequently hypointense (due to diamagnetic properties of the calcium),33 but isointensity or hypointensity is also possible, depending on the concentration of the surface area of the calcium parti-cles and on the MR imaging technique used. Isohyperintensity has been shown in particles withⱕ30% calcium by weight, but it decreases at high concentrations, as in the retinoblastoma-associated calcifications.
On spin-echo T2-weighted images, detectable calcifica-tions are far more frequently hypointense, especially when a high-field magnet and thin sections are used. One of the defi-ciencies of the spin-echo sequence lies in its well-recognized limited ability to detect calcification consistently.
Recent developments have introduced a very high-resolu-tion 3D TSE T2, which allows very thin sechigh-resolu-tions with high signal intensity–to-noise ratios: though this sequence allows a more accurate detection of orbital pathology, it could be more prone to motion artifacts than a conventional multisection sequence34and, to the best of our knowledge, the usefulness of
such a sequence in calcium detection has not been demon-strated. In our study group, the 3D TSE T2 sequence showed higher specificity in showing intralesional spots than the con-ventional fast spin-echo T2-weighted sequence (Fig 1).
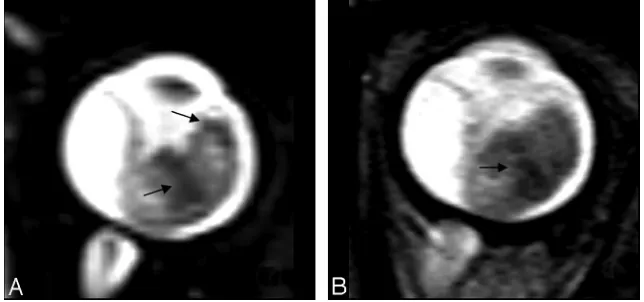
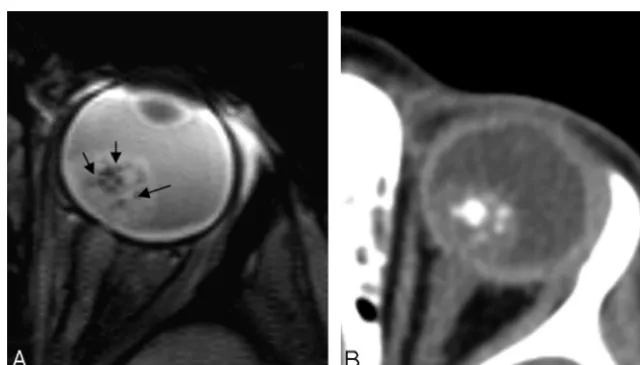
Gradient-echo T2*-weighted imaging has been shown to be more effective than spin-echo techniques in the detection of calcified structures, typically as very hypointense regions (Fig 2).35,36Because retinoblastoma is a heterogeneous tumor, the partially calcified areas may appear as hypointense foci within the higher intensity of the soft-tissue mass (Fig 3).
In our study, this behavior has been a significant advantage: the higher degree of signal-intensity loss of the calcifications and the lower hypointensity of the whole tumor on gradient-echo T2*-weighted images in comparison with routine TSE T2-weighted spin-echo images, has led to a superior detect-ability of intralesional spots in the former sequence; moreover, 3D gradient-echo T2*-weighted images increase the sensibil-ity in intralesional signal intenssensibil-ity–loss spot detection (Fig 4). Intralesional spots were detectable in 27 of the 28 eyes ex-amined. Among these 27 eyes, in 2 patients, intralesional spots were detectable only on 3D TSE T2 sequences, whereas in 3 patients, they were detected only on gradient-echo T2*-weighted imaging. Putting together 3-mm-thick gradient-echo T2*, tridimensional TSE T2, and tridimensional gradient-echo T2*-weighted images, we found a correspon-dence of 100% between the presence of intralesional spots on MR imaging and the presence of calcifications on CT exami-nations. Even fine calcifications were detectable (Fig 5).
The criterion for calcifications as a localized marked hy-pointense signal intensity on both T1- and T2-weighted im-ages without contrast enhancement has been sporadically de-scribed. Mihara et al37found spots of round signal-intensity drop-off in 3 of 7 retinoblastomas, considered calcifications on CT; recently, Lemke et al7showed MR imaging high sensi-tivity (91.7%) and specificity (88.9%) in detecting a marked amount of intraocular calcifications. Our series confirms the results of Lemke et al, adding the chance to reach 100% corre-spondence by using appropriate sequences and coupling neu-roradiologic and clinical findings.
A limitation of our study was that the appearance of calci-fication at T2-weighted images is not specific: Actually, aside from calcification, hypointensity on T2-weighted images can be found at the boundaries or inside the substance of various stages of hemorrhage (ie, deoxyhemoglobin, methemoglobin,
[image:3.594.132.454.43.194.2]hemosiderin) and at the borders of melanocytic lesions.35 However, intratumoral hemorrhage in retinoblastoma is quite uncommon, whereas calcifications are present in a very high percentage of patients. Moreover, a real signal-intensity drop-off in gradient-echo images obtained on a high-field magnet is highly suggestive of calcifications, though hemosiderin or melanin may not be excluded; in our study, all areas suspected of calcifications at MR imaging were confirmed by CT exam-inations. Additionally, the correspondence between zones of signal-intensity loss on gradient-echo T2*-weighted images and calcifications documented on CT scans was recently dem-onstrated in 4 patients with Fabry disease.38Finally, no areas of
hyperintensity on T2-weighted images (possibly correspond-ing to oxyhemoglobin and extracellular methemoglobin stages of hemorrhage) have been documented in our series, also confirmed by histology in the 28 enucleated bulbs. These data strengthen the hypothesis of the correlation between drop-off signal intensity on MR imaging and calcifications.
Despite the fact that retinoblastoma and melanoma usually have different ages of presentation, both the diseases may present in children older than 7 years of age and in teenagers (personal observation).13,39The MR imaging characteristics of retinoblastoma are quite similar to those of uveal melanoma; however, to our knowledge, MR imaging in uveal melanoma
Fig 2.Conventional 3.3-mm-thick gradient-echo T2*-weighted images (on the left) and CT scans (on the right) of the same patient. Note the correspondence between hypointense spots
on MR imaging and hyperattenuating spots on CT.
Fig 3.A, Focal areas of signal-intensity loss on a gradient-echo T2-weighted image (arrowinA) and a TSE T2-weighted image (arrowsinB).C, CT scan confirms intralesional calcium
[image:4.594.134.453.42.344.2] [image:4.594.55.536.376.550.2]does not show spots of signal-intensity loss in spin-echo T2-weighted and gradient-echo T2*-T2-weighted imaging. Further-more, we never noticed such a sign in our personal case records. Finally, proton MR spectroscopy may allow a differ-ential diagnosis, because the visual appearance of retinoblas-toma and uveal melanoma are completely different.11
Although CT is superior in calcium detection,40the use of newer magnets (even if with the same magnetic field strength) allowing thinner sections may increase the specificity in cal-cium detection. We noticed that the use of very thin sections, both in TSE T2-weighted and in gradient-echo T2*-weighted techniques, may improve the detectability of intralesional spots. The development of a smaller diameter dedicated sur-face coil may allow the detection of very small intraocular lesions, even with a thickness of⬍1 mm.27
Our study has clearly shown the possibility of detecting calcifications in retinoblastoma, when MR imaging, ultra-sonographic, and ophthalmoscopic data are used jointly.
On the basis of the results of our study and considering the aims of orbital investigations in retinoblastoma, we think that a detailed neuroimaging study might comprise unenhanced T1-weighted, thin-section TSE T2, gradient-echo T2*-weighted (when available, 3D sequences), and fat-suppressed enhanced weighted images. Fat-suppressed enhanced
T1-weighted images are preferable to (in comparison with) non-fat-suppressed spin-echo T1-weighted enhanced images be-cause of the superiority in detecting optic nerve invasion and intraorbital extension of a retinoblastoma.41
Conclusions
Although intracranial calcifications have been extensively studied by MR imaging, there is not much detailed informa-tion about the capability of MR imaging in detecting intraoc-ular calcifications.
We agree with the unquestionably superior specificity of CT in detecting calcifications; however, although brain calci-fication may be documented exclusively by means of neurora-diologic investigations, intraocular calcifications may also be discovered during ophthalmoscopic and ultrasonographic ex-amination. In our 28 eyes with retinoblastoma, the combina-tion of ophthalmologic investigacombina-tions and MR imaging al-lowed us to make no mistakes in identifying calcifications; to the best of our knowledge, no study has coupled MR imaging and ophthalmologic investigations in detecting intraocular calcification.
We believe that if the ophthalmologist and the neuroradi-ologist work closely together, much more useful information on ocular structures may be obtained, including the detection
Fig 4.3D gradient-echo T2-weighted image (A) shows focal signal-intensity loss, corresponding to a hyperattenuating area on the CT scan (B)
[image:5.594.134.453.42.218.2] [image:5.594.133.453.243.425.2]of intraocular calcifications, without the use of potentially harmful ionizing radiation.
Acknowledgments
We thank Dr Donatella Balducci (Unit of Anesthesiology, Azienda Ospedaliera Senese) for her high-level experience in the sedation of children, and Drs Roberto Faleri and Ombretta Bugiani (University Library, Policlinico Le Scotte, Siena) for their invaluable help in finding pertinent literature manuscripts.
References
1. Singh AD, Shields CL, Shields JA.Prognostic factors in retinoblastoma.J Pe-diatr Ophthalmol Strabismus2000;37:134 – 41
2. Karcioglu ZA, Gordon RA, Karcioglu GL.Tumor seeding in ocular fine-needle aspiration biopsy.Ophthalmology1985;92:1763– 67
3. Shields JA, Shields CL.Differentiation of Coats’ disease and retinoblastoma.
J Pediatr Ophthalmol Strabismus2001;38:262– 66
4. Roth DB, Scott IU, Murray TG, et al.Echography of retinoblastoma: his-topathologic correlation and serial evaluation after globe-conserving radio-therapy or chemoradio-therapy.J Pediatr Ophthalmol Strabismus2001;38:136 – 43 5. Nicholson DH, Norton EWD.Diffuse infiltrating retinoblastoma.Trans Am
Ophthalmol Soc1980;78:265– 89
6. Weber AL, Mafee MF.Evaluation of the globe using computed tomography and magnetic resonance.Isr J Med Sci1992;23:145–52
7. Lemke A-J, Kazi I, Mergner U, et al.Retinoblastoma-MR appearance using a surface coil in comparison with histopathologic results. Eur Radiol
2007;17:49 – 60
8. Beets-Tan RG, Hendricks MJ, Ramos LM, et al.Retinoblastoma: CT and MRI.
Neuroradiology1994;36:59 – 62
9. Char DH, Hedges TR, Norman D.Retinoblastoma: CT diagnosis. Ophthalmol-ogy1984;91:1347–50
10. Lindahl S.Computed tomography of retinoblastoma.Acta Radiol Diagn
(Stockh) 1986;27:513–18
11. Mafee MF, Goldberg MF, Cohen SB, et al.Magnetic resonance imaging versus computed tomography of leukocoric eyes and use of in vivo proton magnetic resonance spectroscopy of retinoblastoma.Ophthalmology1989;96:965–75, discussion 975–76
12. Edwards DP, Mafee MF, Garcia-Valenzuela E, et al.Coats’ disease and persis-tent hyperplastic primary vitreous: role of MR imaging and CT.Radiol Clin North Am1998;36:1119 –31
13. Park JJ, Gole GA, Finnigan S, et al.Late presentation of a unilateral sporadic retinoblastoma in a 16-year-old girl.Aust N Z J Ophthalmolol1999;27:365– 68 14. De Potter P, Flanders AE, Shields JA, et al.The role of fat-suppression tech-nique and gadopentetate dimeglumine in magnetic resonance imaging eval-uation of intraocular tumors and simulating lesions.Arch Ophthalmol
1994;112:340 – 48
15. Smirniotopoulos JG, Bargallo N, Mafee MF. Differential diagnosis of leukokoria: radiologic-pathologic correlation. Radiographics 1994;14: 1059 –79
16. De Potter P, Shields JA, Shields CL.Tumors and pseudotumors of the retina. In: De Potter P, Shields JA, Shields CL, eds.MRI of the Eye and Orbit.
Philadelphia: J.B. Lippincott & Company; 1995:93–116
17. Atlas SW, Galetta SL.The orbit and visual system.In: Atlas SW, ed.Magnetic Resonance Imaging of the Brain and Spine.2nd ed. Philadelphia: Lippincott Wil-liams & Wilkins; 1996:1018 –92
18. Barkhof F, Smeets M, van der Valk P, et al.MRI in retinoblastoma.Eur Radiol
1997;7:726 –31
19. Kaufman LM, Mafee MF, Song CD.Retinoblastoma and simulating lesions.
Radiol Clin North Am1998;36:1101–17
20. Villablanca JP, Mafee MF, Kaufman LM, et al.Facies to remember: retinoblas-toma, Coats’ disease, and toxocariasis.Int J Neuroradiol1998;4:41–50 21. Galluzzi P, Venturi C, Cerase A, et al.Coats’ disease: smaller volume of the
affected globe.Radiology2001;221:64 – 69
22. Shields JA, Shields CL, Suvarnamani C, et al.Retinoblastoma manifesting as orbital cellulitis.Am J Ophthalmol1991;112:442– 49
23. Brisse HJ, Lumbroso L, Fre´neaux PC, et al.Sonographic, CT, and MRI findings in diffuse infiltrative retinoblastoma: report of two cases with histologic com-parison.AJNR Am J Neuroradiol2001;22:499 –504
24. Abramson DH.Retinoblastoma: diagnosis and management.CA Cancer J Clin
1982;32:130 – 40
25. Mafee FM, Mafee RF, Malik M, et al.Medical imaging in pediatric ophthalmol-ogy.Pediatr Clin N Am2003;50:259 – 86
26. Wilms G, Marchal G, Van Fraeyenhoven L, et al.Shortcomings and pitfalls of ocular MRI.Neuroradiology1991;33:320 –25
27. Schueler AO, Hosten N, Bechrakis NE, et al.High-resolution magnetic reso-nance imaging of retinoblastoma.Br J Ophthalmol2003;87:330 –35 28. Ettl A, Krames J, Daxer A, et al.High-resolution magnetic resonance imaging
of neurovascular orbital anatomy.Ophthalmology1997;104:869 –77 29. Davis PC, Hopkins KL.Imaging of the pediatric orbit and visual pathways:
computed tomography and magnetic resonance imaging.Neuroimaging Clin N Am1999;9:93–114
30. Duncan JL, Scott IU, Murray TG, et al.Routine neuroimaging in retinoblas-toma for the detection of intracranial tumors.Arch Ophthalmol2001;3:450 –52 31. Henkelman RM, Watts JF, Kucharczyk W.High signal intensity in MR images
of calcified brain tissue.Radiology1991;179:199 –206
32. Tsuruda JS, Bradley WG.MR detection of intracranial calcification: a phan-tom study.AJNR Am J Neuroradiol1987;8:1049 –55
33. Go JL, Zee CS.Unique CT imaging advantages: hemorrhage and calcification.
Neuroimaging Clinics of North America1998;8:541–52
34. Simon EM, Mc Caffery S, Rowley HA, et al.High-resolution 3D T2-weighted fast spin echo: new applications in the orbit.Neuroradiology2003;45:489 –92 35. Atlas SW, Grossman RI, Hackney DB, et al.Calcified intracranial lesions:
de-tection with gradient-echo-acquisition rapid MR imaging.AJR Am J Roentge-nol1988;150:1383– 89
36. Henkelman M, Kucharczyk W.Optimization of gradient-echo MR for calcium detection.AJNR Am J Neuroradiol1994;15:465–72
37. Mihara F, Gupta KL, Joslyn JJ, et al.Intraocular hemorrhage and mimicking lesions: role of gradient-echo and contrast-enhanced MRI.Clin Imaging
1993;17:171–75
38. Moore DF, Ye F, Schiffmann R, et al.Increased signal intensity in the pulivinar on T1-weighted images: a pathognomonic MR imaging sign of Fabry disease.
AJNR Am J Neuroradiol2003;24:1096 –101
39. Shields CL, Shields JA, Milite J, et al.Uveal melanoma in teenagers and children: a report of 40 cases.Ophthalmology1991;98:1662– 66
40. Kucharczyk W, Henkelman RM.Visibility of calcium on MR and CT: can MR show calcium that CT cannot?AJNR Am J Neuroradiol1994;15:1145– 48 41. Ainbinder DJ, Haik BG, Frei DF, et al.Gadolinium enhancement: improved