Munich Personal RePEc Archive
The Cost of Requiring Charities to
Report Financial Information
Marx, Benjamin M.
University of Illinois at Urbana-Champaign
25 August 2018
The Cost of Requiring Charities to Report Financial Information
Benjamin M. Marx*
July 2018
Abstract
Taxes and regulations, such as labor laws and reporting requirements, often exempt small firms, creating incentives to stay small or delay growth. Firms’ responses to such size thresholds provide an opportunity to empirically assess consequences of regulations and firms’ willingness to pay to avoid them. This paper provides a theoretical model for evaluating welfare effects of moving such thresholds. It then analyzes an income notch at which IRS reporting requirements for charitable organizations become more onerous. Standard bunching estimates imply that the average charity will reduce reported income by $750 to $1000 to avoid filing the more onerous information return. Panel data methods show that an even larger share of charities fail to appear when first required to report more information. There is some evidence of retiming of income to delay growing above the notch, but a long-run reduction in the share that grow above the notch provides evidence of real responses as well. Relatively low-expense and low-asset charities are most likely to reduce reported income to stay below the notch, while charities with past receipts above the notch do not manipulate income, suggesting the report imposes an adjustment cost on new filers.
JEL: L38, H26, D64.
1 Introduction
Taxes, price discrimination, income eligibility limits, and other policies create discontinuities in budget constraints, or “notches” (Slemrod, 2010). Notches create incentives that can distort behavior. A pervasive example is a notch at which expenses rise discretely with income, creating incentives for “bunching” below the notch by reducing (reported) income. Such income notches can be found in policies that provide benefits to low-income individuals, such as Medicaid (Yelowitz, 1995), or that restrict government attention to high-income firms, as have elements of the Sarbanes-Oxley Act (Iliev, 2010), the Americans With Disabilities Act (Acemoglu and Angrist, 2001), the Affordable Care Act, value-added taxes (Keen and Mintz (2004), Dharmapala et al. (2011)), and some countries’ payroll tax systems (Dixon et al., 2004). Income notches produce deadweight loss if they affect income, and a growing literature estimates behavioral parameters by quantifying bunching in the distribution of income around a notch.
This paper studies bunching by charitable organizations at an income eligibility limit for simplified IRS reporting forms. The charitable sector is large, accounting for about 9 percent of all U.S. wages and salaries (Roeger et al., 2012). Charities receive exemption from paying income taxes because they provide public goods. However, they must file annual information returns with the IRS to enable monitoring by the government and the public. Some monitoring is likely warranted to promote good management and to prevent “for-profits in disguise” from exploiting the organizational form to evade taxes. However, requiring charities to report this information imposes a compliance cost. The problem of determining optimal reporting requirements for these organizations mirrors regulations in other industries, particularly where firms likely produce sizable externalities.
I first provide a theoretical framework to describe welfare effects of changing information reporting requirements. Organizations maximize net available resources, making the model applicable to charities promoting their missions or other types of organizations. Those exceeding an income threshold must pay a fixed cost to report more information than those below the threshold. The government sets the location of the threshold so as to maximize a social welfare function that aggregates the organizations’ net resources and the value of the information they provide. The first-order conditions from the government’s problem produce sufficient statistics for the welfare effect of moving the policy threshold. I begin with a static model, which provides the intuition that requiring more information from organizations provides a public information good but increases the compliance cost imposed on marginal organizations. I then general the model to two periods and then to the infinite horizon and allow for extensive-margin responses. This identifies a more general set of parameters to be estimated.
For completeness, I include results of standard bunching estimation techniques. Marx (2018) shows that the standard approach is subject to considerable bias in the presence of extensive-margin responses or a notch that is faced repeatedly. Marx (2018) proposes three new bunching designs that exploit panel data, and I employ all of them here. The first takes advantage of a one-time notch, which charities faced at particular income thresholds in 2008 and 2009 as the notch was moved, to estimate long-run effects of approaching a notch. The second estimates an OLS counterfactual through bins of agents’ income from two years, rather than one, to describe heterogeneity in responses to the notch and the extent to which agents are induced to bunch repeatedly. This design has already been employed by St.Clair (2016). The third design employs the same pairs-of-years identification strategy as the second design but uses maximum likelihood estimation to precisely quantify the bunching response and extensive-margin responses (in this setting non-filing or late filing). Last, I employ donut-RD specifications, which exclude the selected sample in the omitted range surrounding the notch, to estimate the average number of years that it takes for extensive-margin responders to return to the sample.
Results from each of the empirical designs are illuminating. I show that the reporting notch reduces the incomes of public charities in both the short and the long run. I find that bunching of charities at this notch permanently reduces income, indicating that charities actually forgo income to bunch (and are not simply misreporting). There is significant heterogeneity in the response, with evidence that much of the compliance cost is a one-time adjustment; controlling for current income, a one percent increase in a charity’s expenses or assets is associated with a 2.5 percent reduction in the probability of manipulating receipts when approaching the notch in the next year.. Extensive-margin responses appear to be at least as important as the bunching response. Extensive-margin responders leave the sample for an average of 1.5, again suggesting a temporary adjustment to filing the more comprehensive information return. Welfare analysis indicates that the income threshold for filing should be lowered if the social benefit of each report filed exceeds $55. With standard methods one would vastly overestimate this quantity to be over $750.
bunch-ing at a state audit threshold. Both find compliance costs to be non-negligible, consistent with my results for national reporting requirements.
This paper also contributes to the literature on firm compliance costs by providing evidence that charities manipulate income to avoid incurring the adjustment cost of complying with new reporting requirements. Tax and regulatory compliance costs made up close to three percent of the revenue of the 1300 largest firms in 1992 (Slemrod and Blumenthal, 1993). Compliance costs appear to have an important fixed component because their burden is proportionately heavier on smaller businesses (Slemrod and Venkatesh, 2002). The estimates in these papers preceded the Sarbanes-Oxley Act, which greatly increased reporting requirements. Public charities also face scale economies in compliance, which consumes 7 percent of the annual budgets of surveyed charities with revenue below $100,000 (Blumenthal and Kalambokidis, 2006b). Consistent with these findings, I provide evidence that adjustment is an important component of total compliance cost. I find that charities whose incomes in the prior year necessitated filing a long form showed no propensity to reduce current income by even a small amount to avoid filing again. Moreover, regulatory instruments may affect the firm size distribution and its evolution. Policy effects interact with measures of organizational capacity similar to those that have been shown to influence the evolution of the for-profit firm size distribution (Cabral and Mata (2003); Angelini and Generale (2008)).
The benefit of imposing reporting costs is that firms must disclose information for use by the government and individuals. Investors in for-profit firms appear to value mandatory disclosure of financial information (Greenstone et al., 2006), and the same is likely true of donors to nonprofit firms. The reporting notch there-fore reflects a trade-off between imposing additional compliance costs on charities and obtaining additional information from them, much like the calculus of weighing compliance and administrative costs against tax revenues when setting a VAT tax that excludes small firms (Keen and Mintz (2004), Dharmapala et al. (2011)). It is known that income responses must be considered in such situations, and I derive a formula for welfare effects of setting regulatory notches when responses include avoidance and evasion.
The paper proceeds as follows. Section 2 provides background information about the information re-porting of public charities and the panel of data this provides. In Section 3, I model the welfare effects of changing the income threshold at which a regulation applies. Section 4 presents empirical analysis and welfare implications. Concluding remarks appear in Section 5.
2 The Setting: Nonprofit Information Returns
of charities make this setting an attractive application for dynamic bunching estimation.
2.1 Background on the Reporting of Charities
Recent Congressional hearings and increases in IRS monitoring of the nonprofit sector demonstrate renewed interest in the optimal regulation of charitable organizations.1 Public charities are organizations granted income and sales tax exemption under section 501(c)(3) of the Internal Revenue Code on condition that they serve a public purpose and do not distribute profits.2 Tax exemptions for charities, and tax deductions for donors, create opportunities for tax avoidance and evasion; about a third of each annual IRS “Dirty Dozen” list of tax evasion schemes involves public charities. All public charities with gross receipts over $25,000 (except religious congregations) must annually file information returns with the IRS using Form 990 or Form 990-EZ. For fiscal years starting before 2008, charities with gross receipts exceeding $100,000 or year-end total assets above $250,000 were required to file the lengthier Form 990.3
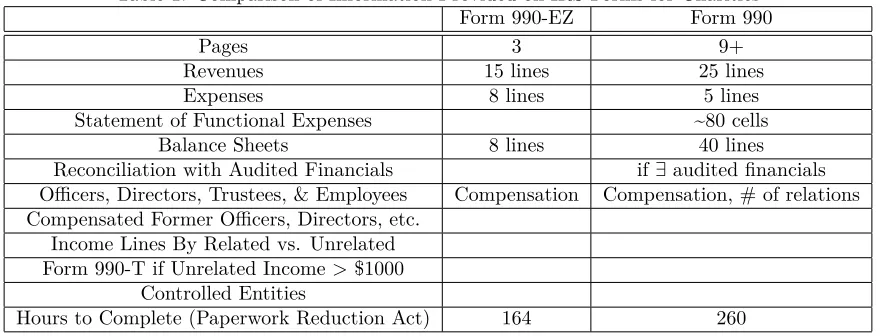
Form 990 requires charities to access and report more financial data than Form 990-EZ. Table 1 presents a comparison of 990-EZ and 990 for fiscal years beginning in 2007 or earlier. The two forms require nearly all the same categories of information, but Form 990 requires much greater detail. Form 990 contains more lines in most sections and requires a detailed statement of functional expenses. Estimates under the Paperwork Reduction Act for the time required for completion and filing are 164 hours for Form 990-EZ and 260 hours for Form 990 (Internal Revenue Service, 2007). The time estimates include the required Schedules A and B and include time required to perform the necessary recordkeeping (the majority of the difference between the two forms), to learn about the forms, and to prepare and assemble them. The raw difference of roughly 100 hours (a 59% increase), if accurate for the marginal charity near the notch, would imply that an organization with receipts above $100,000 by less than 100 times the hourly wage could forgo enough receipts to stay below the notch and have more net resources as a result. Blumenthal and Kalambokidis (2006b) asked for 1Reforms since 2007 include requiring individuals to maintain receipts for noncash donations, revising the 990 forms for
fiscal years 2008 and after to require more information from each organization, revoking the tax-exempt status of more than a quarter-million organizations that had not filed in the three years leading up to 2011, and the introduction in 2014 of a new form 1023-EZ to simplify the process for small charities to apply tax-exempt status. In an October 6, 2011 letter to the IRS Commissioner, House of Representatives Committee on Ways and Means Chairman of the Subcommittee on Oversight Charles Boustany wrote that members of both the Oversight and Health Subcommittees “have expressed concern that other tax-exempt organizations may not be complying with the letter or the spirit of the tax-exempt regime, yet continue to enjoy the benefits of tax exemption.” In 2012 the Subcommittee Chairman called a series of hearings to elicit testimony from the IRS and experts on the nonprofit sector, and the IRS will be holding a public hearing on proposed regulations for charitable hospitals.
2The “nondistribution requirement” prohibits nonprofits from paying operating profits to individuals who exercise control
over the organization. Excise taxes can be imposed on “excess benefit transactions” including compensation packages deemed to be excessive. Nonprofits include foundations, churches, political groups, and labor organizations in addition to the public charities studied in this paper. State laws vary but frequently exempt charities from income and sales taxes.
3The IRS also provides simplified individual income tax forms for filers with incomes below a notch, but it turns out this
the titles and qualifications of individuals responsible for filings and imputed hourly wages between $13.09 and $51.77. If all charities faced a marginal cost of filing Form 990 equal to 100 hours at a rate of $13 per hour then none should report receipts between $100,000 and $101,300.4 Realistically, the marginal cost of filing would vary with the amount of recordkeeping already being performed, implying variation in the amount of receipts charities would forgo to avoid filing. Blumenthal and Kalambokidis (2006b) also find that after controlling for size and other factors, those filing Form 990 report spending about 45% more on professional advisory fees than those filing Form 990-EZ.
Form 990 may also impose a disclosure cost on charities that do not want to reveal certain information. For example, charities filing Form 990 must check a box if any officers or key employees are related to each other and must list any former officers that were compensated during the year. However, most potentially-sensitive information is required of both types of filers: compensation of current officers and employees must be listed on each form, and the rule for completing Schedule B (Schedule of Contributors) is the same for both forms.5 Moreover, charities near the eligibility notch at $100,000 of gross income are unlikely to be able to pay large salaries. It will not be possible to fully test for disclosure costs, but I look for suggestive evidence by relating income manipulation to ex-post values of items appearing only on Form 990.
Income threshold policies may create incentives for entities to reorganize as multiple smaller organizations (Onji, 2009). In the present context this incentive is likely to be weak because exempt status would have to be applied for and obtained for each organization and because economies of scale are likely to be considerable at sizes small enough to make organizations eligible to file Form 990-EZ. I therefore treat each charity as an individual unit.
2.2 Panel Data on Charities
This study uses IRS data from the “Core Files” of the National Center for Charitable Statistics (NCCS), a division of the Urban Institute. IRS databases offer the most comprehensive standardized data on tax-exempt organizations in the U.S. The IRS produces a Business Master File of descriptive information from each filing and Return Transaction Files of financial information. The NCCS Core files contain data from the IRS databases on all 501(c)(3) organizations that were required to file a Form 990 or Form 990-EZ and 4Kline and Tartari (2015) do not find bunching at the earnings eligibility threshold for a state welfare reform despite other
evidence of effects on earnings. They argue bunching may understate total responses for individuals who have incomplete control over earnings and whose incentives to reduce taxes by underreporting may result in reported earnings just above the threshold. While charities undoubtedly face some lumpiness in each of their sources of income, they are likely to have significantly more control over earnings than an individuals negotiating with employers, and since revenues are not taxed there is no obvious reason to underreport except to keep income below reporting thresholds.
5Public charities must file Schedule B if they received any individual contributions of more than $5000. Those meeting the
complied in a timely manner.6 Analyses “show the IRS 990 Returns to be a generally reliable source of financial data,” although inattention by filers adds noise to the data and purposeful expense shifting may inflate program-related expenses relative to administrative expenses (Froelich and Knoepfle, 1996). This study makes limited use of expense categories and explicitly examines manipulation of revenue around the Form 990 reporting notch.
Several financial variables from each form appear in the data. In this paper I focus on gross receipts. “Contributions, gifts, grants, and similar amounts received” make up the largest component of gross receipts. The other components are program service revenue, membership dues, investment income, gross sales of inventory, gross sales of other assets, and other revenue, all of which appear in the data. Total assets, liabilities, and expenses are each available for both types of filing. While both forms require listing all officers, directors, and trustees and the compensation paid to each, compensation only appears in the data for organizations that filed Form 990.7 Other variables populated for all filings include the date at which tax-exempt status was granted, reasons for 501(c)(3) status, and codes describing the type of organization and services provided. I do not use the limited set of variables collected from Schedule A, which includes lobbying and other political expenses that equal zero for a large majority of organizations.
I analyze public charities in filing years 1990 to 2010, the years for which data on public charities are currently available. Marx (2015) compiled data on private charitable foundations going back to the 1960s, but private foundations file Form 990-PF and hence do not face the same notch as public charities. Data for each NCCS file year comprise the most recent return filed by each organization. Unfortunately, the variable indicating whether organizations filed Form 990 or 990-EZ is not available for file years preceding 2006. I use the Form 990 variable to show that the receipts notch is a binding constraint for many charities in 2007 but use observations from the earlier years throughout the analysis.
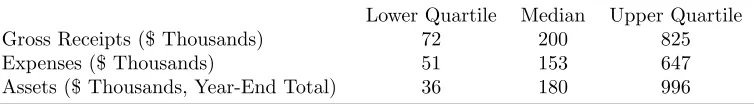
Table 2 provides summary statistics showing the prevalence of small charities. The $100,000 receipts notch (which has been defined nominally and not adjusted for inflation) falls between the lower quartile and median of gross receipts. Expenses are highly correlated with gross receipts, while assets exhibit greater variation. Of the more than four million observations in the data, over 20,000 have receipts in a region around the notch. The IRS and NCCS classify charities according to the National Taxonomy of Exempt Entities, which groups charities into major and minor categories. Education is the most common major category among organizations near the notch, of which many fall into minor categories indicating organizations that support schools. Other charities of this size include religious groups, arts organizations, and athletic leagues. 6To create the Core file, NCCS cross-checks and cleans data from the various IRS databases and from organizations’ 990s
when necessary. NCCS carries out a variety of procedures to check and clean the data. A detailed description of the Core Files and other data is available from the National Center for Charitable Statistics (2006).
7Form 990 contains separate lines for compensation of current officers and directors, former officers and directors, and other
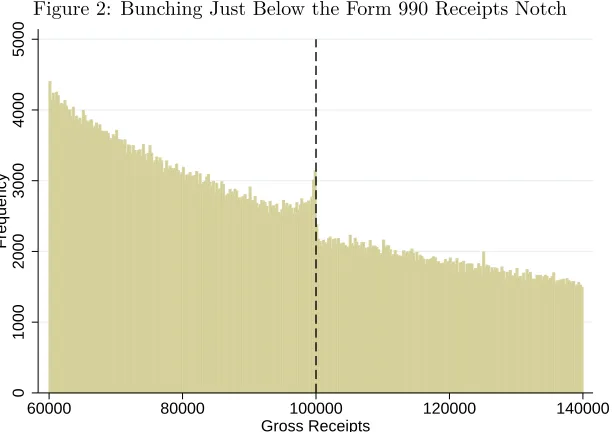
Figures 1 and 2 show that the filing notch binds, and charities bunch below the notch. Figure 1 shows that, for charities with fiscal years that begin in 2007, the probability of filing Form 990 is discontinuous at the receipts notch. Just under half of organizations with receipts just below the $100,000 notch file Form 990-EZ. About 17 percent of firms in this region must file the longer form because their assets are above the $250,000 notch. The others file Form 990 by choice, perhaps to satisfy donors or because they had filed it in the past. The fact that some firms choose to voluntarily file Form 990 suggests heterogeneity in organizations’ cost structures or preferences. Since recordkeeping accounts for much of the estimated cost difference between the two types of filing, organizations that have already made the necessary investment in their administrative capacity would find it less costly to switch to the longer form. Among those with 2007 current receipts below the notch and 2006 receipts above, nearly 80 percent continue to file Form 990. In the empirical analysis I present further evidence that adjustment is a primary component of the compliance cost, with organizations that have previously filed the long form showing little propensity to bunch below the notch. The fact that a considerable share of organizations files Form 990 before reaching the notch should be kept in mind when interpreting results but does not affect the analysis except for the fact that it will not be possible to identify a strictly dominated income region as in the work of Kleven and Waseem (2013).8
This study analyzes income responses to the notch.9 Figure 2 shows a histogram of receipts. The distribution of receipts is smooth except for an excess of mass just below the notch. This excess of mass of bunchers is the object of interest, as supported by the model in the next section. Charities must also file Form 990 if their assets exceed $250,000, but bunching at this asset notch is less conspicuous. Tests suggest a small discontinuity in the density of assets with statistical significance that is sensitive to the choice of bin width. The asset notch is binding for fewer organizations, since roughly 72 percent of charities with assets between $200,000 and $250,000 have receipts over $100,000, and an additional 15 percent in this range file the full Form 990 by choice. I therefore focus on the receipts notch in the model and empirical analysis.
3 Theoretical Framework
To more fully evaluate the welfare effects of adjusting a notch policy I first extend the model to the infinite horizon and incorporate extensive-margin responses. I then incorporate the parameter estimates for the charity reporting notch to quantify the marginal social cost of filing and hence the minimum marginal social 8Charities filing Form 990 by choice are relatively young, rapidly growing, high-expense, and with most receipts in the
category “Contributions, gifts, grants, and similar amounts received.” Variation across states shows no clear pattern; Illinois, Maine, and Pennsylvania have auditing requirements that apply to charities with contributions at levels below $100,000 but do not have a significantly higher share of Form 990 filers.
9If the level of receipts was exogenously determined then Figure 1 could represent the first stage in a fuzzy regression
benefit for which increasing the number of filers would enhance welfare.
This section presents a conceptual framework for using bunching estimates for welfare analysis in static and dynamic settings. The model can be applied generally to income eligibility limits that impose a cost (that is possibly unobserved by the government and econometrician) but is described as a charity reporting notch for concreteness. Policy design weighs the social value of obtaining information through reporting requirements against the costs these requirements impose, including the avoidance costs of organizations that bunch. A static model provides intuition and illustrates the connection between regulatory and tax notches, and a two-period model reveals how dynamic considerations affect the choices of forward-looking agents. The optimal location of the notch is found to depend on the counterfactual density near the notch and the excess bunching mass below it, quantities estimated in other bunching studies to measure the taxable income elasticity.
Static Model
The Charity A charity seeks to maximize expendable net income x. The charity earns receipts (income)
y and reports receipts r:=y−ato the government, where the amounta is kept hidden by tax avoidance
or evasion. The total cost to the charity is the sum of the cost A(y, a, γ, ω) of avoidance and the cost
B(y, ω)of earning the amountyin receipts, whereγ is a vector of parameters describing heterogeneity and ω is a parameter describing heterogeneity in fundraising ability that is unrelated to (but perhaps correlated
with) the cost of avoidance. Assume the cost functions are nondecreasing and convex in y and a and
that Ay(y,0, γ, ω) = 0. This formulation is in keeping with the “general model of behavioral response to taxation” of Slemrod (2001); the cost of avoidance includes both direct psychic or financial costs as well as changes to the expected cost of an audit, and avoidance opportunities may vary with income. The organization must also pay filing cost φ(γ, ω) ifr > ρ, the filing threshold. The budget constraint is thus x≤y−A(y, a, γ, ω)−B(y, ω)−φ(γ, ω)·1{r > ρ}, and the firm’s problem is
max
y,a {y−A(y, a, γ, ω)−B(y, ω)−φ(γ, ω)·1{y−a > ρ}}
If the filing constraint does not bind then optimal avoidance is zero, and the first-order condition
By(y, ω) = 1 defines the optimal value of receipts y¯(ω)as that level of fundraising at which the marginal cost of raising one dollar has reached one dollar. Becausey¯(ω)plays an important role throughout the
anal-ysis, from this point I simply describe fundraising heterogeneity in terms ofy¯. There will be a one-to-one
relationship betweeny¯ and ω if dωdy¯ =−Byω(y,ω)
Byy(y,ω) >0, implying that the inverse functionω(¯y). I therefore
If the filing constraint does bind, i.e. optimal reported income isr=ρ, theny−a=ρ, and the problem
becomes
max
y {y−C(y, y−ρ, γ,y¯)}
In this case the first-order condition gives Cy(y, a, γ,y¯) = 1−Ca(y, a, γ,y¯). Receipts fall short of y¯ because marginal earnings increase the necessary amount (and therefore cost) of avoidance. Call the level of receipts that satisfies this conditionyˆ(γ,y¯), which I will generally write simply as yˆ.
When will the charity bunch at the reporting threshold? If y¯≤ρthere is no need to misreport. Ify > ρ¯
then the charity obtains yˆ−C(ˆy,yˆ−ρ, γ,y¯) if it reports r = ρ and y¯−C(¯y,0, γ,y¯)−φ(γ,y¯) if it does
not. The charity will therefore bunch if and only if φ(γ,y¯) ≥ (¯y−yˆ)−[C(¯y,0, γ,y¯)−C(ˆy,yˆ−ρ, γ,y¯)].
Because costs are convex we can define δ(ρ, φ, γ,y¯) as the maximum difference (possibly zero) between y¯
andρfrom which the organization would be willing to chooser=ρ. That is, a charity bunches at the notch
ifρ <y¯≤ρ+δ(ρ, φ, γ,y¯). Again simplifying notation, I will suppress the arguments ofδ.
Reported receipts are
r= ¯
y y¯≤ρ
ρ ρ <y¯≤ρ+δ
¯
y y > ρ¯ +δ
The charity obtains indirect utility
V(ρ, φ, γ,y¯) =
¯
y−C(¯y,0, γ,y¯) y¯≤ρ
ˆ
y−C(ˆy,yˆ−ρ, γ,y¯) ρ <y¯≤ρ+δ
¯
y−C(¯y,0, γ,y¯)−φ y > ρ¯ +δ
Note that ρenters directly for bunchers but not others. This implies that changes to the location of the
threshold will have first-order effects on the utility of inframarginal bunchers (but not others).
density function (pdf)f(¯y). The heterogeneity parameterγhas pdf g(γ). Social welfare per firm10is
W =
Z Z ∞
0
V(ρ, φ, γ,y¯)f(¯y)dy¯+
Z ∞
ρ+δ
π(φ, γ,y¯)f(¯y)dy¯
g(γ)dγ
=
Z Z ∞
0
(¯y−C(¯y,0, γ,y¯))f(¯y)dy¯+
Z ∞
ρ+δ
(π(φ, γ,y¯))f(¯y)dy¯
−
Z ∞
ρ+δ
φ(γ,y¯)f(¯y)dy¯+
Z ρ+δ
ρ
[ˆy−y¯−(C(ˆy,yˆ−ρ, γ,y¯)−C(¯y,0, γ,y¯))]f(¯y)dy¯
#
g(γ)dγ
With the social welfare function written as the sum of these four terms, one can immediately see how policy will affect social welfare. Policy-makers can influence two parameters, the location of the notch and the cost of reporting. Increasing the amount or complexity of information reported on the long form will increaseφ. From terms two and three one sees that this will directly increase welfare to the extent that this
new information is of net social benefit but will reduce the number of number of charities filing the long form. The choice of how much detail to require in financial reports is therefore similar to optimal screening of social benefits under imperfect takeup because greater complexity has direct benefits but may reduce participation (Kleven and Kopczuk, 2011). I will not attempt to estimate the social value of reporting.11 It turns out, however, that the optimal location of the threshold depends on estimable quantities analogous to those studied in the tax bunching literature. Marginal changes toρwill affect all but the first term in the social
welfare function, but marginal bunchers (withy¯=ρ+δ) experience no first-order utility changes due to the
indifference condition φ(γ,y¯) = ((ρ+δ)−yˆ(ρ+δ))−[C(ρ+δ,0, γ,y¯)−C(ˆy(ρ+δ),yˆ(ρ+δ)−ρ, γ,y¯)]
and indifference for those withy¯=ρ. After using the indifference conditions to cancel terms,
dW dρ =
Z "Z ρ+δ
ρ
Ca(ˆy(¯y),yˆ(¯y)−ρ, γ,y¯)f(¯y)dy¯
#
g(γ)dγ−
Z
(1 +δρ)π(ρ+δ, φ, γ,y¯)f(ρ+δ)g(γ)dγ
Raising the threshold has two counteracting effects. First, charities that were bunching achieve some savings because they no longer have to avoid reporting as much income. Second, raising the threshold reduces the amount of information available to the extent that previously-indifferent charities now bunch at the threshold.
10Donor utility is excluded from the social welfare function, as recommended in research on optimal taxation of charitable
giving (e.g., Andreoni (2006), Diamond (2006)). In addition to their arguments there is evidence that fundraising reduces the utility of the average prospect (DellaVigna et al., 2012).
11Potential benefits would include reductions in avoidance/evasion on other margins. Examinations of tax-exempt
The expression for the welfare effect of moving the notch becomes simpler when written it terms of averages in the region from which bunching occurs. The main identifying assumption in bunching estimation is that bunching is local and there exists someδ¯=max(δ(ρ, φ, γ,y¯)). The localness assumption restricts the
degree of heterogeneity and would hold, for example, if there is anM >0such that for allγ,y¯andywe have Ca(y,0, γ,y¯)≥M. Denote the excess mass observed below the notch as B :=R
h Rρ+δ
ρ f(¯y)dy¯
i
g(γ)dγ=
b F ρ+ ¯δ
−F(ρ), where
b is the share of organizations in the reduced region that choose to bunch.
Assume that db dρ ≈ 0,
d¯δ
dρ ≈ 0, and ∃π¯ : π(φ, γ, ρ+δ) ≈ π¯∀γ,y¯ ∈ [ρ, ρ+δ]. In words, slight movements of the notch have little effect on the share of organizations that bunch or the maximum amount by which they will reduce income, and all reports from organizations have roughly the same social value. The first two assumptions are effectively the same as the simplifications common in the taxable income bunching literature, while the third is useful here due to the potential heterogeneity in the social value of reporting.
The simplifying assumptions make it possible to rewrite the term describing the welfare effect of lost reports as −¯π
bf ρ+ ¯δ
+ (1−b)f(ρ).12 That is, the value of long forms lost is the product of their
average value and the change in the share of charities that bunch. Under the simplifying assumption that bunching is proportional to mass in the reduced range, the change in the share of charities that bunch is the weighted average of the values taken by the underlying density at the top and bottom of the reduced range. The welfare criterion for the optimal location of the notch is thus
dW
dρ ≥0⇔
¯
π
E[Ca(ˆy,yˆ−ρ, γ,y¯)|ρ <y¯≤ρ+δ]
≤ F ρ+ ¯δ
−F(ρ) bf ρ+ ¯δ
+ (1−b)f(ρ) (1)
The expression for the welfare effects of moving a regulatory notch includes factors comparable to those arising from the choices of marginal income tax and VAT rates studied in the literature. When administrative costs increase with the number of covered firms, the optimal income exemption threshold for a value-added tax will induce bunching if the revenue effects are small (Dharmapala et al., 2011). The net benefit of reporting ¯πplays a role similar to that of tax revenue, although this benefit may vary across organizations
(as reflected in the fact that only larger organizations, for which compliance costs are likely to be lower, are required to file the long form). The expression on the right-hand side of the inequality is a version of the ratio that arises in other bunching studies that are motivated by the problem of setting marginal tax rates. The existing literature uses the relationshipb F ρ+ ¯δ
−F(ρ)
=B ≈bδf¯ (ρ)to back out an estimate of ¯
δfrom estimates of the counterfactual distribution and excess mass. Kleven and Waseem (2013) estimate a
12
−R[(1 +δρ)π(φ, γ, ρ+δ)f(ρ+δ)]g(γ)dγ≈ −¯πR[(1 +δρ)f(ρ+δ)]g(γ)dγ= π¯R h
d dρ
R∞
ρ+δf(¯y)dy¯ i
g(γ)dγ=
¯ πRhd
dρ
1−Rρρ+δf(¯y)dy¯− Rρ
−∞f(¯y)dy¯
i
g(γ)dγ= ¯πRhd
dρ 1−b F ρ+ ¯δ
−F(ρ)−F(ρ)
i
g(γ)dγ=
¯ πhd
dρ 1−b F ρ+ ¯δ
−F(ρ)−F(ρ)
i
=−¯πhd
dρ bF ρ+ ¯δ
+ (1−b)F(ρ)
i
=−¯π bf ρ+ ¯δ
parameter similar tobby using the known amount of a tax to identify a strictly dominated region just above
the notch, taking those that remain in this region as the share that cannot bunch. I do not observe the exact reporting costs, which I expect to exhibit heterogeneity, and will instead use dynamic techniques to estimate
b. Because b is small and the density is not very steep at the notch, I have followed the practice in other
bunching studies and report the bunching ratio as the ratio of excess mass to the value of the counterfactual distribution at the notch (rather than the weighted average).
It is far more difficult to estimate the marginal avoidance cost Ca(ˆy,yˆ−ρ, γ,y¯). The distribution of reported income reveals income responses, but the cost of these responses is not identified without another source of variation. Though the marginal benefits of real and avoidance responses are equated (per the first-order condition) and have the same implications in the model (as is generally true unless externalities or other considerations are incorporated), evidence of avoidance is useful in at least two respects. First, relative to a world in which avoidance was prohibitively costly, evidence of avoidance would indicate a lower total cost of manipulating income to stay below the notch, making it less desirable to raise the notch to a higher level of receipts. Second, the extent of avoidance affects inference of the agents’ preferences. The amount by which a charity reduces reported receipts in order to bunch provides an upper bound on willingness to pay to avoid reporting because avoidance allows the organization to pay less than the full amount of this reported income reduction. The bound approaches the true value of willingness to pay as the marginal cost of avoidance approaches one.
Two Period Model
Individuals and firms often face the same notch repeatedly. Extending the model to two periods reveals that the behavior of forward-looking agents will generally differ from the static version of the problem, muddling the interpretation of static bunching estimates.
Suppose an agent lives for two periods and in each period faces the problem described above. Let
f(¯y2|y¯1, y1), the density of optimal income in the second period, depend on optimal or chosen income from
the first period. For example, if a charity contacts more potential donors in a given year then donations for both that year and the following year are likely to increase. The solution to the problem in period 2 will have the form shown above. LetV2(ρ, φ,y¯2)denote the value of the objective achieved in year 2. The problem in
V1(ρ, φ) =max y1
βEV2(ρ, φ,y¯2) +
y1−C(y1,0) y1≤ρ
y1−C(y1, y1−ρ) ρ < y1≤ρ+δ
y1−C(y1,0)−φ y1> ρ+δ
The first-order condition is now
0 =β d dy1
EV2(ρ, φ,y¯2) +
1−Cy(y1,0) y1≤ρ
1−Cy(y1, y1−ρ)−Ca(y1, y1−ρ) ρ < y1≤ρ+δ
1−Cy(y1,0) y1> ρ+δ
If d
dy1EV2(ρ, φ,y¯2) = 0then the solution is exactly as in the static setting. In general this will not be the
case if d
dy1f(¯y2|y¯1, y1)= 06 , becauseEV2(ρ, φ,y¯2)is increasing iny¯2. If we assume that
d
dy1EV2(ρ, φ,y¯2)>0
then the optimal value ofy1 will be greater than in the static case because it will be worth losing money on
the last marginal dollar raised in period 1 in order to increase expected earnings in year 2.
Importantly for research, facing a notch more than once will also generally affect the amount of bunching. For example, consider a charity that only lives for one year and has potential income y¯=ρ+δ, making it
indifferent between bunching and not bunching. If bunching is not achieved entirely by avoidance than this charity earns a higher income if it doesn’t bunch than if it does bunch. If the charity were to then learn that it would live for another period and that income in this second period would be increasing in income earned in the first period then bunching would now be strictly dominated. In this case, δ becomes smaller and
bunching decreases. If agents know or believe that income is persistent then estimates of bunching cannot be interpreted as the solution to a static problem, and this may explain small estimates in the literature.
Infinite Horizon With Extensive-Margin Responses
Now I expand the model to enable welfare calculations for the empirical setting. Charities are able to exist in perpetuity and to temporarily leave the sample to avoid compliance costs. To simplify exposition slightly I describe the case of homogeneous bunching (b = 1). Let f(y) = R
f(¯yt|y¯t−1, yt−1)g(γ)dγ and
F(y) =R
F(¯yt|y¯t−1, yt−1)g(γ)dγ denote the aggregate distribution of incomes.
Suppose the cost of going missing from the sample for a year (net of not filing, if charities are actually not filing versus filing late) isµi ∈(−∞,∞), and this cost varies across charities with cumulative distribution
H(µ). It will be assumed, based on the empirical results, that this cost is only negative for charities with
fact that the distributionH(µ)will therefore depend onyt−1 will be suppressed for notational convenience.
Two implications follow directly. First, if a charity grows to an income level above its reduced range then it will go missing with probabilityH(0). Second, if we denote △:=−1 [ˆy−C(ˆy,yˆ−ρ)−(¯y−C(¯y,0)−φ)]
then the probability of going missing when growing to the reduced range(ρ, ρ+δ)isH(△).
The dynamic-programming formulation of the charity’s problem (with discount factorβ) is
V0(ρ, φ, γ) =max y,a
(
y0−C(y0, a0, ω)−φ(γ, ω)·1{y0−a0> ρ}+
∞
X
t=1
βtEV (ρ, φ, γ)
)
=max
y {1{y¯0< ρ}(¯y0−C(¯y0,0, γ,y¯0)) + 1{y¯0≥ρ+δ}(¯y0−C(¯y0,0, γ,y¯0)−φ(γ,y¯0)−1{µ <0}µ)
+1{ρ≤y¯0< ρ+δ}[1{µ≥ △}(ˆy0−C(ˆy0,yˆ0−ρ, γ,y¯0)) + 1{µ <△}(¯y0−C(¯y0,0, γ,y¯0)−φ(γ,y¯0)−µ)]
+ ∞ X t=1 βt Z ρ 0
(¯yt−C(¯yt,0, γ,y¯t))f(¯yt)dy¯t+ ∞
X
t=1
βt Z ∞
ρ+δ
(¯yt−C(¯yt,0, γ,y¯t)−φ(γ,y¯t)−1{µ <0}µ)f(¯yt|y¯t−1, yt−1)dy¯t
+
∞
X
t=1
βt Z ρ+δ
ρ
[1{µ≥ △}(ˆyt−C(ˆyt,yˆt−ρ, γ,y¯t)) + 1{µ <△}(¯yt−C(¯yt,0, γ,y¯t)−φ(γ,y¯t)−µ)]f(¯yt|y¯t−1, yt−1)dy¯t
)
As in the static model, raising the level of the notch has a first-order effect on utility when bunching:
d
dρV (ρ, φ, γ) = 1{ρ≤y¯0< ρ+δ}1{µ≥ △}(Ca(ˆy0,yˆ0−ρ, γ,y¯0)) + d dρ
∞
X
t=1
βtEV(ρ, φt, γ)
= 1{µ≥ △}
"
Ca(ˆy0,yˆ0−ρ, γ,y¯0) +
∞
X
t=1
βt Z ρ+δ
ρ
[(Ca(ˆyt,yˆt−ρ, γ,y¯t))]f(¯yt|y¯t−1, yt−1)dy¯t
#
The cost of raising the level of the notch is again the lost social benefit from forms no longer filed. Let Q(
ρ) = 1{µ≥0}π
∞
P
t=1
h
1{y¯0≥ρ+δ}+βtR
∞
ρ+δπf(¯yt|y¯t−1, yt−1)dy¯t
i
be the present value of in-formation benefits, where π is now assumed to be constant for simplicity. Also, define parameter ηh =
F(ρ+δ|yt=ρ)t+h−F(ρ+δ|yt=ρ+δ)t+h, the effect of bunching today on the probability of bunching
hyears in the future. Assume for simplicity that ∀h, ηh =η, i.e. that this effect is constant over horizon, consistent with the empirical results for this setting.
There are now two discrete responses to consider for their potential externalities. The first is the fact that increasingρcauses previously-indifferent organizations (y¯=ρ+δ) to bunch. This affects these organizations’
effect is that some organizations that would go missing will instead bunch, making them candidates to instead go missing the following year. For simplicity I will ignore the second effect because it will involve very few organizations and will result simply in retiming of when the organization goes missing. With this simplification, the information cost of increasingρis
d dρ
Y
(ρ) = 1{µ≥0}π
∞
X
t=0
βt "
−1− ∞
X
s=1
βsη #
f(ρ+δ|y¯t−1, yt−1)
=−π·1{µ≥0}f(ρ+δ|y¯t−1, yt−1)
1−β+ηβ
(1−β)2
Combining the direct effect on charities and the indirect effect on the number of forms gives the total effect on social welfare. Assuming that the income distribution is not changing over time and that the cost of missingη is uncorrelated withy¯gives
dW dρ =
Z d
dρV (ρ, φ, γ) + d dρ
Y
(ρ)
g(γ)dγ
= (1−H(△)) 1
1−β (F(ρ+δ)−F(ρ))E[Ca(ˆy,yˆ−ρ, γ,y¯)|ρ <y¯≤ρ+δ]−π(1−H(0))f(ρ+δ)
1−β+ηβ
(1−β)2
dW
dρ ≥0⇔
π
E[Ca(ˆy,yˆ−ρ, γ,y¯)|ρ <y¯≤ρ+δ]
≤ 1−β
1−β+ηβ ·
1−H(△) 1−H(0) ·
F ρ+ ¯δ
−F(ρ) f ρ+ ¯δ (2)
Comparison of 2 with 1 (with the simplifying assumption b = 1) shows how the dynamics and missing
observations affect the welfare analysis. The left-hand side of the inequality is still the ratio of social benefits from forms filed to the marginal cost of bunching, and the right-hand side still includes the bunching ratio. The two new terms on the right-hand side highlight the importance of dynamics and missing observations, respectively. First, the right-hand side is decreasing inη, the persistence of bunching. If bunching is highly
persistent then there will be a more narrow range of values ofπfor which the government should raise the level
of the notch because the marginal bunching this will induce will have persistent effects and hence a greater cost in present value. The right-hand side is increasing in 1−H(△)
1−H(0), the ratio of non-missing organizations in
benefit many non-missing charities in the reduced range and induce fewer non-missing charities just above the reduced range to bunch.
4 Empirical Analysis
4.1 Static Estimates and Non-causal Evidence of Repeated Bunching
For completeness, I first present results of standard techniques. Figure 3 (also presented by Marx (2018)) provides an example of the standard approach to bunching estimation. Income is binned, and the counter-factual income distribution is estimated as a polynomial through bin counts outside of the omitted range around the notch. Compared to this counterfactual, the actual bin counts reveal excess mass just below the notch and a reduction just above. This shift can be interpreted as a response by charities because unilat-erally determine how much income to report, unlike labor supply outcomes that may depend on strategic interactions of workers and firms (Chetty et al., 2011).
Estimation results will be provided later for comparison with the dynamic bunching estimates. Marx (2018) shows that the estimates from the standard approach are not reliable. One reason for this is extensive-margin responses, which are assumed away by the standard approach. Consistent with extensive-extensive-margin responses, the estimated reduced mass above the notch is significantly larger than the estimated excess below the notch, consistent with the extensive-margin responses estimated later. Another concern is that charities faced the same notch every year, which Marx (2018) shows to be problematic for bunching estimation if bunching in one year reduces income in later years. One way that this can happen is if agents bunch repeatedly.
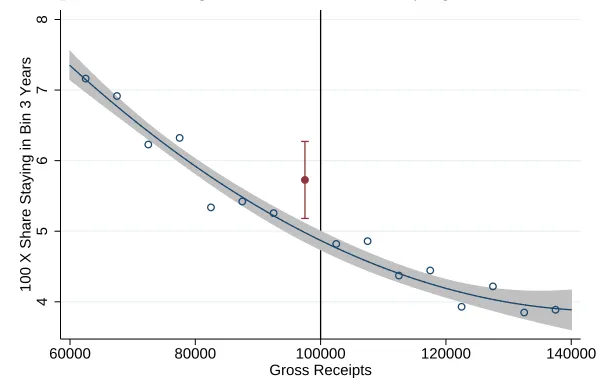
A common technique with panel data can provide suggestive evidence of repeat bunching. If charities bunch repeatedly then those currently in the bunching range should have a heightened probability of remain-ing in that range. Figure 4 shows the probability of remainremain-ing within a $5000 receipts bin three years into the future. This probability varies smoothly with receipts except just below the notch. Among observations in the bin just below the notch, about 5.7 percent remain in the same bin, compared to an interpolated counterfactual prediction of only 5 percent.
To estimate repeated bunching within the static framework I again construct bins of current receipts. I then estimate the probability that inhyears an organization remains in its current bin as
pi,t+h=β·bunchbini+ K
X
k=1
of each bin isbw and bunchbini = 1{rit∈[notch−bw, notch)} is an indicator for having current receipts in the bunching range, PK
k=1
αkritk is again a polynomial in receipts that provides the counterfactual for the bunching range, andγtis a vector of year dummies.13
Table 3 reports the results from estimating regression 3 for horizons up to 10 years. I find that charities bunch just below the reporting notch for many years. Observations in the bin just below the notch are about 1.55 percentage points more likely to remain there the following year than would be predicted by surrounding observations. This excess probability of staying in the same range of income declines over time but remains significantly positive for at least five years. Bunching is persistent, suggesting the proclivity to bunch is much stronger in some organizations (the repeat bunchers) than others.
Evidence that charities in the bunching region have a heightened probability of remaining there does not indicate whether they remain because they continue to bunch or because it is slow-growing charities that bunch in the first place. Similarly, one might hypothesize that low-expense charities are most likely to bunch and that when charities bunch they must reduce their expenses to balance the budget. Alternative methods are needed to estimate the causal effect of approaching the notch and to separately estimate heterogeneity in the bunching response and concurrent responses in other variables that may correlate with bunching.
4.2 Temporary Notch – Permanent Effects on Growth
Variation in the IRS reporting notch for public charities makes it possible to estimate effects of a temporary notch. After decades with a notch at a nominal value of $100,000, the notch was moved to $1,000,000 for 2008, $500,000 for 2009, and $200,000 thereafter. The 2008 and 2009 notches were therefore only temporary (one-year) phenomena that should not have induced repeated bunching or manipulation at incomes far from the level of the notch. I exploit this temporary nature, focusing on the 2009 notch, which fell at an income level with many more charities.
Denote bynear2009notchian indicator for the treatment group of charities in the bin of 2009 log receipts that straddles the notch. I assign each charity i to an equally-sized bin of 2009 log receipts bin2009i and estimate simple equations of the form
E(Yit|bin2009i) =β·near2009notchi+ J
X
j=1
αjbin2009ji (4) The second term is a polynomial in bin level that provides a counterfactual for the level that should be 13Since crossing the notch requires a positive growth rate, one could alternatively nonparametrically regress the probability
expected in the near2009notchi bin.14 The parameter β therefore describes the deviation of the average deviation from conditional expectation among charities in the omitted region around the notch. Outcomes
Yitcan include functions of receipts in 2009 to identify and measure the bunching response, but also variables measured in earlier years as a test of the assumption that charitiesnear the 2009 notch are not a selected sample, as well as variables measured in later years to test for long-term effects of one-time bunching.
I examine three different measures of income. The first is simply the level of (log) receipts, which is expected to be negatively affected in 2009 by the opportunity to bunch. The second, labeled “Cross 2009 Threshold,” is an indicator for whether the organization’s current receipts are above the level corresponding to the notch. This dummy variable indicates that the charity has receipts greater than .065 plus the level of the minimum income in the bin that it occupies in 2009, since the minimum income in the treatment bin is .065 log points below the notch. Bunching should also have a negative effect on the probability that treated observations cross the 2009 threshold in 2009. Finally, I construct an indicator for current receipts that lie within the same bin that the charity occupies in 2009. This dummy takes the value of one for all observations in 2009 but provides another useful measure of pre-trends or long-term effects.
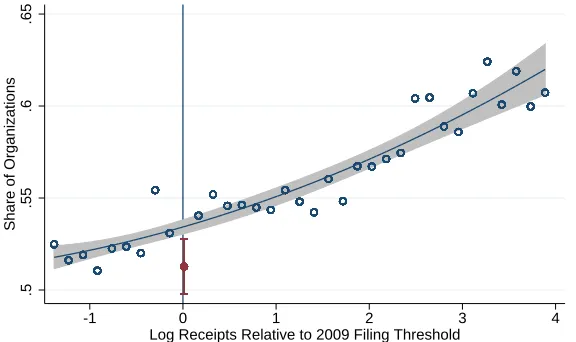
Figure 5 plots the results of one of the regressions. Data are binned by log receipts in 2009 (relative to the temporary notch), and the outcome is the share of organizations in each bin that “Cross 2009 Threshold” in 2010. The counterfactual estimated from the control bins away from the notch indicates that close to 54 percent of the organizations in the treatment bin straddling the temporary notch should have had receipts above $500,000 in 2010. The share that actually achieved this size was closer to 52 percent, and confidence intervals on the counterfactual and observed share indicate that this result is statistically significant.
Results of the temporary-notch regressions appear in Table 4 (also presented by Marx (2018)). Each cell of the table reports the estimate of the parameter β for a different outcome and year. In the first
row the outcome is log receipts, which is negatively impacted in 2009, as expected. The coefficient for this year implies that the average charity near the notch reduces income by .003 log points, or roughly $1500 ($500,000*.003). Estimated deviations from expectation are negative for subsequent years, but standard errors are large because, as will be seen later, the distribution of year-over-year income growth has fat tails. The alternatives income measures, which focus on more central growth rates, can therefore offer more-precisely-estimated evidence. In the second row, one can see that the probability of being above the notch in 2009 is reduced by 10.1 percentage points among the treatment group. These charities are not significantly 14The results depicted in this section are obtained with a simple quadratic function of bin level, and range starting at receipts
different in this regard prior to 2009, but bunching in 2009 appears to cause a permanent 2 percentage-point reduction in the probability that treated charities ever achieve receipts greater than $500,000. Similarly, the third row shows that while these charities were no more or less likely to be in their 2009 income bin in years before 2009, the probability that they remain in this bin (rather than growing out of it) is permanently increased by at least .4 percentage points.
Permanent effects of a temporary notch provide strong evidence that manipulation is not entirely carried out by misreporting income. Simple underreporting of income would have no effect on income in later years, when there was no reason to underreport, and retiming of income would actually increase earnings in 2010. The results are not sufficiently precise to fully rule out some misreporting, but there does appear to be some permanent, monetary cost associated with bunching. The finding of the temporary notch affecting real income is consistent with the evidence that follows for the permanent notch that was in place for all sample years before 2008.
4.3 Dynamic Ordinary Least Squares – Repeated Bunching and Heterogeneity
The OLS dynamic bunching design shows that measures of income manipulation are highly significant for charities moving to a bin surrounding the notch. Manipulation occurs only among those not already filing Form 990 and is less common among larger charities. Short-run income manipulation by charities with administrative staff provides suggestive evidence of avoidance behavior, but the notch also has long-run effects on growth.
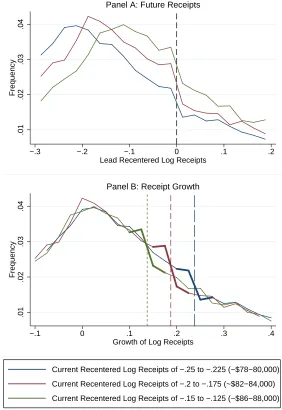
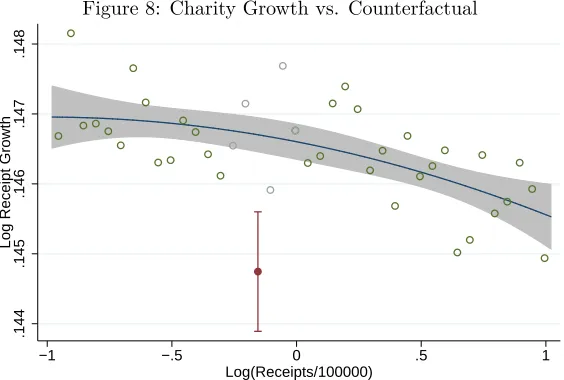
Figure 6 provides visual evidence supporting the dynamic identification strategy. As was the case in the PSID data, growth distributions do not vary dramatically across levels of base-year receipts. Since the notch falls at different levels of growth for these different levels of base-year receipts, the distortions induced by the notch can be identified by comparison with growth distributions from other base-year levels.
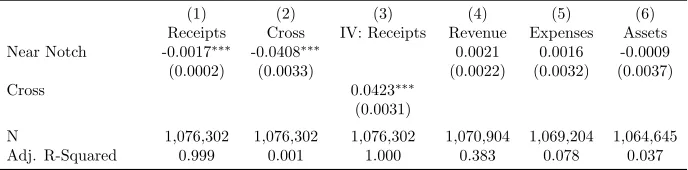
Regression analysis shows highly significant manipulation of receipts.15 In column (1) of Table 5 we see that receipt growth of charities nearing the notch is reduced by .0017 log points. The average reduction is therefore about 0.17 percent of $100,000, or $170. The average is taken over all charities nearing the notch, whether they bunch or not. In column (2) we see that the probability of achieving growth that would imply crossing the notch is reduced by four percentage points. This regression of crossit on near notchit and controls is also the first stage of an instrumental variables estimate of receipt manipulation by bunchers themselves, the second stage of which is presented in column (3). The identifying assumption of the IV specification is that receipt growth of charities in the group approaching the notch only deviates from the 15I present specifications with a full set of growth range dummies and the interactions of each growth rate bin with a quadratic
counterfactual due to their responses to keep receipts below the notch. The IV results show that the average buncher reduces reported receipts by .0423 log points, or about $4500. Unfortunately, the expense and asset growth outcomes that might signal the extent of avoidance are not precisely estimated; standard errors are larger than the direct effect of the notch on receipts, and underlying growth rates for these variables are similar to that of receipts. Such regressions may prove more informative in settings where more data are available or growth rates are less variable.
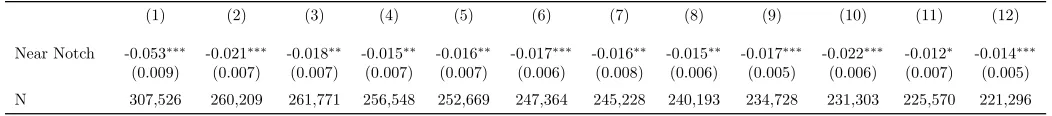
Next I estimate the effect of the notch on long-run growth. Table 6 (also presented by Marx (2018)) displays the results of 12 regressions for the probability of crossing the notch in t years. The results show
that the notch reduces crossing by about 1.5 percentage points for over a decade. The reduction in crossing is relative to the counterfactual share that should cross (not shown), which grows from 40 percent in year one to a bit over 75 percent in year ten.
In addition to these average responses, the dynamic estimation strategy provides illuminating tests for heterogeneity in responsiveness. Table 7 shows that smaller organizations are more likely to reduce income to stay below the notch. The outcome for each regression is the indicator variablecrossit. Interactions of total revenue, expenses, and assets (all in logs) withnear notchitreveal that larger charities are more likely to cross the notch when approaching it, i.e. less likely to reduce income to avoid crossing. The magnitude of the coefficients implies that a one percent increase in a charity’s expenses or assets is associated with about a 1.5 percentage point (2.5 percent) reduction in the probability of manipulating receipts when approaching the notch in the next year. Including all of these variables and their interactions eliminates the predictive power of total revenue but leaves expenses and assets as highly significant determinants of bunching. The fact that large organizations are less likely to bunch supports the idea that the long form imposes administrative expenses, some of which are likely related to transitioning to an accounting infrastructure that facilitates detailed financial reporting.
are not just more likely to file Form 990 before required but are less likely to manipulate income to stay below the notch even if they previously filed Form 990-EZ.
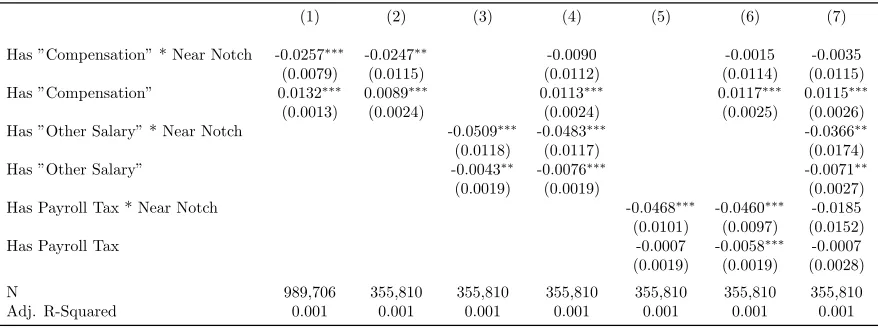
The final dimension of heterogeneity for which I present results is staffing. Charities with paid staff may be less willing to file Form 990 and more able to manipulate income to avoid filing the longer form. Unfortunately, the data do not include the staffing line item for charities filing Form 990-EZ. To examine heterogeneity by future staffing I restrict attention to charities that have receipts above the notch at some point in the sample. The data include Form 990 staffing variables “Compensation” (for officers and directors), “Other Salary” (for others), and “Payroll Taxes.”16 The regression results in Table 8 reveal how staffing variables and their interactions with near notchit predict manipulation according to the outcome crossit. Charities with paid administrative staff, whether measured by “Other Salary” or “Payroll Taxes,” are less likely to cross the notch when they first approach it. This result provides suggestive evidence that while the notch was found to have permanent effects on some charities’ growth it also leads to some temporary avoidance. I deem these results “suggestive” because the notch was shown to have permanent effects on the share crossing, which implies that the sample of charities that eventually cross may be selected based on characteristics related to the staffing variables.
A few other covariates suggest variation in the incentives or ability to bunch. These results are available by request. First, if assets are above $250,000 then the organization must file Form 990 regardless of receipts level. Only charities below the asset notch would be expected to bunch, and this is confirmed in regression analysis (though this does not eliminate the heterogeneity by size presented in Table 8). Other financial variables that appear with the same wording on both forms include fundraising event income and inventory sales, neither of which predicts bunching. It is also possible to test for disclosure costs, albeit imperfectly, by examining whether some information that appears on Form 990 and not Form 990-EZ predicts bunching. As with the staffing variables, these measures must be defined in years that charities file the long form. Using the value of each variable in the first year after a charity crosses the notch, I find no evidence that charities avoid filing in order to conceal fundraising expenses or sources of business income unrelated to the charitable purpose. The cost of disclosing other variables appearing on the long form, including personal benefit contracts and controlled entities, could not be tested because these variables are not captured in the data.
In summary of the OLS and IV results, I find significant manipulation of income when nearing the notch. Consistent with adjustment costs, large charities and those that filed Form 990 previously are less likely to avoid being above the notch. Short-term manipulation by charities with administrative staff suggests 16Just under half of the estimation sample has “Other Salary” when above the notch, and median Other Salary is between
avoidance, but the notch also has significant effects on growth in the long run. I do not find evidence that charities reduce income to avoid disclosing other information but do not have sufficient data to completely rule out this possibility.
4.4 Dynamic Maximum Likelihood Estimation – Bunching and Extensive-Margin
Responses
I estimate several quantities using maximum likelihood. The bunching sharebis identified by comparing the
observed distribution of growth rates to the counterfactual distribution. I allow this bunching parameter to take a different value for charities coming from below the notch than for charities already above the notch. I also use the estimated bunching shares and the counterfactual distribution of growth to calculate the excess mass that is observed in the bunching range in the next year and the reduction in the mass above the notch. Finally, I report the extent of the extensive-margin response, which I calculate separately for charities that should grow to the range of income from which some choose to bunch and for incomes above this range.
Attrition is common in the charity data. Attrition could be due to late filing, earning income below the level at which filing is required, shutting down, merging, or simply non-compliance. I estimate three types of attrition. First, I include polynomials in base-year income below and above the notch to capture basic, random attrition. Second, I adjust the observed conditional growth densities to account for truncation of the sample due to the fact that agents with income below $25,000 do not have to report. Third, I allow for the extensive-margin responses that reduce the share of observations that grow to income levels above the notch. Further details of the estimation are provided in Online Appendix B.
Figure 9 illustrates the approach as well as the goodness of fit. The figure is populated using an illustrative group of charities with base-year receipts just below the notch. The empirical distribution of growth rates is non-Normal, with a sharper peak around zero growth and fatter tales, thus requiring a flexible approach to fit. Fitting is done with observations outside of the omitted range of growth rates that would bring these charities close to the notch. The fit is good outside of the omitted range, while inside the range the bunching response leads to a shift of mass from positive growth rates that would cause charities to cross the notch to nonpositive rates that keep them below it. The extent of this downward shift identifies the bunching response.
between the static estimates of the excess mass below the notch and the reduced mass above the notch. The top panel of Table 9 shows dynamic bunching estimates of parameters governing bunching and systematic attrition. The first parameter estimate gives the bunching propensity among charities that have current, base-year receipts below the notch. For the current notch, an estimated 4.8 percent of the charities that should grow from an income level below the notch to a new level above it in each year will instead reduce reported receipts to stay below the notch. The second row shows the bunching propensity for those with current receipts above the notch, which is still significant but considerably smaller for both the past and current notch. Charities coming from above have already filed Form 990 and have less incentive to bunch if the marginal cost of filing is largely a one-time adjustment cost. The infrequency of bunching by charities coming from above the notch is consistent with (unreported) results from OLS dynamic estimation.
The third and fourth rows in the table show that attrition is significantly related to the notch. The estimated parameters indicate the share of charities that should be crossing the notch from below but instead go missing from the sample. To allow for flexibility and avoid bias in the bunching estimates, the attrition rate is estimated separately for those that should barely cross the notch (into the reduced range) and those that should grow to an even higher level of income. Both estimates are economically and statistically significant for the historical notch, with close to ten percent of these growing charities leaving the sample. Comparing the attrition and bunching propensities, a combined 10.6 percent of charities avoid filing when first crossing the notch to the reduced range, and the number of charities doing so by bunching is dwarfed by the number responding on the extensive margin. Bunching became more common and extensive-margin responses became less common when the reporting threshold increased to $200,000, perhaps because attaining higher incomes levels increases the perceived risk of not reporting. The static approach, which assumes away extensive-margin responses, does not provide estimates of any of these parameters in the top panel of the table.
bunching lead to a reduction in mass everywhere above the notch, not just in the reduced range. The effect on the density above the reduced range introduces bias into the static estimate of the counterfactual, which assumes that the density above the reduced range is unaffected. The excess mass just below the $200,000 notch is comparable to that at the old notch. The decline in extensive-margin responses has brought the reduction of mass from the range just above the notch closer to the level of excess mass below it, but the reduction remains significantly greater.
Finally, the bunching ratio gives the ratio of excess bunching mass to the counterfactual density at the notch, here reported for the density in levels so that the ratio can be interpreted as a dollar amount. Standard, static bunching estimation would lead the researcher to conlcude that the average charity reduces income by $753 to bunch to avoid filing Form 990. In contrast, the dynamic estimate for the $100,000 notch indicates that the average charity was only willing to reduce income by about $400. Compared to this dynamic estimate, the static estimates of the excess mass and bunching ratio are biased upwards by roughly ninety percent. The final column of the table shows the dynamic estimate of the amount of bunching when the notch moved to $200,000. The excess mass remained about the same despite a much smaller density at the new level of the notch, and so the estimated bunching ratio doubled to $934. The difference may be due in part to differences between charities at different income levels, but one would also expect that charities should now be willing to reduce income by an even greater amount, given that the notch was moved to a higher income level precisely because the form was made more onerous.
4.5 Donut RD – Duration of Extensive-Margin Responses
and statistically insignificant. It appears, therefore, that charities crossing the notch go missing temporarily but eventually return to the sample. Consistent with this interpretation, the estimated number of years missing from the sample is elevated by .035. Dividing this estimate by the 2.3 percentage-point difference in the share going missing indicates that extensive-margin responders are leaving the sample for 1.5 years on average.
4.6 Welfare Implications of Parameter Estimates
The dynamic bunching methodology provides estimates of the key parameters for evaluating the welfare consequences of adjusting the notch. These key parameters, as shown in 2, include the increased likelihood of bunching in future years if bunching now (η), the share of observations missing from the reduced region
(H(△)), the share of observations missing from above the reduced region (H(0)), and the bunching ratio
of excess mass to density at the notch. The bunching ratios for the historical notch and the current notch have already been shown in Table 9, as have the shares of missing observations. Because the attrition rate for charities moving to the reduced region was not very different from the attrition rate among those moving to higher incomes, the adjustment for missing observations turns out not to affect the welfare calculation much. In contrast, recognizing the persistence of bunching makes a considerable difference. For my estimate ofη I use the effect of the temporary $500,000 notch on the probability of crossing $500,000 in the future,
which was shown in Table 4. I take the reduced fraction of charities crossing the threshold in the future (using the midpoint of .019 between the three estimates that vary from .018 to .020) and divide it by the fraction induced not to cross in the year of the notch (.101) to obtain the effect per buncher, and I arrive an estimate ofηˆ=.188. Plugging the historical-notch estimates from Table 9 into 2 and assuming β =.97
gives
dW dρ ≥0⇔
π
E[Ca(ˆy,yˆ−ρ, γ,y¯)|ρ <y¯≤ρ+δ]
≤54.34
Because E[Ca(ˆy,yˆ−ρ, γ,y¯)|ρ <y¯≤ρ+δ] ∈ (0,1), the left-hand side has value at least equal to π, the social value (net of government administrative cost) of a completed long form relative to an EZ form. Thus, π≥54.34 would have been a sufficient condition to lower the income level at which more reporting
was required. A static analysis would have concluded that the appropriate threshold would be at the static bunching ratio of753.21, a required social benefit nearly fifteen times greater than that estimated with the
dynamic methodology.
dW dρ ≥0⇔
π
E[Ca(ˆy,yˆ−ρ, γ,y¯)|ρ <y¯≤ρ+δ]
≤120.71
The threshold value required to lower the notch has risen because bunching has increased with the introduction of a more complicated form. Because empirical testing rejected the possibility that bunching was simply misreporting,E[Ca(ˆy,yˆ−ρ, γ,y¯)|ρ <y¯≤ρ+δ]appears to be significantly greater than 0 and perhaps close to 1. If we assume the marginal cost of avoidance is 1, then increasing the income threshold, say by indexing it to inflation, would be beneficial if and only if the marginal social value of a long form is less than or equal to $120.71. I leave estimation of the social value of Form 990, which would require information about the auditing processes of the Internal Revenue Service, to future work.
5 Conclusion
This paper estimates the compliance cost of a financial reporting requirement for U.S. charities. The average charity is currently willing to reduce income by about $900 to avoid reporting more information, and many leave the sample in the first year that their reporting burden increases. The fact that small charities who had not previously filed the simplified form were most likely to manipulate income provides evidence that much of the compliance cost is a one-time adjustment, and bunching to avoid this cost appears to be driven not simply by misreporting but rather by foregoing income in a way that permanently reduces growth.