Information Energy mimics
Ʌ
and CDM
Michael Paul Gough
University of Sussex, Brighton, BN1 9QT, UK. E-Mail: [email protected]
Abstract: The universe’s stellar heated gas and dust has an entropy/information content of ~1086 bits. At typical temperatures ~107 this has an equivalent energy ~1070 J, comparable to the universe’s ~1053 kg of baryons. Stellar mass density measurements show this dark energy contribution provides a near constant energy density at low redshifts, z<1.35, effectively emulating a cosmological constant to within 2% in Hubble parameter. Information energy would provide a solution to the cosmological coincidence problem and allow the cosmological constant to take the preferred zero value. Earlier phantom information energy at higher redshifts, z>1.35, would also account for the ‘Hubble Tension’ between early and late universe measurements. Information energy is co-located with hot baryons, and produces gravitational effects resembling those attributed to dark matter. Information energy is consistent with observed dark matter location specified by baryon location and strongest in regions of highest luminosity / temperature. The dark matter fraction measured in galaxy surveys more closely fits an information energy explanation than the fraction expected in the ɅCDM model. Overall, information energy is repulsive on the universe scale but attractive on galaxy scales, able to account for dark energy while also partially contributing to dark matter attributed effects.
Keywords: Dark Energy; Dark Matter; ɅCDM model
1. Introduction
In the standard ɅCDM model ordinary baryonic matter comprises only 5% of the universe with larger contributions from dark energy, 68%, and dark matter, 27%. The expansion of the universe is accelerating in the present epoch [1, 2] as the falling energy density of matter is now less than the near constant dark energy density. Although dark energy is generally assumed to be the cosmological constant, there is still no accepted physical explanation for the dark energy density value [3,4]. Observations of galaxy rotation rates, galaxy gravitational focusing, and clusters of colliding galaxies all require a significant unseen dark matter in addition to visible baryons. Candidates for dark matter particles include WIMPS, Axions, and others [5]. All attempts to directly detect dark matter particles have drawn a blank, and, in the process, severely limited any possible particle energy range [6,7]. A survey of the dark matter field [8] suggests that more progress might be achieved through additional astrophysical observations and new considerations.
Given the current lack of accepted physical explanations for both dark energy and dark matter it is important to consider other models, beyond ɅCDM. Here we consider the possible role of information energy. Matter and information both have equivalent energies. While mass, m, is equivalent to mc2 of energy, Landauer’s principle states that erasure of a bit of information in a system at temperature, T, will release a minimum kBT ln(2) of energy to the system’s surroundings [9,10]. Landauer's principle simply expresses the second law of thermodynamics, with information and entropy identical for the same degrees of freedom, only differing in measurement units (1bit=ln 2 nats). Landauer’s principle has now been experimentally verified for both classical bits and quantum qu-bits [11-14].
The 1st Friedmann equation [15] describing the expansion of the universe includes a term for the equivalent matter energy density, but ignores any information energy density contribution. Information energy naturally varies over time, depending on star and structure formation. and is
therefore more difficult to include in a general universe description. Previous estimates of information bit numbers and temperatures of various astrophysical phenomena [16-20] have shown the strongest information energy contribution is presently made by the ~1086 bits of stellar heated gas and dust. Then information energy should be included in the universe energy accounting as 1086 bits at typical temperatures of 106-108 have equivalent kBT ln(2) energies 1069-1071J, comparable tothe 1070J equivalent mc2 energy of the universe’s ~1053 kg baryons.
Below we consider to what extent information energy may contribute to the many effects hitherto attributed separately to dark energy and dark matter.
2.Information energy presently mimics a cosmological constant.
Weinberg[21] used the first Friedmann equation to express the Hubble parameter, H(a),
in
terms of its present value, the Hubble constant,
H
0,
and dimensionless energy density
parameters, Ω, where the present value of each is expressed as a fraction of today’s total
energy density so that all Ω terms add up to unity:
(
H(a)/H
0)
2= (Ω
DM+ Ω
b)
a
-3+ Ω
ra
-4+ Ω
ka
-2+ Ω
DEa
-3(1+w)(1)
Subscripts:
DM,
dark matter;
b,
baryons;
r,
radiation;
k,
curvature; and
DE,
dark
energy. The universe scale size,
a=
1/(1+
z
), where
z
is the redshift, and
.w
is the dark energy
equation of state. It is usual to assume curvature Ω
kis zero, and that the radiation term, Ω
r,
for some time has been negligible compared to the other terms. The ɅCDM
model further
assumes dark energy is the cosmological constant, Ʌ, (
w
= -1), further reducing (1) to:
(
H(a)/H
0)
2= (Ω
DM+ Ω
b)
a
-3+ Ω
Ʌ(2)
In order to include the information energy of stellar heated gas and dust in the energy density equation, we need to identify its variation over time. For simplicity, we make two assumptions. Firstly, we assume that the total bit number, N, of any large co-moving volume is governed by the Holographic Principle [22-24], and varies as a2. Secondly, we assume that, within any sufficiently large volume, the average temperature,T, representative of the stellar heated gas and dust varies in proportion to the fraction of baryons, f(a), that have formed stars up to that scale size. Total information equivalent energy is given by N kB T ln(2), proportional to both N and T. The information energy density term is then
Ω
IE(
f(a)/f(
1
))a
-1and, if information energy were the
sole source of dark energy, we obtain:
(
H(a)/H
0)
2= (Ω
DM+ Ω
b)
a
-3+ Ω
IE(
f(a)/f(
1
)) a
-1(3)
Fig. 1. Upper Plot. Review of stellar mass density measurements for co-moving volumes as a function of universe scale size, a. Plotted lines: two red straight lines, power law fits a+1.08±0.16 , (w= -1.03±0.05) for
z<1.35, and a+3.46±0.23, (w= -1.82±0.08) for z>1.35; blue line, the variation that would be required for
information energy to fully emulate a cosmological constant over all scale sizes. Source references. Filled symbols: grey circle[25]; dark green circle[26]; magenta circle[27]; pink square[28]; red circle[29]; cyan square[30]; blue square[31]; yellow circle[32]; black square[33]; green square[34]; blue circle[35]; dark green square[36]; brown square[37]; orange circle[38]; grey square[39]; black circle[40]; red square[41]. Open symbols: grey circle[43]; dark green circle [44]; magenta circle[45]; pink square[46]; red circle[47]; cyan square[48]; blue square[49]; yellow circle[50]; black square[51]; green square[52]; blue circle[53]; dark green square[54].
Middle Plot. Relative energy densities, relative to total today(=1.0) for a cosmological constant, information energy, and all matter, given by equations 2 and 3. Totals for all matter+cosmological constant, and for all matter+information energy are also shown.
Lower Plot. The difference in Hubble parameter, H(a) to be expected for an information energy source of dark energy relative to that due to a cosmological constant, and compared to the resolutions of future missions: Euclid[55], WFIRST [56], and BigBoss[57].
to data points either side of z=1.35, we find power law fits of a+1.08±0.16 for z<1.35, and a+3.46±0.23, for z>1.35. Assuming average baryon temperature, T, is proportional to the fraction of baryons in stars, T also varied as a+1.08±0.16 for z<1.35. Then total stellar heated gas and dust information energy (α NT ) varied as a+3.08±0.16, corresponding to a near constant energy density, or an equation of state parameter, value w=-1.03±0.05. In comparison, total information energy in the earlier period, z>1.35, varied as a+5.46±0.23, corresponding to a phantom energy with w= -1.82±0.08.
We see that the information energy of stellar heated gas and dust in the recent period, z<1.35, has the same characteristics of dark energy, since f(a) closely follows the a+1 gradient that would lead to a near constant information energy density, effectively emulating a cosmological constant (w= -1, blue line in Fig.1, upper plot). Thus information energy can account for dark energy quantitatively, both the present energy density value, ~1070J, and the recent period of constant energy density.
In Fig.1. middle and lower plots, we use the ɅCDM values
Ω
DM=
0.27
,
Ω
b=0.05, andΩ
Ʌ=Ω
IE=
0.68, in order to determine whether there is a detectable difference between the timehistories of equations 2 and 3. The power law fits to data in Fig.1 are used for f(a) in equation 3. We see in the middle plot that it is difficult to distinguish between the totals of information energy + all matter and the cosmological constant + all matter. At earlier times, when the difference between dark energy sources is greater, their contributions to the total are masked by the much larger matter contribution. Accordingly, in Fig. 1, lower plot, we emphasize any difference by plotting the relative difference in expected Hubble parameter, H(a), values between information energy and cosmological constant sources of dark energy. The maximum difference is small, <2%, and close to, or even beyond, the limiting resolution of the future dark energy measurements of Euclid, WFIRST, and BigBoss.
3. Present constant information energy density from natural feedback.
The advent of accelerating expansion has been associated [58,59] with directly causing a general reduction in galaxy merging, and structure formation. This reduction is evident in Fig.1 in the clear stellar mass density gradient reduction at z~1.35 from a+3.46±0.23 to a+1.08±0.16. In our information energy explanation for dark energy, once information energy was strong enough to initiate acceleration, this in turn inhibited star formation, and consequently limited the growth of information energy itself. Such a feedback mechanism should naturally cap the star formation gradient around a stable value ~ a+1, to constrain energy density to a constant value, and effectively mimic a cosmological constant. This scenario also explains the timing of the change in stellar formation rate around z~1.35, the measured power law value after z~1.35, and the present ratio of dark energy to matter energy.
4. Phantom Information Energy at earlier times.
Results of experiments to measure the dark energy equation of state, w, usually assume a simple shape for the w(a) timeline, using a minimum number of parameters with a present value wo, and the value at much earlier times wo+wa. Most astrophysical datasets, including Planck data [60-63], have been analysed to deduce cosmological parameters using the simple two parameter 'CPL' form of parameterisation [64] given by w(a) = wo+(1−a)wa. This parameterisation assumes a smooth, continuous variation of w(a) from wo+wa at very early times, a<<1, through to wo today (a=1).
Fig.2. Information energy predictions compared with Planck dataset combination results of 2013 (Fig. 36 of [60]), 2105 (Fig. 28 of [61]), and 2018 (Fig. 30 of [63]). 2D marginalised posterior distributions are shown by the 68% and 95% likelihood contours as a function of wo and wa for
different dataset combinations (see [60-63] for dataset details). Symbols: white circle, cosmological constant; red square, information energy. 2013: The areas bounded by the black dashed line and the black continuous line correspond to the 95% and 68% likelihoods, respectively, that are common to all three datasetṣ. 2015: Dashed line: 95% common likelihood. 2018: The unshaded region is the only region that does not correspond to a phantom dark energy.
There is a mounting body of evidence to suggest that the dark energy density is dynamic, with a phantom dark energy (wa<0) at earlier times, compatible with an information energy source. Planck CMB data is not strongly constrained without combining with other data sets. On its own this Planck data yields w=-1.54, +0.62/-0.50 corresponding to a ~2ơ shift into the phantom regime [61], effectively averaging over the whole range 0<z<1100. Various combinations of other measurements have found a similar shift into the phantom regime [65-69]. An earlier phantom energy can also explain the present problem of reconciling Hubble constant values found by different measurement techniques. This difference, or ‘Hubble Tension’, of ~4.4ơ, is primarily between late universe higher values and the early universe Planck CMB lower value [70]. A dynamic dark energy that was phantom at earlier times is one possible explanation for the tension. The phantom value required is wa=-0.8 (from Fig.4 of[70]), identical to our predicted information energy source of dark energy.
5. Algorithmic Information Theory supports information energy explanation.
Algorithmic information theory provides a simple, independent, supporting argument for an information related connection between star formation and accelerating expansion. The algorithmic information content of a system is given by the length of the shortest string of bits that can describe the position and momentum of all particles in the system [71]. This length is often called the algorithmic complexity or Kolmogorov complexity. Algorithmic information provides insights into the physics, as it has some features in common with thermodynamic entropy, including the requirement to adhere to the 2nd law.
sun 109m) require ~145 bits/parameter. At Fermi resolution the three equivalent values are each 65.7 bits/parameter less.
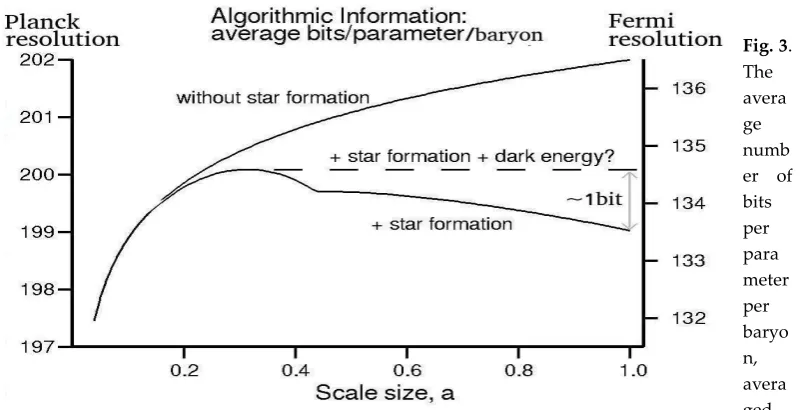
We assume a simple model based on the growth in the measured fraction of baryons that have formed stars up to the present value of 10% of all baryons (Fig.1). While the bits/parameter of the intergalactic baryons increase by one bit per universe doubling in size, those baryons within giant molecular clouds loose 30 bits per parameter when they form stars. Then Fig. 3. shows the resulting average bits/parameter/baryon using the growth history of star formation given by the observations summarised in Fig 1 (red lines). For comparison Fig. 3. also shows the variation if there was no star formation. The 30 bits lost by the present 10% of baryons that have formed stars has made a contribution of -3bits to the average while, between a=~0.25 and the present a=1.0, the remaining 90% of baryons have contributed +2 bits to the average. The resulting overall average fall of ~1bit/parameter/baryon is clearly independent of resolution between the limits of Planck and Fermi lengths, and implies a significant decrease in the total algorithmic information content of the universe, contrary to the 2nd law.
Fig. 3. The avera ge numb er of bits per para meter per baryo n, avera ged over all universe baryons, needed for an algorithmic information description.
Fortunately, dark energy has additionally increased the total universe energy density by ~x4, resulting in acceleration that doubled the Hubble parameter and hence doubled the size of the universe. The resulting accelerating expansion has provided the 90% intergalactic baryons, and effectively the universe baryon average, with one extra bit/parameter to counteract the reduction of one bit/parameter in algorithmic information due to star formation (horizontal dashed line of Fig. 3). Then accelerating expansion appears to be required to ensure the universe’s algorithmic information complies with the 2nd law, supporting our suggestion of a direct link between star formation, information and acceleration.
6. Information energy mimics dark matter
Space-time will be distorted equally by accumulations of matter and by accumulations of energy. Information energy is naturally located where baryons occur at high temperature and density and where information energy densities should be high enough to add significantly to baryon gravitational distortions of space-time. While the above dark energy effects of information energy are effectively repulsive universe-wide, the extra distortions to space-time caused by the presence of significant information energy centered around structures will be locally attractive. Such dark matter like effects will be different for each astrophysical object, and therefore more difficult to take into account in a quantitative manner universe wide.
found [72,73] between the observed galaxy radial acceleration and that predicted from baryons, based on a total of 240 galaxies of various morphologies: 153 late-type galaxies, 25 early- type galaxies and 62 dwarf spheroidals. There is very little scatter and this strong empirical relation shows all galaxies studied follow the same radial acceleration relation, showing the dark matter contribution to be fully specified by the baryons. Thus dark and baryonic masses exhibit a strong coupling that is difficult for the ɅCDM model to explain, but follows directly from information energy.
Clusters of colliding galaxies are considered to provide some of the strongest evidence for the existence of dark matter. Optical observations show stars pass through the collision largely unhindered whereas X-ray observations show the galactic gas clouds, containing the majority of baryons, collide, slowing down or even halting. The location of dark matter is then identified from lensing measurements [74-76]. A study of the Bullet cluster [74], and of a further 72 mergers [75], both major and minor, finds no evidence for dark matter deceleration, with the dark mass remaining closely co-located with the stars and structure. Clearly, information energy could equally explain these dark matter effects, as information energy from stellar heated gas and dust passes with the stars straight through the collision.
Observations of clusters of galaxies [77] show that the brightest galaxies are almost always found in the middle of those locations where gravitational lensing indicates the dark matter contribution is maximum. Clearly, this property is also consistent with an information energy explanation since information energy is proportional to temperature and brightness.
Information energy also fits with the favoured bottom up hierarchical structure formation with smaller objects forming first and effectively promoting the formation of larger structures, resembling cold dark matter rather than hot dark matter. In the ɅCDM model gravitational lensing effects are due to higher densities of dark matter which have led to increased structure formation and brighter galaxies at those locations. As galaxies increase in brightness with increasing temperatures and higher entropies, the higher information energy densities should lead to both the observed gravitational lensing dark matter-like effects and further increases in structure formation.
The spatial distributions of some galaxies and galaxy clusters have been found to exhibit an “assembly bias” [78]. The way in which those galaxies interact with their dark matter environments appears to be determined not just by their masses but also by their past formation history. This could also be consistent with an information energy explanation as information/entropy is a result of not just present processes but also the result of the past history of physical processes that operated on baryons.
The milky way, Andromeda, and Centaurus-A galaxies have a number of satellite dwarf galaxies that orbit in the same plane with the majority co-rotating [79,80]. This observation is difficult to reconcile with ɅCDM as dark matter should be distributed in a sphere around the parent galaxy with satellite galaxies randomly distributed. However, this observation may be consistent with information energy as dark matter like effects should follow the location of the parent galaxy’s hot baryons.
7. Equivalent galaxy dark matter fractions of information energy.
for 50% light emission). Another survey of 584 typical star-forming galaxies, z=0.8-1.0 [82] finds fDM= 65±12%. The present expected information energy value ~68% lies in the middle of both ranges while the ɅCDM fDM~85% lies outside.
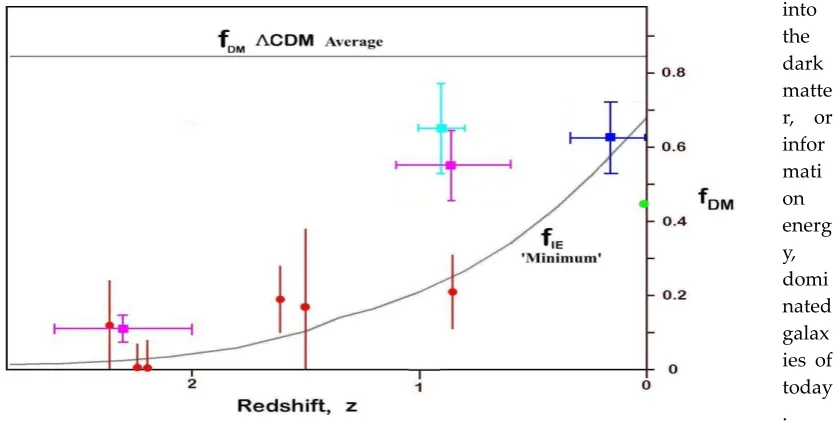
While values of fIE should be high in the high temperature baryon objects that we can observe, universe average fIE would have been much lower at earlier times when only a small fraction of baryons had formed stars. Therefore, we expect observable object fDM values at or above the universe average fIE value at that redshift (fIEeffectively provides a ‘minimum’ value). In contrast, universe average ɅCDM fDM should have remained constant, independent of redshift, and observed object fDM values should be found distributed approximately evenly about fDM ~85%. Fig.4. compares these universe average values with several galaxy surveys [81-83] and with six early star forming disk galaxies [84].
The variation in the dark matter contribution illustrated in Fig. 4 emphasizes the relative absence of dark matter in early massive star forming galaxies of 10 billion years ago. Note surveys of early star forming galaxies made with the same instruments and analysis techniques, but in two different redshift ranges [83] (purple squares in Fig.4) show that galaxies at z=2.0-2.6 clearly have lower fDM values than those at z=0.6-1.1.
Overall, both survey and individually measured values of fDM are more consistent with the time varying minimum predicted by the information energy model than with the fixed 85% average value of the ɅCDM model. In the ɅCDM model clumps of dark matter attract baryons to form stars and structure, and over time as more baryons join these clumps we might even expect a decrease of the observed dark matter fractions, contrary to the observations of Fig. 4. An information energy explanation would explain how the early galaxies with little dark matter grew into the dark matte r, or infor mati on energ y, domi nated galax ies of today .
Fig 4. Observed fDM compared with average ɅCDM fDM and the information energy fIE. ‘minimum’.
Survey results, square symbols: Dark Blue, 1.7 x10⁵ massive early-type galaxies z<0.33 [81], Light
Blue, 584 typical star-forming galaxies, z=0.8-1.0 [82], Purple, 92 star forming galaxies, z=2.0-2.6 and 106 star forming galaxies, z=0.6-1.1 [83]. Individual galaxies, circle symbols: Red, six early star forming galaxies [84]; Green, Milky Way galaxy [85]. The fIE curve is calculated from the power law
fits to the star formation data of Fig.1, assuming present fIE=68%.
All of the effects attributed to both dark energy and dark matter only occur through the action of gravitational forces. There is no evidence of dark energy or dark matter interacting with ordinary baryonic matter or photons through any of the other fundamental forces. This similarity argues for a common explanation, and we have shown above that information energy can contribute to both phenomena, providing attractive forces in the vicinity of structures, and an overall repulsive force on the universe scale. Then it is important to determine whether those contributions are significant.
Dark Energy
The information energy approach allows us to account for the present dark energy density value with proven physics, relying solely on the experimentally proven Landauer's Principle with realistic universe entropy estimates. The Holographic Principle is only used in combination with star formation measurements to show information energy has a near constant information energy density that mimics a cosmological constant. In this work we have just applied the simple scaling of information with area of bounding surface, the most basic aspect of the Holographic Principle and concentrated on observations. Note the Holographic Principle is generally accepted for black holes at the holographic bound, it remains only a conjecture for universal application [24]. Information energy mimics observed dark energy both quantitatively and qualitatively, and the data suggests star formation is limited by feedback from accelerating expansion. This measured a+1 gradient is significant as it is the natural value for such a feedback linking stellar growth rate to dark energy, strongly indicating information energy could be the most significant, or even sole, source of dark energy.
There are three clear advantages to an information source of dark energy. Firstly, an information energy source of dark energy solves the "why now?" cosmological coincidence problem. Star formation had to have advanced sufficiently before information energy was strong enough to affect universe expansion. Star formation had also to have advanced sufficiently for the likelihood of intelligent beings evolving to observe an accelerating expanding universe. It is therefore not such a coincidence that we are around when dark energy has a similar order of magnitude energy density to matter. Secondly, theoretical estimates of the cosmological constant differ from the observed value by a factor ~10123. However, an information energy explanation for dark energy allows the cosmological constant to take the much more likely zero value [86]. Thirdly, the earlier period, before information energy achieved a near constant energy density, had just the phantom level, wa=-0.8, to explain the difference in Hubble parameters found between early and late universe measurements[70], solving the present ‘Hubble Tension’ problem.
All explanations for dark energy encounter the problem of energy conservation, since constant energy density implies a total dark energy increasing as a3. However, in general relativity, dark energy may increase without seeming to conserve energy, because of the continual exchange of energy between matter and changing space-time or gravitational field [87]. This aspect of an information energy source awaits theoretical development of holographic and quantum gravity theories.
There is an interesting similarity between Ʌ and information energy. Ʌ has a characteristic energy with present value ∆Ʌ~3x10⁻³eV, too small to relate to any relevant particle physics [88]. The form of equation for ∆Ʌ has been shown [89,90] to be directly equivalent to kBT, corresponding to the equivalent energy of a bit of information at T~35. This low value is effectively the average baryon temperature if there was no star formation. In this work we have concentrated on the information associated with the much higher temperatures of stellar heated gas and dust, T~107.
Dark Matter
Information energy is consistent with the dark matter effects observed to be fully specified by baryon location, strongest at highest luminosity locations, consistent with measured dark matter fractions in galaxy surveys, with changes in dark matter fractions in time, and possibly also consistent with the observed alignment of satellite galaxies.
Unfortunately, at the scale of the universe we encounter problems trying to account for all dark matter effects with an information energy explanation. If information energy were to account for both dark energy and all dark matter attributed effects, equation (3) would then become:
(
H(a)/H
0)
2= Ω
ba
-3+ Ω
IE(
f(a)/f(
1
)) a
-1(4)
While equation (4) could still account for the observed accelerating expansion with
Ω
IE~68% andΩ
b~32%, it would require finding many more ‘missing’ baryons [91] in order to provide a totalenergy density equivalent to ~6 protons/m3. consistent with the Hubble constant and a near flat universe.
Another problem for an information energy explanation for all dark matter effects would be to explain the third peak of CMB temperature anisotropies. The ɅCDM model explains the size of the observed peak as being moderated by a 27% energy contribution from dark matter. It is not clear whether this peak reduction could be caused by something other than dark matter. While there are many dark matter measurements for individual galaxies, the universe total is usually derived from fits to combinations of data-sets, and then often already assuming the ɅCDM model when fitting the data. It is beyond the scope of this present work to attempt a similar multi-measurement type dataset fit to the information energy model proposed here.
In summary, the information energy explanation could fully account for dark energy effects but might only provide a partial contribution to dark matter effects. An information energy approach provides an explanation emphasizing the two preferred requirements [8,92]: ‘simplicity’ (wielding Occam's razor); and ‘naturalness’ (relying on mostly proven physics), with a strong dependence on empirical data.
Acknowledgements: The author is grateful for an Emeritus Professorship from the
University of Sussex.
References.
1. Riess, A.G.; Filippenko, A.V.; Challis, P.; Clocchiatti, A.; et al., Observational evidence from supernovae for an accelerating universe and a cosmological constant. Astron. J., 1998, 116, 1009-1038.
2. Perlmutter, S.; Aldering, G.; Goldhaber, G.; Knop, R.A.; et al. Measurements of Ω and Λ from 42 high-redshift supernovae. Astrophys. J., 1999, 517, 565–586.
3. Carroll, S.M. Why is the Universe Accelerating? In Measuring and Modeling the Universe; Carnegie Observatories Astrophysics Series, Vol2; Freedmann, W.L., Ed.; Cambridge Univ Pr. Cambridge, UK,
2003.
4. Frieman, J.A.; Turner, M.S.; Huterer, D. Dark energy and the accelerating universe. Ann.Rev.Astron. Astrophys., 2008, 46, 385–432.
5. Pretzl, K. Dark Matter Searches, Space Science Reviews, 2007, 130, 63-72.
6. Bauer, D. , Buckley, J. , Cahill-Rowley, M., et al, Dark Matter in the Coming Decade: Complementary Paths to Discovery and Beyond, Physics of the Dark Universe, 2015, 7-8, pp 16-23.
7. Bertone,G., Hooper,D., Silk,J., Particle dark matter: Evidence, candidates and constraints, Physics Reports,
2005, 405,(5-6), 279-390.
8. Bertone, G., A new era in the search for dark matter, Nature, 2018, 562, 51-56.
9. Landauer, R.,Irreversibility and heat generation in the computing process. IBM J. Res.Dev. ,1961, 3, 183– 191.
11. Toyabe, S; Sagawa, T.; Ueda, M.; Muneyuki, E.; Sano, M. Experimental demonstration of information-to-energy conversion and validation of the generalized Jarzynski equality. Nat. Phys., 2010, 6, 988–992. 12. Berut, A.; Arakelyan, A.; Petrosyan, A.; Ciliberto, S.; Dillenschneider, R.; Lutz, E. Experimental verification
of Landauer’s principle linking information and thermodynamics. Nature, 2012, 483,187–189.
13. Jun,Y., Gavrilov, M.,Bechhoefer,J., High-Precision Test of Landauer’s Principle in a Feedback Trap, Physical Review Letters, 2014, 113, 190601-1 to -5.
14. Yan,L.L., Xiong,T.P., Rehan,K., et al., Single_Atom Demonstration of the Quantum Landauer Principle, Phys. Rev. Lett.2018, 120, 210601.
15. Friedman, A., On the Curvature of Space, General Relativity and Gravitation, 1999 31 (12): 1991–2000. 16. Frampton, P.H.; Hsu, S.D.H.; Kephart, T.W.; Reeb, D. What is the entropy of the universe? Class. Quant.
Grav., 2009, 26, 145005, (7pp).
17. Egan, C.A.; Lineweaver, C.H. A larger estimate of the entropy of the universe. Astrophys. J., 2010, 710, 1825–1834.
18. Gough,M.P., Holographic Dark Information Energy, Entropy, 2011, 13, 924-935.
19. Gough, M.P., Holographic Dark Information Energy: Predicted Dark Energy Measurement, Entropy, 2013, 15, 1133-1149.
20. Gough,M.P.,A Dynamic Dark Information Energy Consistent with Planck Data, Entropy, 2014, 16, 1902-1916
21. Weinberg, A., Gravitation and Cosmology, Wiley, New York, 1972.
22. T’Hooft, G. Obstacles on the way towards the quantization of space, time and matter- and possible solutions. Stud. Hist. Phil. Mod. Phys., 2001, 32, 157–180.
23. Susskind, L. The world as a hologram. J. Math. Phys., 1995, 36, 6377–6396. 24. Buosso, R. The holographic principle. Rev. Mod. Phys., 2002, 74, 825–874.
25. Li, C., White, S.D.M., The distribution of stellar mass in the low-redshift universe, Mon. Not. R. Astron. Soc., 2009, 398, 2177-2187.
26. Gallazzi,A., Brinchmann,J.,, Charlot,S., White,S.D.M., A census of metals and baryons in stars In the local universe, Mon. Not. R. Astron. Soc., 2008, 383, 1439-1458.
27. Moustakas J, Coil A, Aird J, et al., PRIMUS: constraints on star formation quenching and Galaxy merging and the evolution of the stellar mass function from z=0-1, Ap. J., 2013, 767:50 (34pp).
28. Bielby R, Hudelot P, McCracken HJ, et al., The WIRCam Deep Survey. I. Counts, colours, and mass-functions derived from near-infrared imaging in the CFHTLS deep fields, Astron.
Astrophys. , 2012, 545, A23 (20pp).
29. Perez-Gonzalez PG, Rieke GH, Villar V, et al., The stellar mass assembly of galaxies from z=0-4: analysis of a sample selected in the rest-frame near infrared with Spitzer, Ap. J., 2008, 675, 234-261.
30. Ilbert O, McCracken HJ, Le F`evre O, et al., Mass assembly in quiescent and star-forming Galaxies since z~4 from UltraVISTA, Astron. Astrophys. 2013 , 556, A55(19pp).
31. Muzzin A, Marchesini D, Stefanon M, et al. The evolution of the stellar mass functions of star-forming and quiescent galaxies to z=4 from the COSMOS/UltraVISTA survey, Ap. J. , 2013, 777, 18 (30pp).
32. Arnouts S, Walcher CJ, Le Fevre O, et al.,The SWIRE-VVDS-CFHTLS surveys: Stellar Assembly over the last 10Gyr., Astron. Astrophys. , 2007, 476, 137-150.
33. Pozzetti L, Bolzonella M, Zucca E, et al., zCOSMOS -10k bright spectroscopic sample. The bimodality in the galaxy stellar mass function, Astron. Astrophys. , 2010, 523, A13(23pp).
34. Kajisawa M, Ichikawa T, Tanaka I, et al. , MOIRCS deep survey IV evolution of galaxy stellar mass function back to z~3, Ap. J. , 2009, 702, 1393-1412.
35. Marchesini D, van Dokkum PG, Forster Schreiber NM, et al., The evolution of the stellar mass function of galaxies from z=4 and the first comprehensive analysis of its uncertainties, Ap. J., 2009, 701, 1765-1769. 36. Reddy NA, Dickinson M, Elbaz D, et al. GOODS-HERSCHEL measurements of the dust
attenuation of typical star forming galaxies at high redshift, Ap. J., 2012, 744, 154(17pp). 37. Caputi,K.I,, Cirasuolo,M., Dunlop,J.S., et al. The stellar mass function of the most massive Galaxies at 3<z<5 in the UKIDSS Ultra Deep Survey, Mon. Not. R. Astron. Soc., 2011, 413, 162-176.
39. Lee K-S, Ferguson HC, Wiklind T, et al., How do star-forming galaxies at z>3 assemble their masses?, Ap. J., 2012, 752, 66(21pp).
40. Yabe K, Ohta K, Iwata I, et al. The stellar populations of Lyman break galaxies at z~5, Ap. J., 2009, 693, 507-533.
41. Labbe I, Oesch PA, Bouwens RJ, et al., The spectral energy distributions of z~8 galaxies from the IRAC ultra deep fields, Ap. J. Let., 2013, 777, L19(6pp).
42. Madau,P., Dickinson,M., Cosmic Star Formation History, Annual Review of Astronomy and Astrophysics, 2014, 52, 415-486.
43. Cole, S.; Peterson, B.A.; Jackson, C.; Peacock, J.A.; et al., The 2dF galaxy redshift survey., Mon. Not. R. Astron. Soc., 2001, 326, 255–273.
44. Dickinson, M.; Papovich, C.; Ferguson, H.C.; Budavari, T. The evolution of the global stellar mass density at 0 < z < 3. , Astrophys. J., 2003, 587, 25–40.
45. Rudnick, G.; Rix, H.W.; Franx, M.; Labbe, I.; et al., The rest-frame optical luminosity density,colour, and stellar mass density of the universe from z = 0 to z = 3., Astrophys. J., 2003, 599,847–864.
46. Brinchmann, J.; Ellis, R.S. The mass assembly and star formation characteristics of field galaxies of known morphology, Astrophys. J. , 2000, 536, L77–L80.
47. Elsner, F.; Feulner, G.; Hopp, U. The impact of Spitzer infrared data on stellar mass estimates. Astron. Astrophys., 2008, 477, 503–512.
48. Drory,N., Salvato,M., Gabasch,A.,et al, The stellar mass function of galxies to z~5, Astrophysical Journal, 2005, 619, L131-L134.
49. Drory.N., Alvarez, M., The contribution of star formation and merging to stellar mass buildup in galaxies, The Astrophysical Journal, 2008, 680, 41-53.
50. Fontana, A., et. al., The assembly of massive galaxies from near Infrared observations of Hubble deepfield south, Ap. J. Lett., 2003, 594, L9-L12.
51. Fontana, A., et al., The galaxy mass function up to z=4 in the GOODS-MUSIC sample , Astron. Astrophys., 2006, 459, 745-757.
52. Cohen, J.G. CALTECH faint galaxy redshift survey. Astrophys. J., 2002, 567, 672–701. 53. Conselice, C.J.; Blackburne, J.A.; Papovich, C. The luminosity, stellar mass, and number density evolution of field galaxies. Astrophys. J., 2005, 620, 564–583.
54. Borch,A.,Meisenheimer,K.,Bell,E.F.,et al.,The stellar masses of 25000 galaxies at 0.2<z<1.0 estimated by COMBO-17 survey, Astronomy and Astrophysics, 2006, 453, 869-881.
55. ESA Euclid Definition Study Report, 30 September 2011. Accessed 28 Sept. 2019, sci.esa.int/web/euclid/-/48983-euclid-definition-study-report-esa-sre-2011-12/
56. NASA WFIRST-AFTA Science Definition Team Final Report, Feb 13, 2015, Accessed 28 Sept 2019. wfirst.gsfc.nasa.gov/science/sdt_public/WFIRST-AFTA_SDT_Report_Briefing
_to_Hertz_150219_Final_RevA.pdf
57. Schlegel, D.J.; Bebek, C.; Heetderks, H.; Ho, S.; et al., The ground-based StageIV BAO Experiment, arXiv: 0904.0468v3, 2009.
58. Frieman, J.A.; Turner, M.S.; Huterer, D. Dark energy and the accelerating universe, Ann. Rev.Astron. Astrophys., 2008, 46, 385–432.
59. Guzzo, L.; Pierleoni, M.; Meneux, B.; Branchini, E.; et al., A test of the nature of cosmic acceleration using galaxy redshift distortions. Nature, 2008, 451, 541–544.
60. Ade, P. et al.; Plank Collaboration. Planck 2013 results. XVI. Cosmological parameters, Astron. Astrophys., 2014, 571, A16.
61. Ade, P. et al.; Plank Collaboration. Planck 2015 results. XIII. Cosmological parameters, Astron. Astrophys., 2016, 594, A13.
62. Ade, P., et al.; Planck Collaboration. Planck 2015 results. XIV. Dark energy and modified gravity, Astron. Astrophys., 2016, 594, A14.
63. Planck collaboration, Planck 2018 results. VI, Cosmological Parameters, ArXiV1807.06209,
2018. Accessed 28 Sept. 2019.
64. Chevallier, M.; Polarski, D. Accelerating universes with scaling dark matter. Int. J. Mod. Phys.D, 2001, 10, 213–224.
65. Rest, A., Scolnic, D., Foley, R.J., Huber, M.E., et al., Cosmological constraints from measurements of type 1A supernovae discovered during the first 1.5 years of the Pan_STARRs1 survey, Astrophysical J., 2014, 795:44(34pp)
67. Cheng, C., & Huang, Q-G.,Dark side of the universe after Planck data, Phys. Rev. D, 2014, 89,043003, (8 pp).
68. 68. Xia, J-Q., Li, H., Zhang, X.,Dark energy constraints after new Planck data, Phys. Rev. D, 2013, 88, 063501,8p
69. Delubac, T., Bautista, J.E., Busca,N.G., Rich,J., et al., Baryon acoustic oscillations in the Lyα forest of BOSS DR11 quasars, Astronomy and Astrophysics, 2015, 574, A59 (17pp).
70. Riess,A.G., Casertano, S., Yuan,W., et al., Large Magellanic Cloud Cepheid Standards provide a 1% foundation for determination of the Hubble Constant and stronger evidence for physics beyond ɅCDM, Accepted by Ap. J., ArXiv 1903.07603, 27March 2019.
71. Devine, S., The Insights of Algorithmic Entropy, Entropy, 2009, 11, 85-110.
72. McGaugh, S.S., Lelli, F., Schomobert, J.M., The Radial Acceleration Relation in Rotationally Supported Galaxies, Phys. Rev. Lett., 2016, 117, 201101
73. Lellil, F., McGaugh,S.S., Schombert,J.M., Pawlowskil, M.S., One Law to Rule them all: the Radial Acceleration Relation of Galaxies, Astrophysical J., 2017, 836:152 (23pp)
74. Markevich,M., Gonzalez,H., Clowe,D., Vikhlinin,A., et al., Direct constraints on the dark matter self-interaction cross-section from the merging galaxy cluster 1E0657-56, Astrophys. J. , 2004, 606 (2), 819–824. 75. Harvey, D., Massey, R., Kitching, T., Taylor, A., & Tittley, E. The non gravitational interactions of dark
matter in colliding galaxy clusters. Science, 2015, 347, (62290), 1462-1465.
76. Massey, R., Williams, L., Smit, R., Swinbank, M., et al., The behaviour of dark matter associated with four bright Cluster galaxies in the 10kpc core of Abell 3827.
Mon. Not. R. Astron. Soc., 2015, 449(4), 3393-3406.
77. Viola, M., Cacciato, M., Brouwer,M., Kuijken, K.,et al., Dark matter halo properties of GAMA galaxy groups from 100 square degrees of KiDS weak lensing data, Mon. Not. R. Astron. Soc., 2015, 452, 3529-3550.
78. Miyatake, H., More,S., Takada, M., Spergel, D.N., et el., Evidence of Halo Assembly Bias in Massive Clusters. Phys. Rev. Lett., 2016, 116, 041301 (5pp).
79. Muller, O., Pawlowski, M.S., Jerjen,H.,Lelli,F., A whirling plane of satellite galaxies around Centaurus A challenges CDM cosmology, Science, 2018, 359, 534-537.
80. Boylan-Kolchin,M., Galaxy motions cause trouble for cosmology, Science, 2018, 359, 520-521.
81. Grillo, C., Projected central dark matter fractions and densities in massive early-type galaxies from the Sloan Digital Sky Survey, Astrophysics Journal, 2010, 722, 779-787. 82. Stott,J.P., Swinbank,A.M., Johnson,H.L., et al., The KMOS Redshift One Spectroscopic Survey (KROSS): Dynamical properties, gas and dark matter fractions of typical z~1 star-forming Galaxies, Mon. Not.,R. Astron. Soc., 2016, 457, 1888-1904.
83. Wuyts, S., et al. KMOS3D: Dynamical constraints on the mass budget in early star-forming disks. Astrophys.J, 831, 149-171 (2016)
84. Genzel,R.,Forster Schreiber,N.M.,Ulber,H.,Lamg,P., et al., Strongly baryon-dominated disk galaxies at the peak of galaxy formation ten billion years ago, Nature, 2017, 543, 397-401. 85. Bland-Hawthorn, J. & Gerhard, O. The galaxy in context: structural, kinematic, and integrated properties. Annu. Rev. Astron. Astrophys. 2016, 54, 529–596.
86. Weinberg, S. The cosmological constant problem. Rev. Mod. Phys., 1989, 61, 1–23.
87. Carroll, S., http://www.preposterousuniverse.com/blog/2010/02/22/energy-is-not-conserved/ 88. Peebles, P.J.E. Principles of Physical Cosmology; Princeton University Press, 1993
89. Gough, M.P., Carozzi, T., Buckley, A.M. On the similarity of Information Energy to Dark Energy. arXiv 6p, astro-ph/0603084, 2006.
90. Gough, M.P., Information Equation of State, Entropy, 2008, 10, 150-159.
91. Nicastro,F. et al, Observations of the missing baryons in the warm–hot intergalactic medium, Nature (2018). DOI: 10.1038/s41586-018-0204-1