450
Predicting accuracy on large datasets from smaller pilot data
Mark Johnson Macquarie University
Peter Anderson Australian National University
Mark Dras Macquarie University
Mark Steedman University of Edinburgh
Abstract
Because obtaining training data is often the most difficult part of an NLP or ML project, we develop methods for predict-ing how much data is required to achieve a desired test accuracy by extrapolating re-sults from systems trained on a small pilot training dataset. We model how accuracy varies as a function of training size on sub-sets of the pilot data, and use that model to predict how much training data would be required to achieve the desired accu-racy. We introduce a new performance ex-trapolation task to evaluate how well dif-ferent extrapolations predict system accu-racy on larger training sets. We show that details of hyperparameter optimisa-tion and the extrapolaoptimisa-tion models can have dramatic effects in a document classifica-tion task. We believe this is an important first step in developing methods for esti-mating the resources required to meet spe-cific engineering performance targets.
1 Introduction
An engineering discipline should be able to predict the cost of a project before the project is started. Because training data is often the most expen-sive part of an NLP or ML project, it is impor-tant to estimate how much training data required for a system to achieve a target accuracy. Un-fortunately our field only offers fairly impracti-cal advice, e.g., that more data increases accu-racy (Banko and Brill,2001); we currently have no practical methods for estimating how much data or what quality of data is required to achieve a target accuracy goal. Imagine if bridge construction was planned the way we build our systems!
Our long-term goal is to develop practical meth-ods for designing systems that achieve target per-formance specifications, including identifying the amount of training data that the system will re-quire. This paper starts to address this goal by in-troducing an extrapolation methodology that pre-dicts a system’s accuracy on a larger dataset from its performance on subsets of much smaller pilot data. These extrapolations allow us to estimate how much training data a system will require to achieve a target accuracy. We focus on a specific task (document classification) using a specific sys-tem (the fastText classifier ofJoulin et al.(2016)), and leave to future work to determine if our ap-proach and results generalise to other tasks and systems.
We introduce an accuracy extrapolation task
that can be used to evaluate different extrapolation models. We describe three well-known extrapo-lation models and evaluate them on a document classification dataset. On our development data the biased power-law method with binomial item weighting performs best, so we propose it should be a baseline for future research. We demon-strate the importance of hyperparameter optimi-sation on each different-sized data subset (rather than just optimising on the largest data subset) and item weighting, and show that these can have a dramatic impact on extrapolation, especially from small pilot data sets. The data and code for all experiments in this paper, including the R code for the graphics, is available fromhttp://web.
science.mq.edu.au/˜mjohnson.
2 Related work
sim-ilar techniques for NLP and ML systems. There is a large body of research on the relationship be-tween training data size and system performance.
Geman et al.(1992) decompose the squared error of a model into abias term(due to model errors) and avariance term(due to statistical noise). Bias does not vary with training data sizen, but the er-ror due to variance should decrease asO(1/√n)if
the training observations are independent ( Domin-gos,2000a,b). The power-law models used in this paper have been investigated many times in prior literature (Haussler et al.,1996;Mukherjee et al.,
2003;Figueroa et al.,2012;Beleites et al.,2013;
Hajian-Tilaki,2014;Cho et al., 2015). Sun et al.
(2017),Barone et al.(2017) and the concurrent un-published work byHestness et al.(2017) point out that these power-law models describe modern ML and NLP systems quite well, including complex deep-learning systems, so we expect our results to generalise to these systems.
This paper differs from prior work in that we explicitly focus on the task of extrapolating sys-tem performance from small pilot data. We in-troduce a new evaluation task to compare the ef-fectiveness of different models for this extrapola-tion, and demonstrate the importance of per-subset hyperparameter optimisation and item weighting, which prior work did not investigate.
3 Models for extrapolating pilot data
We are given a system whose accuracy on a large dataset we wish to predict, but only a smaller pi-lot dataset is available. We train the system on different-sized subsets of the pilot dataset, and use the results of those training runs to estimate how the system’s accuracy varies as a function of train-ing data size.
We focus on predicting the minimum error rate e(n) that the system can achieve on a dataset of size n after hyperparameter optimisation (where the error rate is 1−accuracy for a classifier) given a pilot dataset of sizem n(in the task below, m =n/2orm = n/10). We investigate three
dif-ferent extrapolation models ofe(n)in this paper:
• Power law:eˆ(n) =bnc
• Inverse square-root:ˆe(n) =a+bn−1/2 • Biased power law:ˆe(n) =a+bnc
Hereeˆ(n)is the estimate ofe(n), anda,bandc are adjustable parameters that are estimated based on the system’s performance on the pilot dataset.
0.10 0.15 0.20 0.25 0.30
103 104 105
Pilot data size
Error r
ate
Pilot data
==0.1
<=0.1
==0.5
[image:2.595.308.534.59.231.2]<=0.5
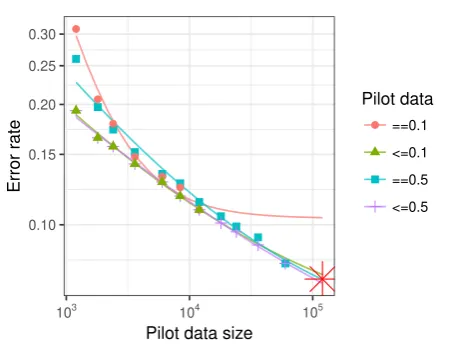
Figure 1: An extrapolation run from pilot data consisting of either 0.1 or 0.5 of the ag news corpus. The x-axis is the size of the subset of pilot data, while the y-axis is the classification error rate. The shapes/colors show the maxi-mum fraction of the corpus used in the pilot data, and whether hyperparameters were optimised only once on all of the pilot data (e.g.,= 0.1and= 0.5) or at each smaller subset of the pilot data (e.g.,
≤0.1and≤0.5). The lines are least-squares fits of biased power-law models (ˆe(n) = a+bnc) to
the corresponding pilot data. The red star shows minimum error rate when all the training data is used to train the classifier (this is the value we are trying to predict).
The inverse square-root curve is what one would expect if the error is distributed according to a Bias-Variance decomposition (Geman et al.,1992) with a constant bias term a and a variance term that asymptotically follows the Central Limit The-orem. We fit these models using weighted least squares regression. Each data point oritemin the regression is the result of a run of the system on a subset of the pilot dataset.
Assuming that the underlying system has ad-justable hyperparameters, the question arises: how should the hyperparameters be set? The com-putationally least demanding approach is to opti-mise the system’s hyperparameters on the full pilot dataset, and use these hyperparameters for all the runs on subsets of the pilot dataset. An alternative, computationally more demanding approach is to optimise the system’s hyperparameters separately on each of the subsets of the pilot dataset. Figure1
in-ferior to optimising the hyperparameters on each subset of the pilot dataset. We show below that the more demanding approach of optimising on each subset is superior, especially when extrapolating from small pilot datasets.
We also investigate how details of the regression fit affect the regression accuracyeˆ(n). We exper-imented with several link functions (we used the default Gaussian link here), but found that these had less impact than adjusting theitem weightsin the regression. Runs with smaller training sets pre-sumably have higher variance, and since our goal is to extrapolate to larger datasets, it is reasonable to place more weight on items corresponding to larger datasets. We investigated three item weight-ing functions in regression:
• constant weights (1), • linear weights (n), and • binomial weights (n/e(1−e))
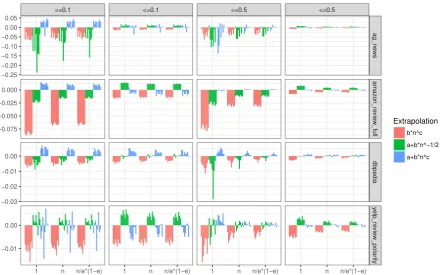
Linear weights are motivated by the assumption that the item variance follows the Central Limit Theorem, while the binomial weights are moti-vated by the assumption that item variance follows a binomial distribution (see the Supplemental Ma-terials for further discussion). As Figure2makes clear, linear weights and binomial weights gen-erally produce more accurate extrapolations than constant weights, so we use binomial weights in our evaluation in Table2.
4 A performance extrapolation task
We used the fastText document classifier and the document classification corpora distributed with it; see Joulin et al. (2016) for full details. Fast-Text’s speed and evaluation scripts make it easy to do the experiments described below. We fit-ted our extrapolation models to the fastText docu-ment classifier results on the 8 corpora distributed with the fastText classifier. These corpora contain labelled documents for a document classification task, and come randomised and divided into train-ing and test sections. All our results are on these test sections.
The corpora were divided into development and evaluation corpora (each with train and test splits) as shown in table 1. We use theamazon review polarity,sogou news,yahoo answers
and yelp review full corpora as our test set (so these are only used in the final evaluation), while the ag news, dbpedia, amazon review full and
yelp review polarity were used as development cor-pora. The development and evaluation sets contain document collections of roughly similar sizes and complexities, but no attempt was made to accu-rately “balance” the development and evaluation corpora.
We trained the fastText classifier on 13 differently-sized prefixes of each training set that are approximately logarithmically spaced over two orders of magnitude (i.e., varying from1⁄100to all of the training corpus). To explore the effect of hyperparameter tuning on extrapolation, for each prefix of each training set we trained a classifier on each of 1,079 different hyperparameter settings, varying the n-gram length, learning rate, dimen-sionality of the hidden units and the loss function (the fastText classifier crashed on 17 hyperparam-eter combinations; we did not investigate why). We re-ran the entire process 8 times on randomly-shuffled versions of each training corpus.
As expected, the minimum error configuration invariably requires the full training data. When extrapolating from subsets of a smaller pilot set (we explored pilot sets consisting of0.1and0.5of the full training data) there are two plausible ways of performing hyperparameter optimisation. Ide-ally, one would optimise the hyperparameters for each subset of the pilot data considered (we se-lected the best-performing hyperparameters using grid search). However, if one is not working with computationally efficient algorithms like fastText, one might be tempted to only optimise the hy-perparameters once on all the pilot data, and use the hyperparameters optimised on all the pilot data when calculating the error rate on subsets of that pilot data. As figure2and table2make clear, se-lecting the optimal hyperparameters for each sub-set of the pilot data generally produces better ex-trapolation results. Figure1 shows how different ways of choosing hyperparameters can affect ex-trapolation. As that figure shows, hyperparame-ters optimised on 50% of the training data perform very badly on 1% of the training data. As figure2
shows, this can lead simpler extrapolation models such as the power-law to dramatically underesti-mate the error on the full dataset. Interestingly, more complex extrapolation models, such as the extended power-law model, often do much better.
==0.1 <=0.1 ==0.5 <=0.5
ag_ne
ws
amaz
on_re
vie
w_full
dbpedia
y
elp_re
vie
w_polar
ity
1 n n/e*(1−e) 1 n n/e*(1−e) 1 n n/e*(1−e) 1 n n/e*(1−e) −0.25
−0.20 −0.15 −0.10 −0.05 0.00 0.05
−0.075 −0.050 −0.025 0.000
−0.03 −0.02 −0.01 0.00
−0.01 0.00
Extrapolation
[image:4.595.78.525.63.338.2]b*n^c a+b*n^−1/2 a+b*n^c
Figure 2: Residuals on 8 runs when extrapolating from pilot data consisting of0.1or0.5of each devel-opment training corpus. They-axis shows the residual error (the difference between the predicted error and the minimum error when the classifier is trained on all the training data), and thex-axis indicates the weight function used in extrapolation. Colours indicate the model fitted, (i.e., power-law (eˆ(n) = bnc), inverse square-root (eˆ(n) =a+bn−1/2), or biased power-law (eˆ(n) =a+bnc) models). Facets indicate
the development corpus used, and whether hyperparameters were optimised only once on all of the pilot data (e.g.,= 0.5and= 0.1) or on each subset of the pilot data (e.g.,≤0.5and≤0.1).
Corpus Labels Train (K) Test (K)
ag news 4 120 7.6
dbpedia 14 560 70
amazon review full 5 3,000 650 yelp review polarity 2 560 38
amazon review polarity 2 3,600 400 sogou news 5 450 60 yahoo answers 10 1,400 60 yelp review full 5 650 50
Table 1: Summary statistics of the development corpora (above line) and evaluation corpora (be-low line).
item weights (n/e(1−e)) as the model to evaluate
on the evaluation corpora.
We evaluate an extrapolation by calculating the root-mean-square (RMS) of the relative residuals ˆ
e/e−1, whereeis the minimum error achieved by the classifier with any hyperparameter setting when trained on the full training set, and ˆeis the predicted error made by the extrapolation model
Pilot data
amazon review polarity
sogou
news answersyahoo yelp review
full
Overall
= 0.1 0.1016 0.2752 0.0519 0.0496 0.1510
≤0.1 0.0209 0.1900 0.0264 0.0406 0.0986
= 0.5 0.0338 0.0438 0.0254 0.0160 0.0315
[image:4.595.75.285.467.574.2]≤0.5 0.0049 0.0390 0.0053 0.0046 0.0200
Table 2: RMS relative residuals (ˆe/e−1) on the four evaluation corpora over all runs for the biased power law model (eˆ(n) =a+bnc) with binomial item weights (n/e(1−e)). Lower scores are better.
from the pilot dataset.1
Unsurprisingly, Table 2 shows that extrapola-tion is more accurate from larger pilot datasets; increasing the size of the pilot dataset 5 times
re-1
[image:4.595.304.536.469.552.2]duces the RMS relative residuals by a factor of 10. It also clearly shows that it valuable to per-form hyperparameter optimisation on all subsets of the pilot dataset, not just on the whole pilot data. Interestingly, Table 2 shows that the RMS difference between the two approaches to hyper-parameter setting is greater when the pilot data is larger. This makes sense; the hyperparameters that are optimal on a large pilot dataset may be far from optimal on a very small subset (this is clearly visi-ble in Figure1, where the items deviating most are those for the= 0.5pilot data and hyperparameter choice).
5 Conclusions and Future Work
This paper introduced an extrapolation methodol-ogy for predicting accuracy on large dataset from a small pilot dataset, applied it to a document clas-sification system, and identified the biased power-law model with binomial weights as a good base-line extrapolation model. This only scratches the surface of performance extrapolation tasks. We hope that teams with greater computational re-sources will study the extrapolation task for com-putationally more-demanding systems, including popular deep learning models. The power-law models should be considered baselines for more sophisticated extrapolation models, which might exploit more information than just accuracy on subsets of the pilot data.
We hope this work will spur the development of better methods for estimating the resources needed to build an NLP or ML system to meet a specifica-tion, as we believe this is essential for any mature engineering field.
Acknowledgments
We would like to thank the anonymous review-ers for their insightful comments and sugges-tions. This research was supported by a Google award through the Natural Language Understand-ing Focused Program, and under the Australian Research Council’s Discovery Projects funding scheme (project number DP160102156).
References
M. Banko and Eric Brill. 2001. Mitigating the paucity-of-data problem: Exploring the effect of training corpus size on classifier performance for natural
lan-guage processing. InHuman Language Technology
Conference : Proceedings of HLT 2001 : First Inter-national Conference on Human Language Technol-ogy Research. Morgan Kaufmann.
Antonio Valerio Miceli Barone, Barry Haddow, Ulrich Germann, and Rico Sennrich. 2017. Regularization techniques for fine-tuning in neural machine
transla-tion. CoRRabs/1707.09920.
Claudia Beleites, Ute Neugebauer, Thomas Bocklitz, Christoph Krafft, and J¨urgen Popp. 2013. Sample
size planning for classification models. Analytica
chimica acta760:25–33.
J. Cho, K. Lee, E. Shin, G. Choy, and S. Do. 2015. How much data is needed to train a medical image deep learning system to achieve necessary high
ac-curacy? arXiv:1511.06348.
Jacob Cohen. 1992. A power primer. Psychological
bulletin112(1):155.
Pedro Domingos. 2000a. A unified bias-variance
de-composition. InProceedings of 17th International
Conference on Machine Learning. pages 231–238.
Pedro Domingos. 2000b. A unified bias-variance
decomposition for zero-one and squared loss.
AAAI/IAAI2000:564–569.
Rosa L Figueroa, Qing Zeng-Treitler, Sasikiran Kan-dula, and Long H Ngo. 2012. Predicting sample size
required for classification performance. BMC
medi-cal informatics and decision making12(1):8.
Stuart Geman, Elie Bienenstock, and Ren´e Dour-sat. 1992. Neural networks and the bias/variance
dilemma. Neural Computation4:1–58.
Karimollah Hajian-Tilaki. 2014. Sample size estima-tion in diagnostic test studies of biomedical
infor-matics. Journal of biomedical informatics48:193–
204.
David Haussler, Michael Kearns, H. Sebastian Seung, and Naftali Tishby. 1996. Rigorous learning curve
bounds from statistical mechanics. Machine
Learn-ing25(2).
Joel Hestness, Sharan Narang, Newsha Ardalani, Gre-gory Diamos, Heewoo Jun, Hassan Kianinejad, Md. Mostofa Ali Patwary, Yang Yang, and Yanqi Zhou. 2017. Deep learning scaling is predictable, empiri-cally.arXiv:1712.00409.
Armand Joulin, Edouard Grave, Piotr Bojanowski, and Tomas Mikolov. 2016. Bag of tricks for efficient text classification.arXiv:1607.01759.
Sayan Mukherjee, Pablo Tamayo, Simon Rogers, Ryan Rifkin, Anna Engle, Colin Campbell, Todd R Golub, and Jill P Mesirov. 2003. Estimating dataset size requirements for classifying DNA microarray data.
Chen Sun, Abhinav Shrivastava, Saurabh Singh,
and Abhinav Gupta. 2017. Revisiting
unreason-able effectiveness of data in deep learning era.