Tables as Semi-structured Knowledge for Question Answering
Sujay Kumar JauharCarnegie Mellon University Pittsburgh, PA, USA [email protected]
Peter D. Turney
Allen Institute for Artificial Intelligence Seattle, WA, USA
Eduard Hovy
Carnegie Mellon University Pittsburgh, PA, USA [email protected]
Abstract
Question answering requires access to a knowledge base to check facts and rea-son about information. Knowledge in the form of natural language text is easy to ac-quire, but difficult for automated reason-ing. Highly-structured knowledge bases can facilitate reasoning, but are difficult to acquire. In this paper we explore tables as a semi-structured formalism that pro-vides a balanced compromise to this trade-off. We first use the structure of tables to guide the construction of a dataset of over 9000 multiple-choice questions with rich alignment annotations, easily and ef-ficiently via crowd-sourcing. We then use this annotated data to train a semi-structured feature-driven model for ques-tion answering that uses tables as a knowl-edge base. In benchmark evaluations, we significantly outperform both a strong un-structured retrieval baseline and a highly-structured Markov Logic Network model.
1 Introduction
Question answering (QA) has emerged as a prac-tical research problem for pushing the boundaries of artificial intelligence (AI). Dedicated projects and open challenges to the research community in-clude examples such as Facebook AI Research’s challenge problems for AI-complete QA (Weston et al., 2015) and the Allen Institute for AI’s (AI2) Aristo project (Clark, 2015) along with its recently completed Kaggle competition1. The reason for
this emergence is the diversity of core language and reasoning problems that a complex, integrated
1https://www.kaggle.com/c/
the-allen-ai-science-challenge
task like QA exposes: information extraction (Sri-hari and Li, 1999), semantic modelling (Shen and Lapata, 2007; Narayanan and Harabagiu, 2004), logic and reasoning (Moldovan et al., 2003), and inference (Lin and Pantel, 2001).
Complex tasks such as QA require some form of knowledge base to store facts about the world and reason over them. By knowledge base, we mean any form of knowledge: structured (e.g., ta-bles, ontologies, rules) or unstructured (e.g., nat-ural language text). For QA, knowledge has been harvested and used in a number of different modes and formalisms: large-scale extracted and curated knowledge bases (Fader et al., 2014), structured models such as Markov Logic Networks (Khot et al., 2015), and simple text corpora in information retrieval approaches (Tellex et al., 2003).
There is, however, a fundamental trade-off in the structure and regularity of a formalism and its ability to be curated, modelled or reasoned with easily. For example, simple text corpora contain no structure, and are therefore hard to reason with in a principled manner. Nevertheless, they are eas-ily and abundantly available. In contrast, Markov Logic Networks come with a wealth of theoretical knowledge connected with their usage in princi-pled inference. However, they are difficult to in-duce automatically from text or to build manually. In this paper we explore tables as semi-structured knowledge for multiple-choice question (MCQ) answering. Specifically, we focus on ta-bles that represent general knowledge facts, with cells that contain free-form text (Secton 3 details the nature and semantics of these tables). The structural properties of tables, along with their free-form text content represents a semi-structured balanced compromise in the traoff between de-gree of structure and ubiquity. We present two main contributions, with tables and their structural properties playing a crucial role in both. First,
we crowd-source a collection of over 9000 MCQs with alignment annotations to table elements, us-ing tables as guidelines in efficient data harvest-ing. Second, we develop a feature-driven model that uses these MCQs to perform QA, while fact-checking and reasoning over tables.
Others have used tables in the context of QA. Question bank creation for tables has been inves-tigated (Pasupat and Liang, 2015), but without structural guidelines or the alignment information that we propose. Similarly, tables have been used in QA reasoning (Yin et al., 2015b; Neelakantan et al., 2015; Sun et al., 2016) but have not explic-itly attempted to encode all the semantics of ta-ble structure (see Section 3.1). To the best of our knowledge, no previous work uses tables for both creation and reasoning in a connected framework. We evaluate our model on MCQ answering for three benchmark datasets. Our results consis-tently and significantly outperform a strong re-trieval baseline as well as a Markov Logic network model (Khot et al., 2015). We thus show the ben-efits of semi-structured data and models over un-structured or highly-un-structured counterparts. We also validate our curated MCQ dataset and its an-notations as an effective tool for training QA mod-els. Finally, we find that our model learns general-izations that permit inference when exact answers may not even be contained in the knowledge base.
2 Related Work
Our work with tables, semi-structured knowledge bases and QA relates to several parallel lines of research. In terms of dataset creation via crowd-sourcing, Aydin et al. (2014) harvest MCQs via a gamified app, although their work does not involve tables. Pasupat and Liang (2015) use tables from Wikipedia to construct a set of QA pairs. However their annotation setup does not impose structural constraints from tables, and does not collect fine-grained alignment to table elements.
On the inference side Pasupat and Liang (2015) also reason over tables to answer questions. Un-like our approach, they do not require alignments to table cells. However, they assume knowledge of the table that contains the answer, a priori – which we do not. Yin et al. (2015b) and Neelakantan et al. (2015) also use tables in the context of QA, but deal with synthetically generated query data. Sun et al. (2016) perform cell search over web tables via relational chains, but are more generally
inter-ested in web queries. Clark et al. (2016) combine different levels of knowledge for QA, including an integer-linear program for searching over table cells. None of these other efforts leverage tables for generation of data.
Our research more generally pertains to natu-ral language interfaces for databases. Answer-ing questions in this context refers to executAnswer-ing queries over relational databases (Cafarella et al., 2008; Pimplikar and Sarawagi, 2012). Yin et al. (2015a) consider databases where information is stored in n-tuples, which are essentially ta-bles. Also, investigation of the relational structure of tables is connected with research on database schema analysis and induction (Venetis et al., 2011; Syed et al., 2010). Finally, unstructured text and structured formats links to work on open infor-mation extraction (Etzioni et al., 2008) and knowl-edge base population (Ji and Grishman, 2011).
3 Tables as Semi-structured Knowledge Representation
Tables can be found on the web containing a wide range of heterogenous data. To focus and fa-cilitate our work on QA we select a collection of tables that were specifically designed for the task. Specifically we use AI2’s Aristo Tablestore2.
However, it should be noted that the contributions of this paper are not tied to specific tables, as we provide a general methodology that could equally be applied to a different set of tables. The struc-tural properties of this class of tables is further de-scribed in Section 3.1.
The Aristo Tablestore consists of 65 hand-crafted tables organized by topic. Some of the topics are bounded, containing only a fixed num-ber of facts, such as the possible phase changes of matter (see Table 1). Other topics are unbounded, containing a very large or even infinite number of facts, such as the kind of energy used in perform-ing an action (the correspondperform-ing tables can only contain a sample subset of these facts). A total of 3851 facts (one fact per row) are present in the manually constructed tables. An individual table has between 2 and 5 content columns.
The target domain for these tables is two 4th grade science exam datasets. The majority of the tables were constructed to contain topics and facts
2http://allenai.org/content/data/
Phase Change Initial State Final State Form of Energy Transfer Melting causes a solid to change into a liquid by adding heat Vaporization causes a liquid to change into a gas by adding heat Condensation causes a gas to change into a liquid by removing heat
Sublimation causes a solid to change into a gas by adding heat
Table 1: Part of a table concerning phase changes in matter. Rows are facts. Columns without header text provide filler text, so that each row forms a sentence. In columns with header text, the header describes the type of entry in the column; the header is a hypernym of the text in the body below.
from the publicly available Regents dataset3. The
rest were targeted at an unreleased dataset called Monarch. In both cases only the training partition of each dataset was used to formulate and hand-craft tables. However, for unbounded topics, addi-tional facts were added to each table, using science education text books and websites.
3.1 Table Semantics and Relations
Part of a table from the Aristo Tablestore is given as an example in Table 1. The format is semi-structured: the rows of the table (with the excep-tion of the header) are a list of sentences, but with well-defined recurring filler patterns. Together with the header, these patterns divide the rows into meaningful columns. This semi-structured data format is flexible. Since facts are presented as sentences, the tables can act as a text corpus for information retrieval. At the same time the struc-ture can be used – as we do – to focus on specific nuggets of information. The flexibility of these ta-bles allows us to compare our table-based system to an information retrieval baseline.
Such tables have some interesting structural se-mantics, which we will leverage throughout the paper. A row in a table corresponds to a fact4.
The cells in a row correspond to concepts, enti-ties, or processes that participate in this fact. A content column5 corresponds to a group of
con-cepts, entities, or processes that are the sametype. The header cell of the column is an abstract de-scription of the type. We may view the head as a hypernym and the cells in the column below as co-hyponyms of the head. The header row defines a generalization of which the rows in the table are specific instances.
This structure is directly relevant to multiple-choice QA. Facts (rows) form the basis for
creat-3http://allenai.org/content/data/
Regents.zip
4Also predicates, or more generally frames with typed ar-guments.
5Different from filler columns, which only contain a re-curring pattern, and no information in their header cells.
ing or answering questions, while instances of a type (columns) act as the choices of an MCQ. We use these observations both for crowd-sourcing MCQ creation as well as for designing features to answer MCQs with tables.
4 Crowd-sourcing Multiple-choice Questions from Tables
We use Amazon’s Mechanical Turk (MTurk) ser-vice to generate MCQs by imposing constraints derived from the structure of the tables. These constraints help annotators create questions with scaffolding information, and lead to consistent quality in the generated output. An additional ben-efit of this format is the alignment information, linking cells in the tables to the MCQs generated by the Turkers. The alignment information is gen-erated as a by-product of making the MCQs.
We present Turkers with a table such as the one in Figure 1. Given this table, we choose a target cell to be the correct answer for a new MCQ; for example, the red cell in Figure 1. First, Turkers create a question by using information from the rest of the row containing the target (i.e., the blue cells in Figure 1), such that the target is its cor-rect answer. Then they select the cells in the row that they used to construct the question. Follow-ing this, they construct four succinct choices for the question, one of which is the correct answer and the other three are distractors. Distractors are formed from other cells in the column containing the target (i.e. yellow cells in Figure 1). If there are insufficient unique cells in the column Turk-ers create their own. Annotators can rephrase and shuffle the contents of cells as required.
Figure 1: Example table from MTurk annotation task illustrating constraints. We ask Turkers to construct questions from blue cells, such that the red cell is the correct answer, and yellow cells form distractors.
Task Avg. Time (s) $/hour % Reject
Rewrite 345 2.61 48
Paraphrase 662 1.36 49
Add choice 291 2.47 24
Write new 187 5.78 38
[image:4.595.81.281.228.291.2]TabMCQ 72 5.00 2
Table 2: Comparison of different ways of generat-ing MCQs with MTurk.
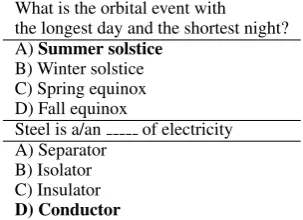
What is the orbital event with the longest day and the shortest night? A)Summer solstice
B) Winter solstice C) Spring equinox D) Fall equinox
Steel is a/an of electricity A) Separator
B) Isolator C) Insulator D) Conductor
Table 3: Examples of MCQs generated by MTurk. Correct answer choices are in bold.
4.1 The TabMCQ Dataset
We created a HIT (the MTurk acronym for Hu-man Intelligence Task) for every non-filler cell (see Section 3) from each one of the 65 manually constructed tables of the Aristo Tablestore. We paid annotators 10 cents per MCQ, and asked for 1 annotation per HIT for most tables. For an initial set of four tables which we used in a pilot study, we asked for three annotations per HIT6. We
re-quired Turkers to have a HIT approval rating of 95% or higher, with a minimum of at least 500 HITs approved. We restricted the demographics of our workers to the US.
Table 2 compares our method with other studies conducted at AI2 to generate MCQs. These meth-ods attempt to generate new MCQs from existing
6The goal was to obtain diversity in the MCQs created for a target cell. The results were not sufficiently conclusive to warrant a threefold increase in the cost of creation.
ones, or write them from scratch, but do not in-volve tables in any way. Our annotation procedure leads to faster data creation, with consistent out-put quality that resulted in the lowest percentage of rejected HITs. Manual inspection of the gener-ated output also revealed that questions are of con-sistently good quality. They are good enough for training machine learning models and many are good enough as evaluation data for QA. A sample of generated MCQs is presented in Table 3.
We implemented some simple checks to eval-uate the data before approving HITs. These in-cluded things like checking whether an MCQ has at least three choices and whether choices are re-peated. We had to further prune our data to dis-card some MCQs due to corrupted data or badly constructed MCQs. A total of 159 MCQs were lost through the cleanup. In the end our com-plete data consists of 9092 MCQs, which is – to the best of our knowledge – orders of magnitude larger than any existing collection of science exam style MCQs available for research. These MCQs also come with alignment information to tables, rows, columns and cells. The dataset, bundled to-gether with the Aristo Tablestore, can be freely downloaded7.
5 Solving MCQs with Table Cell Search Consider the MCQ “What is the process by which water is changed from a liquid to a gas?” with choices “melting, sublimation, vaporization, con-densation”, and the table given in Figure 1. Find-ing the correct answer amounts to findFind-ing a cell in the table that is most relevant to a candidate QA pair. In other words, a relevant cell should confirm the assertion made by a particular QA pair.
By applying the reasoning used to create MCQs
7http://ai2-website.s3.amazonaws.com/
[image:4.595.105.257.338.448.2](see Section 4) in the inverse direction, finding these relevant cells becomes the task of finding an intersection between rows and columns of interest. Consider the table in Figure 1: assuming we have some way of aligning a question to a row (blue cells) and choices to a column (yellow cells), then the relevant cell is at the intersection of the two (the red cell). This alignment is precisely what we get as a by-product of the annotation task we setup in Section 4 to harvest MCQs.
We can thus featurize connections between MCQs and elements of tables and use the align-ment data to train a model over the features. This is outlined in the next section, describing our Fea-ture Rich Table Embedding Solver (FRETS).
5.1 Model and Training Objective
LetQ = {q1, ..., qN}denote a set of MCQs, and
An ={a1n, ..., akn}be the set of candidate answer
choices for a given questionqn. Let the set of
ta-bles be defined asT ={T1, ..., TM}. Given a
ta-bleTm, lettijmbe the cell in that table
correspond-ing to theith row andjth column.
We define a log-linear model that scores every celltijm of every table in our collection according
to a set of discrete weighted features, for a given QA pair. We have the following:
logp(tijm|qn, akn;An,T) =
X
d
λdfd(qn, akn, tmij;An,T)−logZ (1)
Hereλdare weights andfd(qn, ank, tijm;An,T)are
features. These features should ideally leverage both structure and content of tables to assign high scores to relevant cells, while assigning low scores to irrelevant cells. Z is the partition function, de-fined as follows:
Z =
X
m,i,j
exp X
d
λdfd(qn, akn, tijm;An,T)
! (2)
Znormalizes the scores associated with every cell over all the cells in all the tables to yield a prob-ability distribution. During inference the partition termlogZcan be ignored, making scoring cells of every table for a given QA pair efficient.
These scores translate to a solution for an MCQ. Every QA pair produces a hypothetical fact, and as noted in Section 3.1, the row of a table is in
essence a fact. Relevant cells (if they exist) should confirm the hypothetical fact asserted by a given QA pair. During inference, we assign the score of the highest scoring row (or the most likely fact) to a hypothetical QA pair. Then the correct solu-tion to the MCQ is simply the answer choice as-sociated with the QA pair that was assigned the highest score. Mathematically, this is expressed as follows:
a∗
n= arg max akn maxm,i
X
j
X
d
λdfd(qn, akn, tijm;An,T) (3)
5.1.1 Training
Since FRETS is a log-linear model, training in-volves optimizing a set of weightsλd. As
train-ing data, we use alignment information between MCQs and table elements (see Section 4.1). The predictor value that we try to maximize with our model is an alignment score that is closest to the true alignments in the training data. True align-ments to table cells for a given QA pair are es-sentially indicator values but we convert them to numerical scores as follows8. For a correct QA
hypothesis we assign a score of 1.0 to cells whose row and column and both aligned to the MCQ (i.e. cells that exactly answer the question), 0.5 to cells whose row but not column is aligned in some way to the question (i.e. cells that were used to construct the question), and 0.0 otherwise. For an incorrect QA hypothesis we assign a score of 0.1 to random cells from tables that contain no alignments to the QA (so all except one), with a probability of 1%, while all other cells are scored 0.0. The intuition behind this scoring scheme is to guide the model to pick relevant cells for cor-rect answers, while encouraging it to pick faulty evidence with low scores for incorrect answers.
Given these scores assigned to all cells of all ta-bles for all QA pairs in the training set, suitably normalized to a probability distribution over ta-bles for a given QA pair, we can then proceed to train our model. We use cross-entropy, which min-imizes the following loss:
Level Feature Description Intuition S-Var Cmpct Table Table score†TF-IDF table score Ratio of words inSame but TF-IDF weightsttoq+a Topical consistencyTopical consistency ♦♦
Row-question score Ratio of words inrtoq Question align ♦
Row Row-question w/o focus score Ratio of words inrtoq-(af+qf) Question align ♦
Header-question score Ratio of words inhtoq Prototype align ♦
Column overlap Ratio of elements incandA Choices align ♦
Column Header answer-type match Ratio of words inchtoaf Choices hypernym align ♦
Header question-type match Ratio of words inchtoqf Question hypernym align ♦ †Cell salience Salience ofstoq+a QA hypothesis assert ♦
Cell †Cell answer-type entailment Entailment score betweensandaf Hypernym-hyponym align
Cell answer-type similarity Avg. vector sim betweensandaf Hypernym-hyponym sim.
Table 4: Summary of features. For a question (q) and answer (a) we compute scores for elements of tables: whole tables (t), rows (r), header rows (h), columns (c), column headers (ch) and cells (s). Answer-focus (af) and question-focus (qf) terms added where appropriate. Features marked♦ denote soft-matching variants, marked with while those marked with a†are described in further detail in Sec-tion 5.2. Finally, features denote those that received high weights during training with all features, and were subsequently selected to form a compact FRETS model.
L(~λ) = X
qn
ak n∈An
X
m,i,j
p(t∗ij
m |qn, akn;T)·
logp(tij
m|qn, akn;An,T) (4)
Herep(t∗mij|qn, akn;T)is the normalized
probabil-ity of the true alignment scores.
While this is an indirect way to train our model to pick the best answer, in our pilot experiments it worked better than direct maximum likelihood or ranking with hinge loss, achieving a training accuracy of almost 85%. Our experimental re-sults on the test suite, presented in the next section, also support the empirical effectiveness of this ap-proach.
5.2 Features
The features we use are summarized in Ta-ble 4. These features compute statistics be-tween question-answer pairs and different struc-tural components of tables. While the features are weighted and summed for each cell individually, they can capture more global properties such as scores associated with tables, rows or columns in which the specific cell is contained. Features are divided into four broad categories based on the level of granularity at which they operate. In what follows we give some details of Table 4 that re-quire further elaboration.
5.2.1 Soft matching
Many of the features that we implement are based on string overlap between bags of words. How-ever, since the tables are defined statically in terms
of a fixed vocabulary (which may not necessarily match words contained in an MCQ), these over-lap features will often fail. We therefore soften the constraint imposed by hard word overlap by a more forgiving soft variant. More specifically we introduce a word-embedding based soft match-ing overlap variant for every feature in the table marked with♦. The soft variant targets high recall while the hard variant aims at providing high pre-cision. We thus effectively have almost twice the number of features listed.
Mathematically, let a hard overlap feature de-fine a score|S1∩S2|/|S1|between two bags of wordsS1 andS2. We can define the denominator
S1here, without loss of generality. Then, a corre-sponding word-embedding soft overlap feature is given by this formula:
1 |S1|
X
wi∈S1
max
wj∈S2sim(w~i, ~wj) (5)
Intuitively, rather than matching a word to its exact string match in another set, we instead match it to its most similar word, discounted by the score of that similarity.
5.2.2 Question parsing
By carefully studying the kinds of question pat-terns in our data, we implemented a rule-based parser that finds answer-types from queries. This parser uses a set of hand-coded regular expres-sions over phrasal chunks. The parser is designed to have high accuracy, so that we only produce an output for answer-types in high confidence situa-tions. In addition to producing answer-types, in some rarer cases we also detect hypernyms for parts of the questions. We call this set of words question-type words. Together, the question-type and answer-type words are denoted as focus words in the question.
5.2.3 TF-IDF weighting
TF-IDF scores for weighting terms are pre-computed for all words in all the tables. We do this by treating every table as a unique document. At run-time we discount scores by table length as well as length of the QA pair under consideration to avoid disproportionately assigning high scores to large tables or long MCQs.
5.2.4 Salience
The salience of a string for a particular QA pair is an estimate of how relevant it is to the hypoth-esis formed from that QA pair. It is computed by taking words in the question, pairing them with words in an answer choice and then computing PMI statistics between these pairs from a large corpus. A high salience score indicates words that are particularly relevant for a given QA pair hy-pothesis.
5.2.5 Entailment
To calculate the entailment score between two strings, we use several features, such as overlap, paraphrase probability, lexical entailment likeli-hood, and ontological relatedness, computed with n-grams of varying lengths.
5.2.6 Normalization
All the features in Table 4 produce numerical scores, but the range of these scores vary to some extent. To make our final model more robust, we normalize all feature scores to have a range be-tween 0.0 and 1.0. We do this by finding the maxi-mum and minimaxi-mum values for any given feature on a training set. Subsequently, instead of using the raw feature value of a feature fd, we instead
re-place it with(fd−minfd)/(maxfd−minfd).
6 Experimental Results
We train FRETS (Section 5) on the TabMCQ dataset (Section 4) using adaptive gradient descent with an L2 penalty of 1.0 and a mini-batch size of 500 training instances. We train two variants: one consisting of all the features from Table 4, the other – a compact model – consisting of the most important features (above a threshold) from the first model by feature-weight. These features are noted by in the final column of Table 4.
We run experiments on three 4th grade science exam MCQ datasets: the publicly available Re-gents dataset, the larger but unreleased dataset called Monarch, and a third even larger public dataset of Elementary School Science Questions (ESSQ)9. For the first two datasets we use the test
splits only, since the training sets were directly studied to construct the Aristo Tablestore, which was in turn used to generate our TabMCQ training data. On ESSQ we use all the questions since they are independent of the tables. The Regents test set consists of 129 MCQs, the Monarch test set of 250 MCQs, and ESSQ of 855 MCQs.
Since we are investigating semi-structured mod-els, we compare against two baselines. The first is an unstructured information retrieval method, which uses the Lucene search engine. To ap-ply Lucene to the tables, we ignore their struc-ture and simply use rows as plain-text sentences. The score for top retrieved hits are used to rank the different choices of MCQs. The second base-line is the highly-structured Markov-logic Net-work (MLN) model from Khot et al. (2015) as re-ported in Clark et al. (2016), who use the model as a baseline10. Note that Clark et al. (2016) achieve
a score of 71.3 on Regents Test, which is higher than FRETS’ scores (see Table 5), but their results are not comparable to ours because they use an ensemble of algorithms. In contrast, we use a sin-gle algorithm with a much smaller collection of knowledge. FRETS rivals the best individual al-gorithm from their work.
We primarily use the tables from the Aristo Ta-blestore as knowledge base data in three different settings: with only tables constructed for Regents (40 tables), with only supplementary tables con-structed for Monarch (25 tables), and with all
ta-9http://aristo-public-data.s3.
amazonaws.com/AI2-Elementary-NDMC-Feb2016. zip
Model Data Regents Test Monarch Test ESSQ
Lucene
Regents Tables 37.5 32.6 36.9
Monarch Tables 28.4 27.3 27.7
Regents+Monarch Tables 34.8 35.3 37.3
Waterloo Corpus 55.4 51.8 54.4
MLN 47.5
(Khot et al., 2015)
Regents Tables 60.7 47.2 51.0
FRETS Monarch Tables 56.0 45.6 48.4
(Compact) Regents+Monarch Tables 59.9 47.6 50.7
Regents Tables 59.1 52.8 54.4
FRETS Monarch Tables 52.9 49.8 49.5
[image:8.595.131.468.60.195.2]Regents+Monarch Tables 59.1 52.4 54.9
Table 5: Evaluation results on three benchmark datasets using different sets of tables as knowledge bases. Best results on a dataset are highlighted in bold.
bles together (all 65 tables; see Section 3). For the Lucene baseline we also experiment with several orders of magnitude more data by indexing over the5×1010words Waterloo corpus compiled by Charles Clarke at the University of Waterloo. Data is not a variable for MLN, since we directly cite results from Clark et al. (2016).
The word vectors we used in soft matching fea-ture variants (i.e., ♦ features from Table 4) for all our experiments were trained on 300 million words of Newswire English from the monolingual section of the WMT-2011 shared task data. These vectors were improved post-training by retrofitting (Faruqui et al., 2014) them to PPDB (Ganitkevitch et al., 2013).
The results of these experiments is presented in Table 5. All numbers are reported in percentage accuracy. We perform statistical significance test-ing on these results ustest-ing Fisher’s exact test with a p-value of0.05and report them in our discussions. First, FRETS – in both full and compact form – consistently outperforms the baselines, often by large margins. For Lucene, the improvements over all but the Waterloo corpus baseline are statisti-cally significant. Thus FRETS is able to capital-ize on data more effectively and rival an unstruc-tured model with access to orders of magnitude more data. For MLN, the improvements are sta-tistically significant in the case ofRegentsand Re-gents+Monarchtables. FRETS is thus performing better than a highly structured model while mak-ing use of a much simpler data formalism.
Our models are able to effectively generalize. With Monarch tables, the Lucene baseline is lit-tle better than random (25%). But with the same knowledge base data, FRETS is competitive and sometimes scores higher than the best Lucene or MLN models (although this difference is
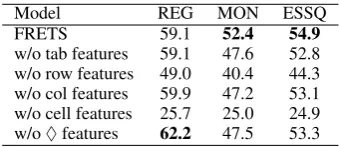
statisti-Model REG MON ESSQ
FRETS 59.1 52.4 54.9
w/o tab features 59.1 47.6 52.8 w/o row features 49.0 40.4 44.3 w/o col features 59.9 47.2 53.1 w/o cell features 25.7 25.0 24.9 w/o♦features 62.2 47.5 53.3 Table 6: Ablation study on FRETS, removing groups of features based on level of granularity.♦
refers to the soft matching features from Table 4. Best results on a dataset are highlighted in bold.
cally insignificant). These results indicate that our models are able to effectively capture both con-tent and structure, reasoning approximately (and effectively) when the knowledge base may not even contain the relevant information to answer a question. The Monarch tables themselves seem to add little value, since results for Regents tables by themselves are just as good or better than Re-gents+Monarch tables. This is not a problem with FRETS, since the same phenomenon is witnessed with the Lucene baseline. It is noteworthy, how-ever, that our models do not suffer from the addi-tion of more tables, showing that our search pro-cedure over table cells is robust.
Finally, dropping some features in the compact model doesn’t always hurt performance, in com-parison with the full model. This indicates that potentially higher scores are possible by a prin-cipled and detailed feature selection process. In these experiments the difference between the two FRETS models on equivalent data is statistically insignificant.
6.1 Ablation Study
[image:8.595.331.501.247.321.2]model, and re-training. Evaluation of these partial models is given in Table 6. In this experiment we use all tables as knowledge base data.
Judging by relative score differential, cell fea-tures are by far the most important group, fol-lowed by row features. In both cases the drops in score are statistically significant. Intuitively, these results make sense, since row features are crucial in alignment to questions, while cell fea-tures capture the most fine-grained properties. It is less clear which among the other three feature groups is dominant, since the differences are not statistically significant. It is possible that cell fea-tures replicate information of other feature groups. For example, the cell answer-type entailment fea-ture indirectly capfea-tures the same information as the header answer-type match feature (a column feature). Similarly, salience captures weighted statistics that are roughly equivalent to the coarse-grained table features. Interestingly, the success of these fine-grained features would explain our im-provements over the Lucene baseline in Table 5, which is incapable of such fine-grained search.
7 Conclusions
We have presented tables as knowledge bases for question answering. We explored a connected framework in which tables are first used to guide the creation of MCQ data with alignment infor-mation to table elements, then jointly with this data are used in a feature-driven model to answer unseen MCQs. A central research question of this paper was the trade-off between the degree of structure in a knowledge base and its ability to be harvested or reasoned with. On three bench-mark evaluation sets our consistently and signif-icantly better scores over an unstructured and a highly-structured baseline strongly suggest that ta-bles can be considered a balanced compromise in this trade-off. We also showed that our model is able to generalize from content to structure, thus reasoning about questions whose answer may not even be contained in the knowledge base.
We are releasing our dataset of more than 9000 MCQs and their alignment information, to the re-search community. We believe it offers interesting challenges that go beyond the scope of this paper – such as question parsing, or textual entailment – and are exciting avenues for future research.
Acknowledgement
We’d like to thank AI2 for funding this research and the creation of our MCQ dataset. The first and third authors of this paper were also supported in part by the following grants: NSF grant IIS-1143703, NSF award IIS-1147810, DARPA grant FA87501220342. Thanks also go to the anony-mous reviewers, whose valuable comments helped to improve the quality of the paper.
References
Bahadir Ismail Aydin, Yavuz Selim Yilmaz, Yaliang Li, Qi Li, Jing Gao, and Murat Demirbas. 2014. Crowdsourcing for multiple-choice question an-swering. InTwenty-Sixth IAAI Conference.
Michael J Cafarella, Alon Halevy, Daisy Zhe Wang, Eugene Wu, and Yang Zhang. 2008. Webtables: ex-ploring the power of tables on the web.Proceedings of the VLDB Endowment, 1(1):538–549.
Peter Clark, Oren Etzioni, Tushar Khot, Ashish Sab-harwal, Oyvind Tafjord, Peter Turney, and Daniel Khashabi. 2016. Combining retrieval, statistics, and inference to answer elementary science questions.
Proceedings of the 30th AAAI Conference on Arti-ficial Intelligence, AAAI-2016.
Peter Clark. 2015. Elementary school science and math tests as a driver for ai: Take the aristo chal-lenge. Proceedings of IAAI, 2015.
Oren Etzioni, Michele Banko, Stephen Soderland, and Daniel S Weld. 2008. Open information extrac-tion from the web. Communications of the ACM, 51(12):68–74.
Anthony Fader, Luke Zettlemoyer, and Oren Etzioni. 2014. Open question answering over curated and extracted knowledge bases. InProceedings of the 20th ACM SIGKDD international conference on Knowledge discovery and data mining, pages 1156– 1165. ACM.
Manaal Faruqui, Jesse Dodge, Sujay K Jauhar, Chris Dyer, Eduard Hovy, and Noah A Smith. 2014. Retrofitting word vectors to semantic lexicons.
arXiv preprint arXiv:1411.4166.
Juri Ganitkevitch, Benjamin Van Durme, and Chris Callison-Burch. 2013. PPDB: The paraphrase database. In Proceedings of NAACL-HLT, pages 758–764, Atlanta, Georgia, June. Association for Computational Linguistics.
Tushar Khot, Niranjan Balasubramanian, Eric Gribkoff, Ashish Sabharwal, Peter Clark, and Oren Etzioni. 2015. Exploring markov logic networks for question answering. Proceedings of EMNLP, 2015.
Dekang Lin and Patrick Pantel. 2001. Discovery of in-ference rules for question-answering. Natural Lan-guage Engineering, 7(04):343–360.
Dan Moldovan, Christine Clark, Sanda Harabagiu, and Steve Maiorano. 2003. Cogex: A logic prover for question answering. In Proceedings of the 2003 Conference of the North American Chapter of the Association for Computational Linguistics on Hu-man Language Technology-Volume 1, pages 87–93. Association for Computational Linguistics.
Srini Narayanan and Sanda Harabagiu. 2004. Ques-tion answering based on semantic structures. In
Proceedings of the 20th international conference on Computational Linguistics, page 693. Association for Computational Linguistics.
Arvind Neelakantan, Quoc V Le, and Ilya Sutskever. 2015. Neural programmer: Inducing latent pro-grams with gradient descent. arXiv preprint arXiv:1511.04834.
Panupong Pasupat and Percy Liang. 2015. Compo-sitional semantic parsing on semi-structured tables.
arXiv preprint arXiv:1508.00305.
Rakesh Pimplikar and Sunita Sarawagi. 2012. An-swering table queries on the web using column keywords. Proceedings of the VLDB Endowment, 5(10):908–919.
Dan Shen and Mirella Lapata. 2007. Using semantic roles to improve question answering. In EMNLP-CoNLL, pages 12–21.
Rohini Srihari and Wei Li. 1999. Information extrac-tion supported quesextrac-tion answering. Technical re-port, DTIC Document.
Huan Sun, Xiaodong He, Wen-tau Yih, Yu Su, and Xifeng Yan. 2016. Table cell search for question answering. InProceedings of the 25th International Conference on World Wide Web (to appear).
Zareen Syed, Tim Finin, Varish Mulwad, and Anupam Joshi. 2010. Exploiting a web of semantic data for interpreting tables. In Proceedings of the Second Web Science Conference.
Stefanie Tellex, Boris Katz, Jimmy Lin, Aaron Fernan-des, and Gregory Marton. 2003. Quantitative eval-uation of passage retrieval algorithms for question answering. InProceedings of the 26th annual inter-national ACM SIGIR conference on Research and development in informaion retrieval, pages 41–47. ACM.
Petros Venetis, Alon Halevy, Jayant Madhavan, Mar-ius Pas¸ca, Warren Shen, Fei Wu, Gengxin Miao, and Chung Wu. 2011. Recovering semantics of tables on the web. Proc. VLDB Endow., 4(9):528–538, June.
Jason Weston, Antoine Bordes, Sumit Chopra, and Tomas Mikolov. 2015. Towards ai-complete ques-tion answering: a set of prerequisite toy tasks. arXiv preprint arXiv:1502.05698.
Pengcheng Yin, Nan Duan, Ben Kao, Junwei Bao, and Ming Zhou. 2015a. Answering questions with com-plex semantic constraints on open knowledge bases. In Proceedings of the 24th ACM International on Conference on Information and Knowledge Man-agement, pages 1301–1310. ACM.
Pengcheng Yin, Zhengdong Lu, Hang Li, and Ben Kao. 2015b. Neural enquirer: Learning to query tables.