Munich Personal RePEc Archive
Duration of Price Promotion and Retail
Profit: An In-depth Study Based on
Point-of-Sale Data
Li, Zhen and Yada, Katsutoshi and Zennyo, Yusuke
Toyo University, Kansai University, Kobe University
30 March 2019
Online at
https://mpra.ub.uni-muenchen.de/93047/
Duration of Price Promotion and Retail Profit: An In-depth
Study Based on Point-of-Sale Data
Zhen Li
∗Katsutoshi Yada
†Yusuke Zennyo
‡This version: April 1, 2019
Abstract
Anecdotal evidence has shown that retail price promotions can help small and medium-sized retailers
enhance their sales, and thus, retail profits. However, most marketing managers usually stop a
promotion after a certain duration. This study aims to explain why these retailers discontinue
their price promotion. Our approach posits that the promotion’s overall contributions to the total
retail profit progressively diminish with time. We present a theoretical framework to explain the
relationship between duration and profit effects of price promotions and propose a statistical model
to empirically examine this framework using point-of-sale (POS) data. Our findings provide empirical
support that the overall profit effects of price promotions have a downward trend with elapsed time,
upholding the hypothesis. The results are helpful for marketers to understand how price promotions
dynamically influence retail profits and when the promotion should be terminated.
Keyword: Duration of Price Promotion, Elapsed Time, Retail Profit, Customer Traffic, Product Loyalty,
Point-of-Sale Data
1
Introduction
It is widely and frequently observed that many small or medium-sized retailers, such as supermarkets,
regularly reduce the price of some products at irregular times to promote their sales, a process known as
a price promotion. Then, after a duration of the price promotion, marketing managers restore the price
to the regular level. Why do they terminate the price promotion? Furthermore, when should they raise
the price back to its original level?
∗Faculty of Business Administration, Toyo University. (E-mail: [email protected])
Many studies have attempted to provide a reasonable explanation for the above questions. However,
the literature reports mixed results with respect to the effects of price promotions. On the one hand, some
studies have shown that price promotions might be adverse to retailers’ interests under certain conditions
(e.g., Alvarez Alvarez and Vázquez Casielles, 2005; DelVecchio et al., 2006; Dodson et al., 1978; Moore
and Olshavsky, 1989). Although price promotions can contribute to customers’ purchase likelihood in
the short-term, an excessive price-cutting strategy may negatively influence their brand choices in the
long term. That is, an inappropriate price promotion might reduce product loyalty, weaken consumer
perceived value and prospects, lower the reference price, and even erode customer trust in product quality
(e.g., Fibich et al., 2007; Kahneman and Tversky, 1979; Manning and Sprott, 2007). On the other hand,
extensive evidence exists showing the positive effects of price promotion on product switching, retail
profit, product loyalty, and customer traffic (e.g., Ailawadi et al., 2009; Mela et al., 1997; Gupta, 1988).
Specifically, price promotions can effectively boost the likelihood of customers’ visits, increase the sales
volume, and promote the overall retail profit of retailers (e.g., Blattberg and Neslin, 1990; Walters and
Rinne, 1986).
Previous studies have focused on determining the optimal level of price cutting without distinguishing
between the positive and negative effects, (e.g., Campo and Yagüe, 2007; Cui et al., 2016; Martín-Herrán
et al., 2010; Weathers et al., 2015), but few such studies have investigated the optimal duration of
price promotion or discussed factors for deciding when a promotion should be concluded (e.g., Tsiros
and Hardesty, 2010; Bogomolova et al., 2017). From an economics perspective, some evidence exists
suggesting that sales price fluctuations are determined by production costs and supply capacity (Corbett
and De Groote, 2000; Viswanathan and Wang, 2003; Wee, 1999). However, because of difficulties in
explaining the characteristics of promotion duration, those studies do not provide further insight into
why retailers do not continue a price promotion over the long-term or when the promotion should be
terminated.
The general purpose of this paper is to elucidate the dynamics of the effects of price promotions.
We posit that the overall contributions of price promotions to retail profits progressively decrease with
time elapsed after the promotion started. Marketing managers should end the promotion if the effect
of price discounts becomes negative. To that end, this study has two main objectives: (1) confirm
whether the total benefits of price promotions wane over time and (2) investigate how the impacts of
price promotions on retail profits change as time goes on, if any. We present a theoretical model that
yields some predictions and propose a statistical model to empirically examine the dynamic relationship
between elapsed time of price promotion and its effects on marketing outcomes, which include retail
profit, customer traffic, and product loyalty. Continuous point-of-sale (POS) data for a well-known
brand of yogurt in medium-sized chain of supermarkets located in Japan are used in this study. The
exhibit a trend of decays with elapsed time of the promotion.
This study contributes to the existing literature (Esteban-Bravo et al., 2005; Tsiros and Hardesty,
2010), by explaining why and when retailers should end a price promotion, from both theoretical and
empirical perspectives. We provide strong empirical evidence for the decay of promotion effects, which
supports that the overall profit effects of price promotions exhibit a downward process with elapsed
time. Moreover, this study’s findings can help marketing managers understand how price promotions
dynamically influence retail profits and thus how to reasonably and effectively determine the optimal
price promotion duration.
The remainder of this paper is organized as follows. Section 2 describes our theoretical model for
the relationship between duration and profit effects of price promotion, and then offers related empirical
hypotheses. We introduce the methodology, which includes the dataset, measurements, and empirical
model, in Section 3, and present the data analysis and findings in Section 4. Section 5 concludes the
paper by discussing the contributions of this study and the managerial implications and points out further
research directions.
2
Theoretical Model Analysis
The problem of determining the optimal stopping time has attracted considerable attention from
re-searchers in many scientific disciplines (Myneni, 1992). In our case, retailers face two possible actions:
(1) continue the promotion or (2) stop it.
As described above, although price promotions can have somewhat negative effects on product loyalty
or perceived value (Dodson et al., 1978; Jia, 2008; Kahneman and Tversky, 1979), they mainly benefit
retailers by promoting retail profit and attracting customer traffic (Walters and Rinne, 1986). Our
approach posits that the benefits of price promotions to retailers decay over time. Thus, because the
retail profit earned in the promotional period will gradually fall, retailers will end a promotion when
such profit becomes lower than their expected profit without the promotion.
2.1
A Dynamic Model of Price Promotion
We consider a retail storeS which sells a product at a regular price ofp. This product is durable and
assumed to be consumed in T periods (days). We assume that there exist two groups of consumers:
general customers and price-sensitive customers. The mass of all potential consumers is normalized to
1. Denote byαthe fraction of the consumers who are general customers and by1−αthe fraction of the
consumers who are price-sensitive customers.
Suppose that the same town also contains a big-box supermarket, which sells the same product at a
by offering a price discount during a certain period. The store can offer a100r%discount on the regular
price fort periods in order to equalize its price with that of the rival store.
The general customers are assumed to purchase the product at store S.1
In contrast, price-sensitive
customers do not purchase at the regular pricepand then head to the far-away big-box supermarket in
the pursuit of a lower price.2
However, price-sensitive customers will purchase at store S if it offers a
price discounted to the same level as the price set by the big-box supermarket, which they determine by
checking prices prior to shopping.3
We useπto represent the probability that price-sensitive customers
check the price in storeS per period.
We consider the profit-maximization problem of storeS with respect to the price discount duration,
t. Both the regular price and the discount rate are supposed to be exogenously given. Even if we examine
a model in whichpandrare also strategic variables, they are determined at a level wherepand(1−r)p
come to equal to the willingness to pay of general and price-sensitive customers, respectively. Therefore,
the extended analysis that endogenizes these variables has no influence on the subsequent analysis of
this paper.
The profit function of storeS is characterized as
Π(t) = (1−r)p·
t
X
k=1
Dk+p·
T
X
k=t+1
Dk, (1)
whereDk is total demand in periodk. Moreover,dk denotes the demand of general customers in period
kandδk denotes the demand of price-sensitive customers in periodk, that isDk=dk+δk.
To simplify the analysis, we assume that the same number of general customers visit store S every
period. On the other hand, fork≤t,δk can be expressed by the fractionπof price-sensitive customers
who have not yet checked for a price discount up until period k−1. When k > t, no price-sensitive
customers visit storeSto buy because no price discount exists. In sum, the demand functions are given
as follows.
dk =
α
T for k= 1,2,· · ·, T (2)
δk =
(1−α)π if k= 1
(1−α−δk−1)π if k= 2,3,· · ·, t
0 if k=t+ 1, t+ 2,· · ·, T
(3)
1
One can consider that the big-box supermarket is located in the town’s suburbs. Then, general customers incur a higher trip cost for traveling to the big-box supermarket than the price discount they will attain by shopping there.
2
The trip cost of price-sensitive customers is less than the price difference betweenpand(1−r)p. Thus, these customers have an incentive to go to the big-box supermarket in order to save their money.
3
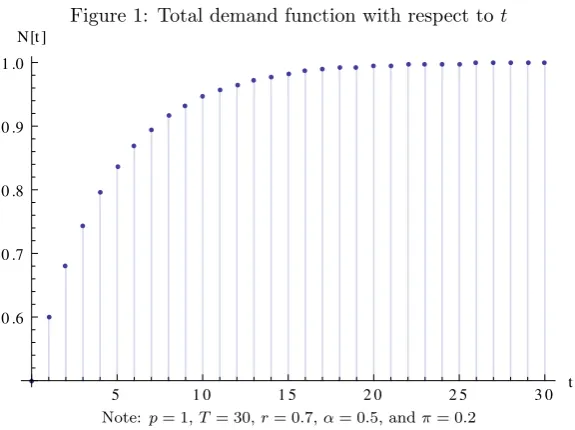
Figure 1: Total demand function with respect tot
5 1 0 1 5 2 0 2 5 3 0 t 0 .6
0 .7 0 .8 0 .9 1 .0
N@tD
Note:p= 1,T = 30,r= 0.7,α= 0.5, andπ= 0.2
Thus, the total number of customers who visit storeS duringT periods can be written as
N(t) =
T
X
k=1
Dk =
T
X
k=1
(dk+δk) =α+ (1−α){1−(1−π)t}. (4)
We can derive the following proposition regarding the price discount’s effect on customer traffic:
Proposition 1. Although the implementation of price discounts does increase customer traffic, this
increased effect declines over time.
Proof. The first and second derivatives of the total number of customers become positive and negative,
respectively, as follows:
N′(t) = (1−α)(1−π)t·log(1−π)−1>0
N′′(t) =−(1−α)(1−π)t·
log(1−π)−1 2
[image:6.595.153.441.78.293.2]<0
Figure 1 graphically illustrates the result of the proposition 1.
After simplifying, the profit function can be rewritten as follows:
Π(t) = (1−r)phα
T ·t+ (1−α)
1−(1−π)t i+
p·α
T ·(T−t)
=p
α
1−r· t
T
+ (1−r)(1−α)
1−(1−π)t
and the first-order conditions for profit maximization are characterized as follows:
Π′(t) =ph−αr
T −(1−r)(1−α)(1−π)
Equation (5) implies that the optimal strategy for discount periodt is independent from the regular
price, which is assumed to be exogenous in this section. From equation (5), we obtain the following
proposition concerning the equilibrium discount term:
Lemma 1. If the fraction of general customers is small enough to satisfy
log(1−π)−1
> 1
T ·
α
1−α· r
1−r, (6)
the retailer introduces the price promotion fort∗ periods that satisfies the following condition:
(1−π)t∗
·log(1−π)−1= 1
T ·
α
1−α· r
1−r (7)
Proof. It is readily apparent that solving equation (5) with respect totyields the equilibrium condition
(7). Condition (6) is necessary fort∗ to be positive:
t∗>0 ⇐⇒ (1−π)t∗
<1
⇐⇒ (1−π)t∗·log(1−π)−1<log(1−π)−1
⇐⇒ 1
T ·
α
1−α· r
1−r <log(1−π)
−1
Furthermore, the second-order condition is satisfied for all t.
Lemma 1 implies that the equilibrium discount termt∗ is increasing inT and decreasing inrandα.
As one would expect, the more durable a product (i.e., largerT), the longer the required discount term.
Furthermore, the higher the price discount needed to compete with the rival store (i.e., larger r), the
shorter the offered discount term. More interestingly, as the fraction of general customers increases (i.e.,
larger α), the retailer should decrease the duration of its price promotion. Price promotions have the
positive effect of enhancing the demand of price-sensitive customers while also allowing general customers
to obtain an unexpected price discount.
Next, we look at the marginal effect of extending a discount period fromtto t+ 1, which is denoted
by
∆ (t)≡Π(t+ 1)−Π(t) =ph−αr
T + (1−r)(1−α)(1−π)
tπi. (8)
We introduce the following assumption to ensure the incentive compatibility for store S to discount
its product for at least one period:
Assumption 1. π > T1 · α
1−α· r
1−r
Because (1−π) is smaller than 1, the function ∆(t) is decreasing in t. The following proposition
Figure 2: Marginal effects of extending price promotion periods
5 1 0 1 5 2 0 2 5 3 0 t
-0 .0 1 0
-0 .0 0 5 0 .0 0 5 0 .0 1 0 0 .0 1 5
D@tD
Note:p= 1,T = 30,r= 0.7,α= 0.5, andπ= 0.2
Proposition 2. Suppose that Assumption 1 holds. Although the implementation of a price discount
increases the store’s profit, this effect diminishes over time.
Proof. Assumption 1 ensures that∆(0)>0, thereby implying that storeS offers a price promotion for
at least one period. The derivative of∆(t)is negative for allt as follows:
∆′(t) = (1−r)(1−α)(1−π)tπ·log(1−π)<0
Building on this result, we posit that the price promotion will be ended if the marginal effect of
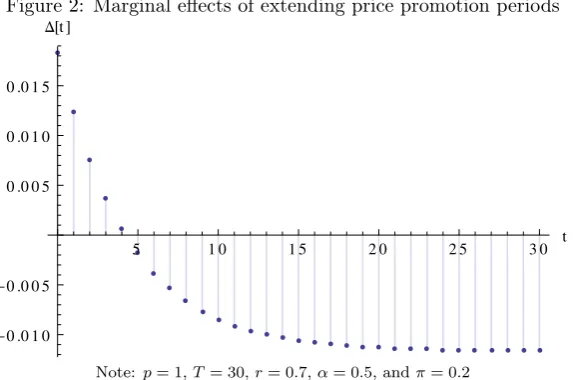
extending its duration falls below a reference point (usually 0). Figure 2 shows a numerical example
of the marginal effects of extending the price promotion duration. It is noteworthy that ∆ (0)takes a
positive value, which means that implementation of a price promotion essentially boosts the retailer’s
profit. Meanwhile, the marginal return of a price promotion has a decaying trend with elapsed time.
Thus, the price promotion will be ended att∗ for which the subsequent ∆ (t)becomes negative. In this
numerical example, the optimal duration of price promotion is four days (i.e.,t∗= 4).
2.2
Hypotheses
We speculate that the benefits of a price promotion on customer traffic and retail profits tend to diminish
with elapsed time. Using an elementary model in the previous subsection, we derived a theoretical
hypothesis. Propositions 1 and 2 revealed an interesting effect of price discounts on the number of
customers and retail profit, respectively. Therefore, we advance the following hypotheses:
Hypothesis 1. Although the implementation of a price discount increases customer traffic, this ability
Hypothesis 2. Although the implementation of price discount increases the store’s profit, this boost
diminishes over time.
In addition, although previous research examining the negative impact of a price promotion on
product loyalty focused on the depth of the price discount (Dodson et al., 1978), this study posits that
this potential negative impact may also depend on the time span of the promotion.
Hypothesis 3. Elapsed time of a price promotion relates negatively to product loyalty after a certain
duration.
3
Methodology
In this section, we introduce the dataset and variables’ measurements for the entire study. We also
construct the statistical models used in the data analysis.
3.1
Dataset
The data in this paper were collected through a point-of-sale (POS) system at a food-based medium-sized
supermarket group, which has about 70 chain stores in the Kansai area of Japan. This group provided
their in-house data for this study’s analysis. To understand the relation between the duration of price
promotion and retail profit, we decided to focus on one product, a family-sized pack of yogurt, after
a fundamental analysis of these POS data. This product was chosen because of its sales volume and
frequency of inclusion in promotions.
In the data pre-processing stage, we cleaned and assembled the data on customers’ consumption
records from 67 stores and obtained a total of 44,588 aggregated daily sales records for the target product
covering a continuous period from April 2011 to March 2013. Based on the results of the fundamental
analysis, we excluded 11 stores’ data, which were found to have serious noise, to avoid sample bias and
invalid data caused by system error. The final sample for this study thus contains a total of 37,010 daily
sales records from 56 stores. In addition, on the basis of the price changes present in the original data,
promotion-related information in this period was also analyzed and integrated into our dataset.
3.2
Measurements
3.2.1 Discount Rate
The discount rate is the most direct manifestation of a price promotion, and it intuitively reflects the
difference between the regular and current price. Prior research has significantly demonstrated the
traffic (Gupta, 1988; Walters and Rinne, 1986). In this paper, the regular price is denoted as the mode4
of the sales price during whole period, whereas the current price is actually assigned as the mode of all
unit prices in a day’s receipts records.5
Fundamental analysis of our dataset revealed that the regular
price of the corresponding product is 168 yen, but the current price mainly takes four values: 148, 138,
128, or 98 yen. Therefore, the price discount is calculated using the following equation:
dis= 168−P
168 ×100% (9)
whereP represents the current price anddisindicates the discount rate.
3.2.2 Retail Profit
Daily profits in this study are calculated by subtracting daily costs from daily revenues. Daily revenues
are the sum of the sales amount per day, which can be calculated from our dataset. However, data on
costs is difficult to obtain because of trade secrets. Therefore, relying on previous experience, we assume
that a product’s unit cost is half of its regular price. Therefore, daily profits can be processed using the
following equation:
Π =T R−T C =T R−84×Q (10)
where Π, T R, and T C represent daily profits, revenues, and costs of the product, respectively, and Q
identifies the sales volume.
3.2.3 Duration and Elapsed Time of Promotion
This study aims to investigate the dynamic relationship between elapsed time and profit effects of price
promotions. We define a dummy variableDp, which takes the value of 1 if a price promotion occurs. The
occurrence of a promotion is determined by whether the current price is lower than the regular price. In
our whole sample, the mean ofDpis 0.28 and the standard deviation is 0.45. The duration of promotion
is defined as the length of time from the promotion’s start to the time when the retailer restores the
regular price. We count the elapsed time of promotion by calculating the interval between the current
date and the promotion start date. However, the possibility exists that during a promotion’s duration,
the retailer may set separate prices on different dates. In that case, we recount the elapsed time only if
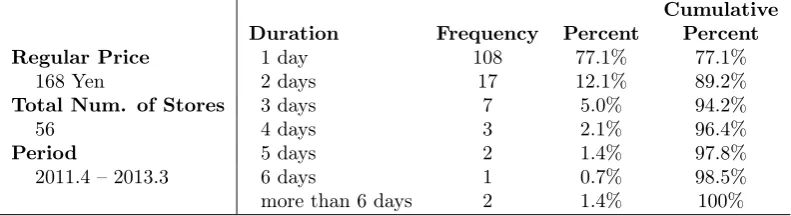
the current price is lower than the price on the previous day. Table 1 offers a simple example showing
the duration and elapsed time of a price promotion, and Table 2 describes the promotion duration and
frequency within the studied time period.
4
The mode is the value that appears most often in the dataset.
5
Table 1: Example of Promotion Duration
Date Regular Price Current Price Dp Elapsed Time
2012/02/01 168 168 0 0
2012/02/02 168 148 1 1
2012/02/03 168 148 1 2
2012/02/04 168 128 1 1
2012/02/05 168 128 1 2
2012/02/06 168 148 1 3
2012/02/07 168 168 0 0
2012/02/08 168 168 0 0
· · · ·
Table 2: Duration and Frequency of Price Promotion
Cumulative
Duration Frequency Percent Percent
Regular Price 1 day 108 77.1% 77.1%
168 Yen 2 days 17 12.1% 89.2%
Total Num. of Stores 3 days 7 5.0% 94.2%
56 4 days 3 2.1% 96.4%
Period 5 days 2 1.4% 97.8%
2011.4 – 2013.3 6 days 1 0.7% 98.5% more than 6 days 2 1.4% 100%
3.2.4 Customer Traffic
Customer traffic here refers to the total number of customer visits per day per shop. Many studies have
suggested that a price promotion not only increases the sales volume of the target product but also
attracts customer traffic (Gupta, 1988; Mulhern and Leone, 1990). In addition, there is much evidence
that increasing the number of customer visits can indirectly help a retailer boost retail profits (Jia,
2008). This is because of the strong positive correlation between total product sales and customer traffic
(Gomez et al., 2004). Here, we use the latter as a proxy for total demand. In our paper, customer
traffic data were obtained by counting the number of receipts from each store per day. Furthermore, this
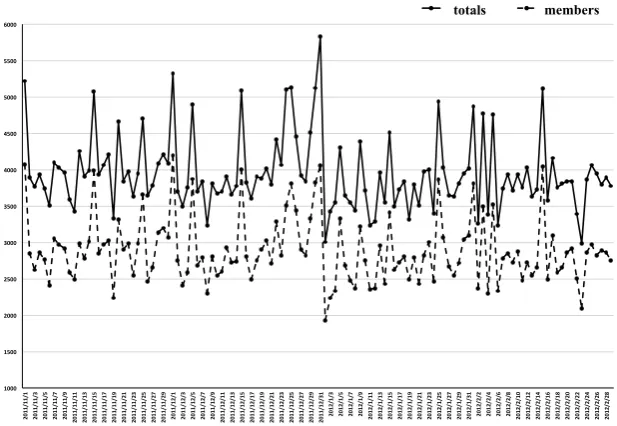
study divides customers into two types, members and non-members. Comparison of the distribution of
customer traffic (Figure 3) revealed no major difference in dispersion between these two customer types.
3.2.5 Control Variables
This study’s control variables include a time factor and the size of the business’s district, both of which
aim to control the number of customer visits. In the literature on retailing, the number of customers
is not only affected by price promotions but also by external factors, such as periodicity and location
(Newing et al., 2013). For instance, the number of entering customers is larger for a store located in a
downtown area or near a train station than for shops located elsewhere. In this paper, we identified each
target store to determine their location and size. Figure 4 represents the location of a part of target
[image:11.595.100.496.257.365.2]Figure 3: Distribution of Customer Traffic
1000 1500 2000 2500 3000 3500 4000 4500 5000 5500 6000
2011/11/1 2011/11/3 2011/11/5 2011/11/7 2011/11/9
2011/11/11 2011/11/13 2011/11/15 2011/11/17 2011/11/19 2011/11/21 2011/11/23 2011/11/25 2011/11/27 2011/11/29 2011/12/1 2011/12/3 2011/12/5 2011/12/7 2011/12/9 2011/12/11 2011/12/13 2011/12/15 2011/12/17 2011/12/19 2011/12/21 2011/12/23 2011/12/25 2011/12/27 2011/12/29 2011/12/31
2012/1/3 2012/1/5 2012/1/7 2012/1/9 2012/1/11 2012/1/13 2012/1/15 2012/1/17 2012/1/19 2012/1/21 2012/1/23 2012/1/25 2012/1/27 2012/1/29 2012/1/31 2012/2/2 2012/2/4 2012/2/6 2012/2/8 2012/2/10 2012/2/12 2012/2/14 2012/2/16 2012/2/18 2012/2/20 2012/2/22 2012/2/24 2012/2/26 2012/2/28 customer totals members
[image:12.595.214.382.344.427.2]Note: Period: Nov 1st, 2011 to Feb 28th, 2012; Store ID: 1023.
Table 3: Distribution of Store Sizes Customer Traffic∗ Num. of Stores
less than 1500 10 1500∼2500 22 2500∼3500 14 3500∼4500 7 no less than4500 3
Note: The value in column "Customer Traffic" shows the average of number of customers per day.
daily number of customers in each store.
Likewise, the number of customer visits shows an obvious increase on days offering an extra member
points promotion. A dummy variableDdis defined in this study to denote whether extra member points
were offered on the current day. The supermarket website states that customers can obtain five times
the number of member points if they shop there on the "1st," "5th," "15th," and "25th" of each month.
Our dataset indeed shows that customer traffic (i.e., number of receipts) exhibits a noticeable increase
on those days.
3.3
Empirical Model
Figures 5 represents the relationships among current price, customer traffic and retail profit, which is
calculated through fundamental analysis. This figure demonstrates that price promotions have certainly
helped retailers attract customers to visit the store, and thus, have helped increase retail profits. This
finding is consistent with the results in the literature. However, due to the limitations of data in terms of
duration length, the declining trends of number of customers and profits over time remain unclear from
Figure 4: Location of a Part of Stores
Figure 5: Price, Customer Traffic, and Retail Profit
[image:13.595.75.528.443.732.2]The literature has indicated that retail profits mainly depend on three factors: (1) consumer demand,
(2) extent of price discounts, and (3) product loyalty (Jia, 2008). Correspondingly, the effects of price
promotions on retail profit include (1) a direct effect by increasing purchase demand, (2) an indirect
effect by attracting customer traffic, and (3) an indirect effect by influencing product loyalty (Gupta,
1988). Building on this idea, the present study establishes the following statistical model to test the
hypotheses proposed in Section 2. To simplify the empirical model and intuitively focus more on the
relation between retail profit and promotion duration rather than the size of the discount, we assume
that the extent of discount has a linear impact on profit.
Πi=β0+β1disi+β2disi∗ti+β3disi∗t2i +β4ti+β5t2i +θvi+ui (11)
whereΠirepresents the store’s daily profits for observationi,
6
disiindicates the discount rate,viidentifies
customer traffic, ti means the elapsed time from the start of the promotion, and ui is the error term.
We introduce the square of elapsed time (i.e.,t2) to examine whether the impact of price promotion on retail profit shows a decaying trend over time.
It is worth noting that in this study, the possibility exists that external factors such as periodicity
and location may increase both customer traffic and retail profit. This situation can lead to correlation
between the error term (ui) and customer traffic (vi), and make the parameter estimate biased and
inconsistent because E(ui|vi)6= 0, which is known as endogeneity (Zhang et al., 2009). Therefore, we
developed the following models and estimated them using a two stage least-square method:
Πi=β0+β1disi+β2disi∗ti+β3disi∗t2i +β4ti+β5t2i +θˆvi+ui (12)
vi= ˆvi+ei=α0+α1disi+α2disi∗ti+α3disi∗t2i +α4ti+α5t2i +γ1Did+storei′φ+ei (13)
where, in these models,Dd
i is the dummy variable, which takes the value of 1 on a point-day with five
times member points,storeiis a nominal vector that denotes the store ID, and the remaining variables
have been defined previously. In what follows, we refer to the equations (12) and (13) as "Profit Model"
and "Customer Traffic Model," respectively. Dd
i andstorei are two instrumental variables andvˆiis the
"instrumented" customer traffic.
Combined with the antecedent theoretical framework,
β1disi+β2disi∗ti+β3disi∗t2i represents
the direct effects of a price promotion on retail profit because it reflects both the discount rate and
elapsed time;
β0+β4ti+β5t2i represents the change in product loyalty over the elapsed time of the
price promotion; andθˆvi indicates the effect of "instrumented" customer traffic on retail profit, where
ˆ
vi is a predicted value determined by price discount, elapsed time, and the two instrumental variables.
6
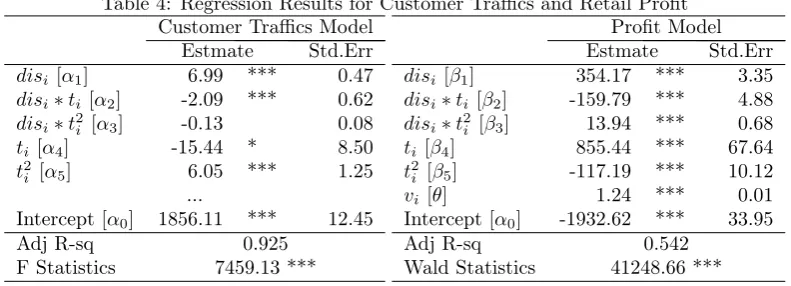
Table 4: Regression Results for Customer Traffics and Retail Profit Customer Traffics Model
Estmate Std.Err
disi [α1] 6.99 *** 0.47
disi∗ti [α2] -2.09 *** 0.62
disi∗t2i [α3] -0.13 0.08
ti [α4] -15.44 * 8.50
t2
i [α5] 6.05 *** 1.25
...
Intercept[α0] 1856.11 *** 12.45
Adj R-sq 0.925 F Statistics 7459.13 ***
Profit Model Estmate Std.Err
disi [β1] 354.17 *** 3.35
disi∗ti [β2] -159.79 *** 4.88
disi∗t2i [β3] 13.94 *** 0.68
ti [β4] 855.44 *** 67.64
t2
i [β5] -117.19 *** 10.12
vi [θ] 1.24 *** 0.01
Intercept[α0] -1932.62 *** 33.95
Adj R-sq 0.542 Wald Statistics 41248.66 ***
Note: N=37010, ***p <0.01, **p <0.05, *p <0.1
4
Results
In this section, we check the endogeneity of customer traffic and estimate the parameters of the statistical
models to examine the relationship between the elapsed time and profit effects of a price promotion.
Results of the Durbin-Wu-Hausman test (F(1,37002) = 798.66, p < 0.01) show that the variable
of customer traffic (vi) is endogenous in the profit model. In addition, we checked the validity of
the instrumental variables by using tests for underidentification (χ2 = 34000, p < 0.01) and weak
identification (F = 7998.39, p < 0.01). The results confirmed the effectiveness of the instrumental
variables used in our model.7
Therefore, the 2SLS model in our study is proven to be reasonable
according to these statistical test indicators.
To investigate the dynamic effect of price promotions on retail profit, this paper focuses more on
the time-related factors. Specifically, we perform a regression of customer traffic model to examine the
relationship between the price promotion and customer traffic in the first stage, then plug the predicted
value of customer traffic into the profit model and regress in the second stage to explore how a price
promotion dynamically influences retail profit. Table 4 reports the estimation results of these models.
In the customer traffic model, the estimates indicate that price discounts have a significant impact
(α1 = 6.99, p < 0.01) on customer traffic, with a higher discount resulting in a higher number of
customer visits. This is consistent with the results of the fundamental analysis (see Figure 5) and
the conclusions of prior research (Walters and Rinne, 1986). On the other hand, the coefficient of the
interaction between discount and elapsed time is negative (α2=−2.09,p <0.01). This means that the
effect of a price discount on customer traffic decreases over time. In addition, the coefficient on elapsed
time is negative (α4=−15.44, p <0.1) but positive for time squared (α5= 6.05, p <0.01). However,
the interaction between price discount and time squared failed to emerge as a significant variable. To
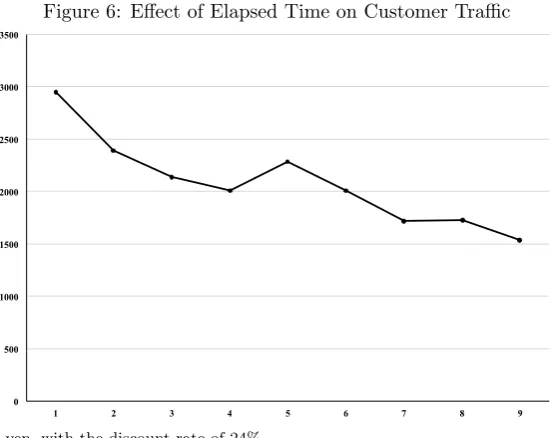
intuitively show how the elapsed time of a promotion affects the number of customers, Figure 6 depicts
the relationship between elapsed time and average number of customer visits, with a current price of 128
7
Figure 6: Effect of Elapsed Time on Customer Traffic
0 500 1000 1500 2000 2500 3000 3500
1 2 3 4 5 6 7 8 9
Note: Sales price is 128 yen, with the discount rate of 24%.
yen (i.e., discount rate of 24%). The figure indicates thatceteris paribus, the elapsed time of a promotion
negatively influences customer traffic. Therefore, we are able to confirm that price promotions do serve
to increase customer traffic, but this ability to increase traffic diminishes over time. In other words,
Hypothesis 1 is supported.
To test Hypothesis 2, i.e., if a price promotion’s impact on retail profit decays over elapsed time,
we focus on the results in the part of
β1disi+β2disi∗ti+β3disi∗t2i . Similar to the model for
customer traffic, the estimates in the profit model show that the coefficient on price discount is positive
(β1= 354.17,p <0.01), which means a present price discount can indeed help retailers increase profits.
This estimated result is consistent with the finding in our earlier fundamental analysis (see Figure 5)
and the literature (Jia, 2008; Walters and Rinne, 1986). With respect to the interaction of price discount
with elapsed time and elapsed time squared, the estimated coefficient in the regression for the former
is negative (β2 =−159.97, p <0.01) but positive for the latter (β3 = 13.94, p <0.01). These findings
indicate the existence of a downward relationship between the profit effects of a price discount and
elapsed time of the promotion. Therefore, Hypothesis 2 is also supported.
Hypothesis 3 predicts that the elapsed time of a price promotion relates negatively to product loyalty
after a certain timeframe has elapsed. As mentioned in prior research, rises or falls in product loyalty
are usually represented by the variation of the intercept in a regression model. As described above, the
β4ti+β5t2i portion represents the effects of elapsed time of a promotion on product loyalty. In this
study, the estimated results show that the coefficients of elapsed time (β4 = 885.44, p <0.01) and its
square (β5=−117.19, p <0.01) both have significant impacts on product loyalty. Due to the negative
value of time squared, we assert that customer loyalty decreases progressively over time after a certain
[image:16.595.159.436.80.299.2]to elapsed time after three or four days of the promotion. Hence, Hypothesis 3 is supported.
5
Discussion and Conclusions
Prior research has indicated that price promotions contribute to retailers’ retail profit, but few studies
have provided much insight into why and when retailers choose to halt a promotion. This study answers
these questions by demonstrating that the overall profit effects of price promotion have a downward
trend with elapsed time. This paper has proposed a statistical model with two-stage least squares to
empirically investigate the dynamic relationship between elapsed time of a price promotion and its effects
on marketing outcomes, which include retail profit, customer traffic, and product loyalty. Continuous
POS data for a well-known brand of yogurt sold in a medium-sized chain of supermarkets in Japan’s
Kansai area for the period from April 2011 to May 2013 were used in this study. The major results of
the analysis suggest that the effects of price promotion on all three marketing outcomes have a process
that decays with elapsed time of the promotion.
A fundamental analysis revealed that price promotions benefit the retailer by attracting customers to
the store. Although the implementation of price discounts increases customer traffic, this study confirms
that this positive effect decreases progressively with time elapsed since the start of the promotion. In
other words, if a sale goes on for too long, the number of customers will not increase much in the later
period. This might be because a longer promotion duration will also lower consumer perceived value by
affecting the reference price, resulting in a decline in the intention of customer visits.
Prior research has also indicated that price discounts might decrease brand loyalty for the product
(DelVecchio et al., 2006). However, it has been unclear whether product loyalty may change with the
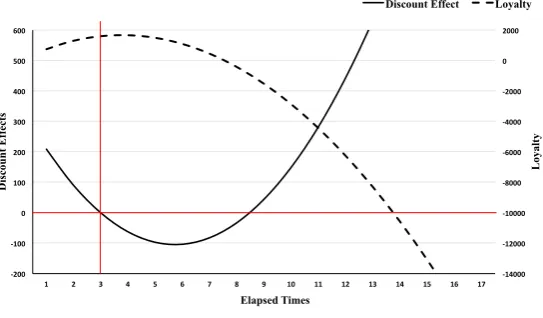
elapsed time of a price promotion. Figure 7 shows the relationship between the elapsed time of a price
promotion and both discount effect and product loyalty. This study’s findings have confirmed that
although product loyalty experiences a slight boost at the beginning of a price promotion (about three
days), this will diminish over time. In other words, an excessively long duration for a price promotion
may further deteriorate brand loyalty for the product.
With respect to the dynamic profit effects of price promotions, the most important part is the
rela-tionship between elapsed time and price discount effects on profits. Retailers implement price promotions
to increase retail profits; thus, a promotion will be halted if the price discount has a negative impact on
profit. Figure 7 visually demonstrates that although the implementation of a price discount increases
retail profit, its ability to produce such an increase shows a diminishing trend. In addition, in our case,
the price promotion even has a negative side effect that decreases the retail profit, which began to appear
about three days after the start of the promotion. This finding partially explains the reason why around
Figure 7: Elapsed Time, Discount Effect, and Customer Loyalty -14000 -12000 -10000 -8000 -6000 -4000 -2000 0 2000 -200 -100 0 100 200 300 400 500 600
1 2 3 4 5 6 7 8 9 10 11 12 13 14 15 16 17
Loyal ty D is cou n t Effe cts Elapsed Times
Discount Effect Loyalty
The main contribution of this study is to provide clear explanations for why and when retailers end
price promotions from both theoretical and empirical perspectives. Unlike previous research studies that
discuss the negative impacts of price promotions, focusing on the extent of discounts, this paper answers
the research questions based on the dynamic relationship between elapsed time and the overall effects
of the promotion on retail profit. The study’s findings provide clear empirical support for the argument
that the overall profit effects of price promotions have a downward trend with elapsed time. In addition,
the use of point-of-sale data in our study also contributes to the existing literature by improving the
accuracy and authenticity of the empirical results.
Important managerial implications can be drawn from our findings. First, regarding the extent of
discount level, if a price promotion is implemented for too long of a time span, it can begin to have
a negative impact on retailers’ trade profit. Marketing managers should stop a price promotion at the
point when their expected profits from the promotion drop below those expected at the usual price. It
is intended that the analysis results of this study can help retailers set the optimal duration of price
promotion reasonably and effectively.
Inevitably, our study suffers from a few limitations. First, this study focused on only one product to
investigate the dynamic relationship between elapsed time and overall profit effects of price promotions.
However, this relationship may be moderated by other factors, such as the product’s characteristics.
Therefore, more empirical data and work are needed to demonstrate the effectiveness and universality
of our conclusions. It would be important to predict and control for this possibility in future research,
which would better help retailers set the optimal duration of price promotions. The second limitation is
that this study only considered the effects of a price promotion on the target product’s profit. However,
retailers sometimes also carry out price promotions to increase the sales volumes and profit for other
Acknowledgment
This work was supported by “Strategic Project to Support the Formation of Research Bases at Private
Universities”: Matching Fund Subsidy from MEXT (Ministry of Education, Culture, Sport, Science and
Technology), 2014-2018. We also gratefully acknowledge financial support from JSPS KAKENHI Grant
Numbers JP15H06747, 16K17126, and 17H00959.
References
Ailawadi, Kusum L, JP Beauchamp, Naveen Donthu, Dinesh K Gauri and Venkatesh Shankar (2009).
“Communication and Promotion Decisions in Retailing: A Review and Directions for Future Research.”
Journal of Retailing, 85 (1), 42–55.
Alvarez Alvarez, Begoña and Rodolfo Vázquez Casielles (2005). “Consumer Evaluations of Sales
Promo-tion: The Effect on Brand Choice.” European Journal of Marketing, 39 (1/2), 54–70.
Blattberg, Robert C and Scott A Neslin (1990). Sales promotion: Concepts, methods, and strategies.
Prentice Hall.
Bogomolova, Svetlana, Marietta Szabo and Rachel Kennedy (2017). “Retailers’ and Manufacturers’
Price-Promotion Decisions: Intuitive or Evidence-Based?” Journal of Business Research, 76, 189–200.
Campo, Sara and María J Yagüe (2007). “Effects of Price Promotions on the Perceived Price.”
Interna-tional Journal of Service Industry Management, 18 (3), 269–286.
Corbett, Charles J and Xavier De Groote (2000). “A Supplier’s Optimal Quantity Discount Policy Under
Asymmetric Information.” Management Science, 46 (3), 444–450.
Cui, Bingqun, Kejia Yang and Tingjui Chou (2016). “Analyzing the Impact of Price Promotion Strategies
on Manufacturer Sales Performance.” Journal of Service Science and Management, 9 (02), 182.
DelVecchio, Devon, David H Henard and Traci H Freling (2006). “The Effect of Sales Promotion on
Post-promotion Brand Preference: A Meta-analysis.” Journal of Retailing, 82 (3), 203–213.
Dodson, Joe A, Alice M Tybout and Brian Sternthal (1978). “Impact of Deals and Deal Retraction on
Brand Switching.” Journal of Marketing Research, pp. 72–81.
Esteban-Bravo, Mercedes, José M Múgica and Jose M Vidal-Sanz (2005). “Optimal Duration of Magazine
Promotions.” Marketing Letters, 16 (2), 99–114.
Fibich, Gadi, Arieh Gavious and Oded Lowengart (2007). “Optimal Price Promotion in the Presence of
Gomez, Miguel I, Edward W McLaughlin and Dick R Wittink (2004). “Customer Satisfaction and Retail
Sales Performance: An Empirical Investigation.” Journal of Retailing, 80 (4), 265–278.
Gupta, Sunil (1988). “Impact of Sales Promotions on When, What, and How Much to Buy.” Journal of
Marketing Research, pp. 342–355.
Jia, Panle (2008). “What Happens When Wal-Mart Comes to Town: An Empirical Analysis of the
Discount Retailing Industry.” Econometrica, pp. 1263–1316.
Kahneman, Daniel and Amos Tversky (1979). “Prospect Theory: An Analysis of Decision under Risk.”
Econometrica, pp. 263–291.
Manning, Kenneth C and David E Sprott (2007). “Multiple Unit Price Promotions and Their Effects on
Quantity Purchase Intentions.” Journal of Retailing, 83 (4), 411–421.
Martín-Herrán, Guiomar, Simon-Pierre Sigué and Georges Zaccour (2010). “The Dilemma of Pull and
Push-Price Promotions.” Journal of Retailing, 86 (1), 51–68.
Mela, Carl F, Sunil Gupta and Donald R Lehmann (1997). “The Long-Term Impact of Promotion and
Advertising on Consumer Brand Choice.” Journal of Marketing Research, pp. 248–261.
Moore, David J and Richard W Olshavsky (1989). “Brand Choice and Deep Price Discounts.” Psychology
& Marketing, 6 (3), 181–196.
Mulhern, Francis J and Robert P Leone (1990). “Retail Promotional Advertising: Do the Number of
Deal Items and Size of Deal Discounts Affect Store Performance?” Journal of Business Research,
21 (3), 179–194.
Myneni, Ravi (1992). “The Pricing of the American Option.” The Annals of Applied Probability, pp.
1–23.
Newing, Andy, Graham Clarke and Martin Clarke (2013). “Identifying Seasonal Variations in
Store-Level Visitor Grocery Demand.” International Journal of Retail & Distribution Management, 41 (6),
477–492.
Tsiros, Michael and David M Hardesty (2010). “Ending a Price Promotion: Retracting It in One Step
or Phasing It Out Gradually.” Journal of Marketing, 74 (1), 49–64.
Viswanathan, S and Qinan Wang (2003). “Discount Pricing Decisions in Distribution Channels with
Price-sensitive Demand.” European Journal of Operational Research, 149 (3), 571–587.
Walters, Rockney G and Heikki J Rinne (1986). “An Empirical Investigation into the Impact of Price
Weathers, Danny, Scott D Swain and Igor Makienko (2015). “When and How Should Retailers Rationalize
the Size and Duration of Price Discounts?” Journal of Business Research, 68 (12), 2610–2618.
Wee, Hui-Ming (1999). “Deteriorating Inventory Model with Quantity Discount, Pricing and Partial
Backordering.” International Journal of Production Economics, 59 (1), 511–518.
Zhang, Jie, Michel Wedel and Rik Pieters (2009). “Sales Effects of Attention to Feature Advertisements: