Cyclic Correlation of Diffuse Reflected Signal with
Glucose Concentration and Scatterer Size
Jitendra Solanki1, Pratima Sen2, Joseph Thomas Andrews1*, Kamal Kishore Thareja3 1Applied Photonics Laboratory, Department of Applied Physics, Shri G S Institute of Technology & Science, Indore, India
2Laser Bhawan, School of Physics, Devi Ahilya University, Indore, India 3KK Pathology Laboratory, Chanakya Complex, Malwa Mill Circle, Indore, India
Email: *[email protected]
Received June 27, 2011; revised August 19, 2011; accepted September 10, 2011
ABSTRACT
The utility of optical coherence tomography signal amplitude measurement to monitor glucose concentration in tissue phantom and blood samples from human subjects has been explored. The diffusion equation based calculations as well as in-vivo OCT signal measurements confirm a cyclic correlation of signal intensity with glucose concentration and scat- terer size.
Keywords: Light Scattering; Tomography; Biomedical Optical Imaging; Diabetes; Diffusion
1. Introduction
Everyday, almost 150 million people world wide face the problem of diabetic metabolic control. Both the hypo- and hyper-glycemic conditions of patients have fatal conse- quences and warrant blood glucose monitoring at regular interval. Existing blood glucose monitors can be widely classified into three classes viz., invasive, minimally inva- sive, and noninvasive. Invasive monitoring require small volume of blood and they are inappropriate for continuous monitoring of blood glucose. Minimally invasive monitors require 1 - 2 ml of blood for analysis at the same time skin damage of the order of few mm is also required. On the other hand, noninvasive devices are painless with no skin injury to tissues.
Many research groups are working to develop a real time noninvasive tool for monitoring blood glucose at clinical level. Recent review by Bazaev and Selishchev [1], discuss various noninvasive methods for blood glucose measurement and monitoring. Existing non-invasive blood glucose monitor work on various modalities such as absorp- tion spectroscopy [2], optical activity and polarimetry [3,4], optical coherence tomography (OCT) [5,6], bioimpedance spectroscopy [2], fluorescence [7] etc. The other optical techniques include Raman spectroscopy, absorption [8], and reflectance spectroscopy [9]. However, due to optical interference, poor signal strength, and calibration issues, optical methods still face many challenges [10]. The mea- surement of blood glucose level using OCT technique ex- hibits large fluctuations due to motion artifacts or other
physiological and environmental conditions [5,6]. Optical coherence tomography is a nondestructive tech- nique that examines the internal structure of superficial la- yers of biological tissues. The backscattered OCT signal from turbid media like blood, tissue, etc. is a diffuse reflected signal which carries information about the scatterer and its environment. It is based on interferometric recording of near-infrared light backscattered from the point of study. Conventionally, in OCT backscattered light is collected, measured, and integrated to assemble images [11]. The ob- jectives of the the present paper are two fold: Firstly, to correlate the glucose concentration with experimentally observed diffuse reflectance signal from OCT. Secondly, to examine the usability of OCT signal intensity for mea- surement of glucose concentration.
The preceeding section deals with the theoretical ana- lysis where Mie scattering theory and diffusion equation are used to understand the dependence of solute concen- tration on OCT signal intensity in a turbid medium. In the third section, experimental results are exhibited for va- rious samples of aqueous solutions of glucose dissolved in tissue phantom as the scatterers. The experiment was also performed with blood samples from voluntary blood donors. In the fourth section, the numerical calculations carried out for various glucose concentrations in aqueous solution having different particle sizes as scatterers are pre- sented. These results are compared with the experimental observations and found that glucose concentration and size of scatterers exhibit a cyclic correlation with diffuse re- flected signal.
2. Theoretical Formulations
s
, s
is the path length resolved field amplitude.is field amplitude from the reference mirror. E t L
r
E
Blood is a turbid medium consisting of extracellular fluid (ECF) and various scatterers e.g. red blood cells (RBC), white blood cell (WBC) etc. Multiple scattering from RBC gives rise to diffusion of light from blood. The av- erage diffuse intensity (Ud) is related to the scattering
cross section via the relation [6],
=
0d d
U r U
exp
k rd
. (1)Here, kd (= 3 a tr ) is the propagation constant of
the radiation in ECF withas the number density of scat terers in the medium, tr is the transport cross section and
is given by tr=s
1 g
a with s being the scat-tering coefficient, g is the anisotropy parameter and a
is the absorption coefficient.
The scattering cross sections can be calculated from the Mie scattering theory as [12],
1n
2,n n
a b
2 2
2π
= 2 1
s
n
a n
(2)where,
= n n
n n n m a m n n n n
and
= n n
n n n m b m n n n n
=k a
with d ,a is the scatterer size.
=mk ad
with mbeing the relative refractive index of the scatterer (RBC in the present case). Also, n
= jn
=and
n ,hn
where jn
and hn
representthe spherical Bessel and Hankel functions, respectively. With the knowledge of these parameters, we can calcu- late the path length resolved diffuse reflectance as
=
= d ,
L L 1 0 s d s U L U L
0 =0
R L (3)
where, s = s i Lsi
L
L L is the round trip path length estimated from the initial pathlength difference between the sample and reference arms s0 and the total path
length within the sample that accumulates during every ith each scattering event si [6]. A theoretical estimate
of the OCT signal intensity can be made from the diffuse reflectance. In an OCT set up the interference between the light scattered from the sample arm and reference arm is detected. The light intensity at the detector is given by
L
=
, s
dLsE tr , 2 ,d s
Ls
I
E t L (4)where,
=L c
is the time delay corresponding to the round-trip optical path length between two beams andThe OCT signal obtainable from a turbid medium is a convolution of path length resolved diffuse reflectance and the low coherence function arising from the coherence pro- perty of the laser source. Accordingly, the OCT signal may be rewritten as
1 2
= ,
d s r s s
I L I R L C L (5)
d s
I
where, L is the OCT signal detected by a photo- diode, Ir is the signals from reference arm. C L
s is low-coherence function of the source.
The change in the intensity of OCT signal vary in accordance with the square root of the variations in the dif- fuse reflectance. A close observation of Equations (1) to (5) clearly shows that the diffuse reflectance R L
s is in- timately related to the scattering cross section s, viaEquation (2). Also Equation (2) suggests that the scattering cross section is a function of 1) scatterer size and 2) relative refractive indices of the scatterer and the fluid in which the scatterer is dispersed. Consequently, for blood samples one can expect a variation in the OCT signal intensity with the change in the refractive index of ECF as well as change in the size of RBC.
s A The amplitude of the OCT signal L
is propor-tional to the diffuse reflectance (R Ls
) and is given by
=
= d .
s
d L L
U r A L U r (6) s
It is worth noticing that the RBC cells, which act as source of scatterer in blood have various sizes in the subjects under study. Consequently, the utility of OCT setup for examining glucose concentration in blood requires the knowledge of weighted average of the signal
AW L
s
[13]. Under the Gaussian distribution approximation, it is given by
2 0 1= d exp n ,
s
n d
U r S S
AW L
n U r S
S S S
(7)
with 0, n and as the size of RBC, mean size of
RBC and variance in size, respectively. The reported values of RBC in healthy subjects are S07.5mm and S 1 mm [13].
3. Experiment
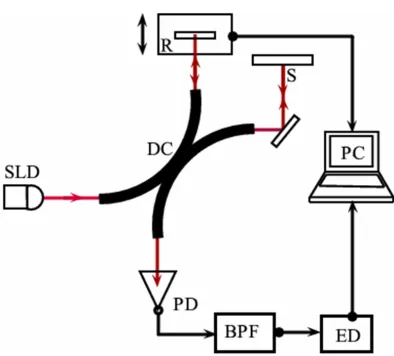
Figure 1. Schematic of the optical coherence tomography setup. SLD—Superluminescent diode; DC—3 dB bi-directional coupler; PD—Photo diode; S—Sample; R—Reference arm with scanning assembly; BPF—Band pass filter; ED—En- velope detector.
advantages of large scattering coefficient and low absorp- tion coefficient in tissues. However, these coefficients are altered when index mismatch occurs between ECF and cells.
3.1. Sample Preparation
The primary goal of the present work is to find the cor- relation between the amplitude of OCT signal with con- centration of glucose. Systematic measurements were car- ried out with the following samples: 1) tissue phantom based as intralipid, and 2) blood samples from voluntary human subjects.
3.2. Tissue Phantom
Intralipid is an emulsion of soy bean oil, egg phospholipids and glycerin. Intralipid is widely used in optical experiments to simulate the scattering properties of biological tissues and can be use as a good scatterer as RBC in blood. The major advantages of intralipid are its well known optical properties and the similarity of its microparticles to lipid cell membranes and organelles that constitute the source of scattering in biological tissue [13-17]. We used intra- lipid as a tissue phantom that provides the backscattered component. Average size of scatterers in intralipid meas- ured using confocal microscope was found to be 3.5 mm.
Using standard approach, we generate glucose concen- trations of 0.0 mg/dl to 200 mg/dl in 1ml sample tissue phantom for experimental observations. This range covers hypoglycemic (<80 mg/dl), normal (80 - 120 mg/dl) as well as hyperglycemic (>120 mg/dl) conditions. A set-tlement time of 2 minutes was given after addition of glucose to the intralipid solution so that the added glu-cose could alter the scattering properties of the medium.
Simultaneously, the change in refractive index of the solution was also monitored using Abbe’s refractometer. Measurement were carried out using fixed volume (1 ml) of tissue phantom and diluted to 0.01% in distilled water (100 ml) and concentrated glucose solution prepared by dissolving 200 mg glucose in 100 ml distilled water. The concentration of glucose in intralipid was increased in steps of 10 mg/dl using U-TEK Chromatography syringe with least count of 5 μl.
3.3. Blood Samples
Blood samples were collected from pathological labora- tory. In order to optimize the setup with human subjects, blood samples were collected from various voluntary sub- jects. Conventional pathological method known as GOD/ POD (Glucose Oxydised/Peroxydised) using semi-auto- mated blood analyzer was used simultaneously to meas- ure the exact value of blood glucose. A smaller part of (≈4 μl) blood taken using a Eppendorf Pipette is placed on the sample arm of the OCT setup.
4. Results
To confirm the changes in the optical properties of the solution with increasing glucose concentration in intrali- pid, Abbe refractometer was used to obtain the refractive index (=1.407) of tissue phantom. As discussed earlier, ad- dition of 50 μl glucose to intralipid solution of volume 1 ml increases the glucose concentration by 10 mg/dl. At the same time, it reduces the index matching between the scatterer and the medium. The measurements of refractive index and scattering coefficients using Abbe refractome- ter and OCT, respectively were made simultaneously to avoid the temporal fluctuations in values. Results obtained with refractometer are displayed in Figure 2. A linear re- lation is obtained between the glucose concentration and the refractive index. The data from Figure 2 gives an em- pirical relation between the glucose concentration and the refractive index.
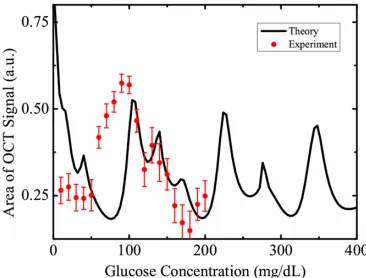
[image:3.595.329.515.563.706.2]The measured OCT signal amplitudes for various glu- cose concentrations (10 mg/dl - 200 mg/dl) are shown in Figure 3. In order to reduce the noise in OCT signal, we displayed the normalised average area of scattered signal within the coherence length shown as dots in the figure. The OCT signal amplitude is numerically equal to the average diffuse intensity Id defined in Equation (4). The theo-
retical fit shown as solid line in the Figure 3 is the weighted average as discussed earlier. The results indicate an oscilla- tory nature of backscattered component of the OCT signal with glucose concentration. These observations with tissue phantom show a cyclic correlation between glucose con- centration and OCT signal amplitude and are in good agreement with the theoretically calculated values of diffuse reflectance (solid line). Both the curves exhibit similar nature which confirms the applicability of present theoretical calculations to correlate them with blood glucose levels in human subjects. In order to confirm the same with clinical measurements with human subjects, we collected samples of voluntary donors from pathological laboratory and the results are discussed below. Simultaneous mea-
[image:4.595.78.267.550.688.2]Figure 3. OCT signal amplitude obtained in a sample of tis- sue phantom with different glucose concentrations are shown as filled circles with error bars. The solid line is the weighted average obtained theoretically using Equation (7).
Figure 4. The filled circles represent the amplitude of OCT signal obtained from various blood samples of voluntary do-nors having different glycemic levels while the solid curve is the weighted average obtained theoretically using Equation (7).
surements of blood glucose was carried out using chemical methods as described in previous sections. The corre- lation between blood glucose level of human subjects and the amplitude of the OCT signal are represented in Figure 4. The curve definitely shows a cyclic correlation, similar to the results predicted from Equation (4) and Figure 3.
We therefore, find that the cyclic correlation of glucose concentration with OCT signal restricts the OCT signal intensity based glucose measurements in human subjects.
5. Conclusion
It is well known that the optical properties of tissue vary with glucose concentration and the index mismatch between the ECF and scatterers. There are many factors which will affect the OCT signal intensity. For example the refract- tive index of ECF will change with change in any types of soluble impurities (example: urea) and the change in the scatterer size. Accordingly, well defined predictions for glucose concentration measurements using OCT signal in- tensity are not possible because of the non-uniform size distribution of various particles as well as presence of creatinine, lactic acid, serum albumin, and NaCl, Urea, etc. in blood. Therefore, the results presented here may not be used as a tool for estimation of blood glucose levels, how- ever, it throws light on the understanding of light scattering from blood samples, in the presence of various types of scatterers differing in physical and optical properties.
6. Acknowledgements
The authors thank financial support received from UGC and New Delhi and MPCOST, Bhopal, India. The authors also thank Prof. P. K. Sen for fruitful discussions.
REFERENCES
[1] N. A. Bazaev and S. V. Selishchev, “Noninvasive Meth-ods for Blood Glucose Measurement,” Biomedical Engi-neering, Vol. 41, No. 1, 2007, pp. 42-50.
doi:10.1007/s10527-007-0010-9
[2] C. F. Amaral, M. Brischwein and B. Wolf, “Multiparameter Techniques for Noninvasive Measurement of Blood Glu- cose,” Sensors and Actuators B, Vol. 140, No. 1, 2009, pp. 12-16. doi:10.1016/j.snb.2009.04.023
[3] B. Rabinovitch, W. F. March and R. L. Adams, “Nonin-vasive Glucose Monitoring of the Aqueous Humor of the Eye. Part 1. Measurement of Very Small Optical Rota-tions,” Diabetes Care, Vol. 5, No. 3, 1982, pp. 254-258. doi:10.2337/diacare.5.3.254
[5] K. V. Larin, M. Motamedi, M. S. Eledrisi and R. O. Ese-naliev, “Noninvasive Blood Glucose Monitoring with Optical Coherence Tomography,” Diabetes Care, Vol. 25, No. 12, 2002, pp. 2263-2267.
doi:10.2337/diacare.25.12.2263
[6] R. Poddar, S. R. Sharma, J. T. Andrews and P. Sen, “Study of Correlation between Glucose Concentration and Reduced Scattering Coefficients in Turbid Media Using Optical Coherence Tomography,” Current Science, Vol. 95, No. 2, 2008, pp. 340-348.
[7] J. C. Pickup, F. Hussain, N. D. Evans, O. J. Rolinski and D. J. S. Birch, “Fluorescence-Based Glucose Sensors,” Biosensors and Bioelectronics, Vol. 20, No. 12, 2005, pp. 2555-2565. doi:10.1016/j.bios.2004.10.002
[8] J. R. McNichols and L. G. Cote, “Optical Glucose Sens-ing in Biological Fluids: An Overview,” Journal of Bio-medical Optics, Vol. 5, No. 1, 2000, pp. 5-16.
doi:10.1117/1.429962
[9] S. F. Malin, T. L. Ruchiti, T. B. Blank, S. U. Thennadil and S. L. Monfre, “Noninvasive Prediction of Glucose by Near-Infrared Diffuse Reflectance Spectroscopy,” Clini-cal Chemistry, Vol. 45, No. 9, 1999, pp. 1651-1658. [10] V. Ashok, A. Nirmalkumar and N. Jeyashanthi, “A Novel
Method for Blood Glucose Measurement by Noninvasive Technique Using Laser,” International Journal of Bio-logical and Life Sciences, Vol. 7, No. 3, 2010, pp. 127- 132.
[11] V. V. Sapozhnikova, D. Prough, R. V. Kuranov, I. Cice-naite and R. O. Esenaliev, “Influence of Osmolytes on in Vivo Glucose Monitoring Using Optical Coherence To-mography,” Experimental Biology and Medicine, Vol.
231, No. 8, 2006, pp. 1323-1332.
[12] A. Ishimaru, “Wave Propagation and Scattering in Ran- dom Media,” Scattering and Absorption of a Wave by Single Particle, Chapter 2, Vol. 1, Academic Press, New York, 1978, pp. 9-40.
[13] D. N. Mederis and G. R. Minot, “Studies on Red Blood Cell Diameter,” Vol. 7, No. 4, 1929, pp. 631-636. doi:10.1172/JCI100247
[14] S. N. Thennadill, J. L. Rennert, B. J. Wenzel, K. H. Hazen, T. L. Ruchti and M. B. Block, “Comparison of Glucose Concentration in Interstitial Fluid, and Capillary and Venous Blood during Rapid Changes in Blood glu-cose Levels,” Diabetes Technology & Therapeutics, Vol. 3, No. 3, 2001, pp. 357-365.
doi:10.1089/15209150152607132
[15] R. Srinivasan and M. Singh, “Laser Backscattering and Transillumination Imaging of Human Tissues and Their Equivalent Phantoms,” IEEE Transactions on Biomedical Engineering, Vol. 50, No. 6, 2003, pp. 724-730. doi:10.1109/TBME.2003.812188
[16] H. J. V. Staveren, C. J. M. Moes, J. V. Marle, S. A. Prahl and M. J. C. V. Gemert, “Light Scattering in In-tralipid-10% in the Wavelength Range of 400 - 1100 nm,” Applied Optics, Vol. 30, No. 31, 1991, pp. 4507-4514. doi:10.1364/AO.30.004507
[17] B. F. Kennedy, S. Loitsch, R. A. McLaughlin, L. Scolaro, P. Rigby and D. D. Sampson, “Fibrin Phantom for Use in Optical Coherence Tomography,” Journal of Biomedical Optics, Vol. 15, No. 3, 2010, p. 030507-1-3.