CONSTRUCTION OF SELECTION INDEX USING SIMPLE CORRELATION COEFFICIENTS AND PATH
COEFFICIENTS (DIRECT EFFECTS) AS A WEIGHT IN RICE (
*,1
Chaudhary, A. P.
1
Department of Agricultural Statistics, B. A. College of Agriculture, AAU, Anand
2
College of Agricultural Information Technology, AAU, Anand
ARTICLE INFO ABSTRACT
The present study was conducted with sixty three diverse genotypes of rice ( Rice Research Station (MRRS), Nawagam, Gujarat during
relationship and selection index among yield and yield attributing characters. Total six characters were used for construction of selection indices i.e. Grain yield per plant, plant height, panicle length, number of pro
methods were used for this study like simple correlation coefficients and path coefficients (Direct effects). The analysis of variance revealed that the presence of consid
among the test of genotypes for all the characters. The simple correlation study revealed that harvest index, number of productive tillers per plant and 1000 grain weight had positive and highly significant correlation with grain
tillers per plant had the highest direct effect on grain yield per plant followed by 1000 grain weight, harvest index, panicle length and plant height. Results of selection indice
increase in the efficiency of selection was observed with the inclusion of additional character in the selection index. Selection index (I
panicle length, num
per cent relative efficiency (PRE) among all the indices including rice correlation coefficients and path coefficients weight method. Lo
(I256) which was combinations of plant height, 1000 grain weight and harvest index showed highest PRE and it was suggested to use for selection of genotypes for rice grain improvement without grain yield per plant.
Copyright©2017, Chaudhary et al. This is an open access article distributed under the Creative Commons Att distribution, and reproduction in any medium, provided the original work is properly cited.
INTRODUCTION
The cultivated rice plant (Oryza sativa L.) is an important
annual, self-pollinated, diploid (2n=2x=24) cereal crop species. It is the staple food for more than one half of the world’s population. Rice is life and princess among the cereals and the staple food of 65 per cent of the total popula
total area under rice in India is about 45 m ha. (22 % of cropped area) with an annual production of 104.8 million tones and contributes 25 % to total Agricultural GDP. While in case of Gujarat, it occupies about 5 % of the gross cropped
it is grown on about 7.8 lakh hectares. From these area nearly 55 to 60 % area comprised of lowland and 40 to 45 % of upland situation. The use of a selection index was first proposed by Smith (1937) based on the Fisher’s (1936) concept of discriminant function. Hazel (1943) constructed
*Corresponding author: Chaudhary, A. P.
Department of Agricultural Statistics, B. A. College of Agriculture, AAU, Anand-388110, Gujarat, India.
ISSN: 0975-833X
Article History:
Received 12th April, 2017 Received in revised form 09th May, 2017
Accepted 28th June, 2017 Published online 26th July, 2017
Citation: Chaudhary, A. P., Parmar, D. J., Muniya, S. D. and Darji, V. B.
path coefficients (direct effects) as a weight in rice (Oryza sativa
Key words:
Selection index, Rice, Yield contributing characters, Per cent relative efficiency, Simple correlation coefficients, Path coefficients,
Score value,
Spearman’s rank correlation.
RESEARCH ARTICLE
CONSTRUCTION OF SELECTION INDEX USING SIMPLE CORRELATION COEFFICIENTS AND PATH
COEFFICIENTS (DIRECT EFFECTS) AS A WEIGHT IN RICE (
ORYZA SATIVA
A. P.,
1Parmar, D. J.,
1Muniya, S. D. and
2Darji
Department of Agricultural Statistics, B. A. College of Agriculture, AAU, Anand
-College of Agricultural Information Technology, AAU, Anand-388110, Gujarat, India
ABSTRACT
The present study was conducted with sixty three diverse genotypes of rice ( Rice Research Station (MRRS), Nawagam, Gujarat during kharif
relationship and selection index among yield and yield attributing characters. Total six characters were used for construction of selection indices i.e. Grain yield per plant, plant height, panicle length, number of productive tillers per plant, 1000 grain weight and harvest index. Two different weight methods were used for this study like simple correlation coefficients and path coefficients (Direct effects). The analysis of variance revealed that the presence of consid
among the test of genotypes for all the characters. The simple correlation study revealed that harvest index, number of productive tillers per plant and 1000 grain weight had positive and highly significant correlation with grain yield per plant. The path analysis results showed that number of productive tillers per plant had the highest direct effect on grain yield per plant followed by 1000 grain weight, harvest index, panicle length and plant height. Results of selection indice
increase in the efficiency of selection was observed with the inclusion of additional character in the selection index. Selection index (I123456) which was combinations of grain yield per plant, plant height, panicle length, number of productive tillers per plant, 1000 grain weight and harvest index had highest per cent relative efficiency (PRE) among all the indices including rice
correlation coefficients and path coefficients weight method. Lo
) which was combinations of plant height, 1000 grain weight and harvest index showed highest PRE and it was suggested to use for selection of genotypes for rice grain improvement without grain yield per plant.
is an open access article distributed under the Creative Commons Attribution License, which distribution, and reproduction in any medium, provided the original work is properly cited.
L.) is an important pollinated, diploid (2n=2x=24) cereal crop species. It is the staple food for more than one half of the world’s population. Rice is life and princess among the cereals and the staple food of 65 per cent of the total population in India. The total area under rice in India is about 45 m ha. (22 % of cropped area) with an annual production of 104.8 million tones and contributes 25 % to total Agricultural GDP. While in case of Gujarat, it occupies about 5 % of the gross cropped area and it is grown on about 7.8 lakh hectares. From these area nearly 55 to 60 % area comprised of lowland and 40 to 45 % of The use of a selection index was first proposed by Smith (1937) based on the Fisher’s (1936)
minant function. Hazel (1943) constructed
Department of Agricultural Statistics, B. A. College of Agriculture, AAU,
selection index based on path coefficients. The aim of most breeding programmes is simultaneous improvement of several characters. It has been recognized that most rapid improvement in the economic value is expected from selection applied simultaneously to all the characters which determine the economic value of a plant, when appropriate weights are assigned to each character according to their relative economic importance. There is no standard procedure to assign weights to the biometrical characters in selection index.
attempt has been made to construct s
simple correlation coefficients and path coefficients (Direct effects) as weight. The objectives of this study were to construct selection indices, compare different weights and test the efficiency of selection indices.
MATERIALS AND METHODS
The investigation was conducted at Main Rice Research station (MRRS), Nawagam, Anand Agricultural University, Anand International Journal of Current Research
Vol. 9, Issue, 07, pp.53864-53869, July, 2017
Chaudhary, A. P., Parmar, D. J., Muniya, S. D. and Darji, V. B. 2017. “Construction of selection index using simple correlation coefficients and
Oryza sativa L.)”, International Journal of Current Research, 9, (07),
CONSTRUCTION OF SELECTION INDEX USING SIMPLE CORRELATION COEFFICIENTS AND PATH
ORYZA SATIVA
L.)
Darji, V. B.
-
388110, Gujarat, India
388110, Gujarat, India
The present study was conducted with sixty three diverse genotypes of rice (Oryza sativa L.) at Main
kharif season of 2011 to assess the
relationship and selection index among yield and yield attributing characters. Total six characters were used for construction of selection indices i.e. Grain yield per plant, plant height, panicle length, ductive tillers per plant, 1000 grain weight and harvest index. Two different weight methods were used for this study like simple correlation coefficients and path coefficients (Direct effects). The analysis of variance revealed that the presence of considerable amount of variation among the test of genotypes for all the characters. The simple correlation study revealed that harvest index, number of productive tillers per plant and 1000 grain weight had positive and highly significant yield per plant. The path analysis results showed that number of productive tillers per plant had the highest direct effect on grain yield per plant followed by 1000 grain weight, harvest index, panicle length and plant height. Results of selection indices showed that a progressive increase in the efficiency of selection was observed with the inclusion of additional character in the ) which was combinations of grain yield per plant, plant height, ber of productive tillers per plant, 1000 grain weight and harvest index had highest per cent relative efficiency (PRE) among all the indices including rice grain yield per plant for simple correlation coefficients and path coefficients weight method. Looking to simplicity, selection index ) which was combinations of plant height, 1000 grain weight and harvest index showed highest PRE and it was suggested to use for selection of genotypes for rice grain improvement without grain
ribution License, which permits unrestricted use,
selection index based on path coefficients. The aim of most ing programmes is simultaneous improvement of several characters. It has been recognized that most rapid improvement in the economic value is expected from selection applied simultaneously to all the characters which determine the , when appropriate weights are assigned to each character according to their relative economic importance. There is no standard procedure to assign weights to the biometrical characters in selection index. Therefore, an attempt has been made to construct selection index by taking simple correlation coefficients and path coefficients (Direct The objectives of this study were to construct selection indices, compare different weights and test the efficiency of selection indices.
AND METHODS
The investigation was conducted at Main Rice Research station (MRRS), Nawagam, Anand Agricultural University, Anand
INTERNATIONAL JOURNAL OF CURRENT RESEARCH
during kharif season of the year 2011. A set of 63 diverse genotypes of rice was laid out in randomized complete block design with three replications. The observations on grain yield and its component character were recorded from five randomly selected competitive plants for each treatment in each replication and the average values per plant were computed. Six characters were studied for this investigation i.e. grain yield (g/plant), plant height (cm), panicle length (cm), number of productive tillers per plant, 1000 grain weight (g) and harvest index. Two different weight methods were used for this study like simple correlation coefficients and path coefficients (Direct effects). A total of 63 selection indices were constructed by discriminant function techniques. The genetic gain for grain yield per plant with equal weight method was considered as base in all single as well as combination of characters. Relative to this, the per cent relative efficiency (PRE) was worked out for all the indices.
RESULTS AND DISCUSSION
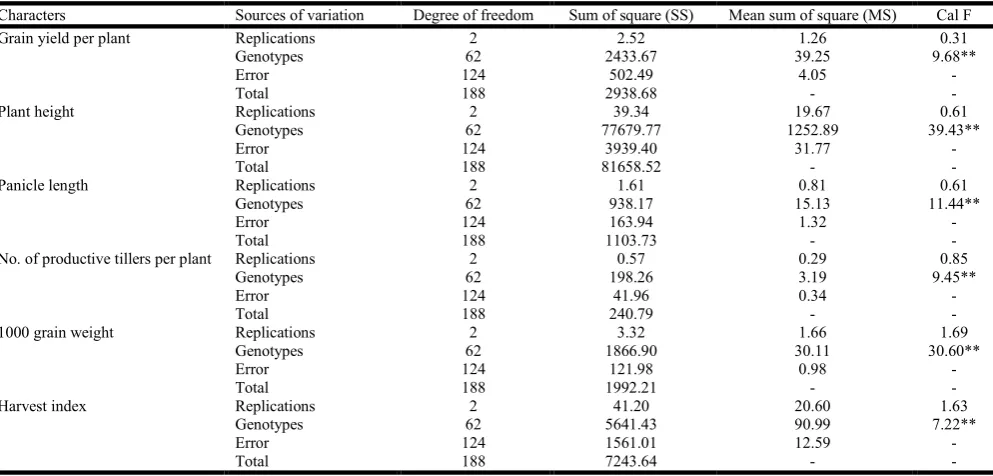
The analysis of variance results are presented in Table 1. The results presented in ANOVA indicated that variation among different genotypes for six different characters was found highly significant.
Highly significant differences of genotypes observed in respect of all the six characters were also reported by Mustufa &
Elsheikh (2007) and Tuwar et al. (2013) in rice.
The simple correlation coefficients between grain yield per plant and its component characters among themselves were estimated and presented in Table 2.The simple correlation coefficients revealed that the grain yield had positive and highly significant correlation with harvest index number of productive tillers per plant and 1000 grain weight. Plant height had positive and highly significant association with 1000 grain weight. Rest of the correlation coefficients were non-significant. Positive and significant correlation between grain yield and number of productive tillers per plant as observed in
this study was also reported by Oad et al. (2002), Chandra et
al. (2009) and Rao et al. (2011). The positive and significant
correlation between grain yield and 1000 grain weight
observed in this study was also reported by Oad et al. (2002)
and Mustafa & Elsheikh (2007).
Grain yield per plant is the result of direct effect of a particular
[image:2.595.52.549.354.592.2]causal variable and indirect effect via other yield related characters. Path coefficient analysis is used to know the
Table 1. ANOVA for yield and its component characters in rice
Characters Sources of variation Degree of freedom Sum of square (SS) Mean sum of square (MS) Cal F
Grain yield per plant Replications 2 2.52 1.26 0.31
Genotypes 62 2433.67 39.25 9.68**
Error 124 502.49 4.05 -
Total 188 2938.68 - -
Plant height Replications 2 39.34 19.67 0.61
Genotypes 62 77679.77 1252.89 39.43**
Error 124 3939.40 31.77 -
Total 188 81658.52 - -
Panicle length Replications 2 1.61 0.81 0.61
Genotypes 62 938.17 15.13 11.44**
Error 124 163.94 1.32 -
Total 188 1103.73 - -
No. of productive tillers per plant Replications 2 0.57 0.29 0.85
Genotypes 62 198.26 3.19 9.45**
Error 124 41.96 0.34 -
Total 188 240.79 - -
1000 grain weight Replications 2 3.32 1.66 1.69
Genotypes 62 1866.90 30.11 30.60**
Error 124 121.98 0.98 -
Total 188 1992.21 - -
Harvest index Replications 2 41.20 20.60 1.63
Genotypes 62 5641.43 90.99 7.22**
Error 124 1561.01 12.59 -
Total 188 7243.64 - -
** Significant at p<0.01
Table 2. Simple correlation coefficients between different characters ofrice genotypes
Characters GY PLH PL NOPT TW HI
GY 1.0000 0.1237 0.2287 0.4468** 0.4410** 0.5302** PLH 1.0000 0.1492 0.0051 0.3503** -0.2103
PL 1.0000 0.0536 0.1235 -0.0283
NOPT 1.0000 -0.1914 0.1799
TW 1.0000 0.1960
HI 1.0000
** Significant at p<0.01 level; n = 63
Where, GY: Grain yield per plant, PLH: Plant height, PL: Panicle length, NOPT: Number of productive tillers per plant, TW: 1000 grain weight, HI: Harvest index
Table 3. The direct (diagonal) and indirect (off diagonal) effects of causal characters of rice genotypes on ricegrain yield
Sr. No. Characters PLH PL NOPT TW HI Correlation with GY 1 PLH 0.0323 0.0236 0.0023 0.1480 -0.0826 0.1237
[image:2.595.111.484.742.805.2]contribution of several characters towards grain yield. The path analysis will provide better valuable information for the selection of important characters in grain yield improving programs. The direct and indirect effects of five causal variables on the rice grain yield per plant are given in the Table 3.The results of path analysis revealed that among different characters, number of productive tillers per plant had the highest direct effect followed by 1000 grain weight, harvest index and panicle length. Plant height had negligible direct-
effect on rice grain yield. The character having high direct effect are having higher influence in yield. Most of the indirect effects via other characters were more or less very small indicating least indirect influence in rice grain yield. Positive and highest direct effect of number of productive tillers per plant, 1000 grain weight and harvest index on grain yield of
rice in present study were also reported by Chandra et al.
[image:3.595.107.495.199.794.2](2009), Hasan et al. (2010) and Jha et al. (2016).
Table 4. Selection indices with their genetic gain and per cent relative efficiency (PRE) with simple correlation coefficients weight
method (W1)
Sr. No. Indices Equations Genetic Gain PRE
1 I1 I=0.743X1 6.0836 100.00
2 I2 I=0.115X2 4.963 81.39
3 I3 I=0.178X3 0.892 14.64
4 I4 I=0.33X4 0.772 12.69
5 I5 I=0.4X5 2.697 44.34
6 I6 I=0.358X6 4.585 75.40
7 I12 I=0.741X1+0.119X2 8.381 137.78
8 I13 I=0.74X1+0.285X3 6.465 106.28
9 I14 I=0.738X1+0.391X4 6.489 106.67
10 I 15 I=0.712X1+0.531X5 7.945 130.61
11 I 16 I=0.801X1+0.372X6 9.770 160.61
12 I 23 I=0.115X2+0.176X3 5.175 85.08
13 I 24 I=0.115X2+0.307X4 5.004 82.26
14 I 25 I=0.116X2+0.417X5 6.501 106.86
15 I 26 I=0.102X2+0.338X6 5.603 92.11
16 I 34 I=0.182X3+0.338X4 1.229 20.21
17 I 35 I=0.181X3+0.404X5 2.963 48.71
18 I 36 I=0.149X3+0.356X6 4.615 75.86
19 I 45 I=0.289X4+0.39X5 2.603 42.80
20 I 46 I=0.38X4+0.357X6 4.805 78.99
21 I 56 I=0.444X5+0.354X6 5.862 96.37
22 I 123 I=0.739X1+0.118X2+0.281X3 8.747 143.78
23 I 124 I=0.739X1+0.119X2+0.366X4 8.676 142.61
24 I 125 I=0.705X1+0.114X2+0.556X5 10.347 170.07
25 I 126 I=0.826X1+0.105X2+0.346X6 10.694 175.78
26 I 134 I=0.733X1+0.289X3+0.397X4 6.859 112.75
27 I 135 I=0.711X1+0.278X3+0.527X5 8.283 136.16
28 I 136 I=0.805X1+0.238X3+0.37X6 9.979 164.02
29 I 145 I=0.691X1+0.491X4+0.541X5 8.192 134.65
30 I 146 I=0.804X1+0.327X4+0.372X6 10.100 166.02
31 I 156 I=0.769X1+0.542X5+0.369X6 11.304 185.81
32 I 234 I=0.115X2+0.181X3+0.316X4 5.238 86.10
33 I 235 I=0.116X2+0.176X3+0.42X5 6.727 110.58
34 I 236 I=0.103X2+0.162X3+0.337X6 5.754 94.58
35 I 245 I=0.117X2+0.273X4+0.404X5 6.457 106.13
36 I 246 I=0.102X2+0.379X4+0.337X6 5.778 94.98
37 I 256 I=0.098X2+0.509X5+0.326X6 7.446 122.40
38 I 345 I=0.187X3+0.298X4+0.393X5 2.898 47.64
39 I 346 I=0.152X3+0.393X4+0.354X6 4.845 79.64
40 I 356 I=0.145X3+0.451X5+0.351X6 5.947 97.76
41 I 456 I=0.364X4+0.437X5+0.354X6 5.940 97.64
42 I 1234 I=0.735X1+0.118X2+0.285X3+0.371X4 9.037 148.54
43 I 1235 I=0.703X1+0.113X2+0.278X3+0.554X5 10.677 175.51
44 I 1236 I=0.83X1+0.104X2+0.242X3+0.343X6 10.953 180.04
45 I 1245 I=0.683X1+0.113X2+0.492X4+0.567X5 10.532 173.13
46 I 1246 I=0.835X1+0.104X2+0.284X4+0.345X6 10.993 180.70
47 I 1256 I=0.785X1+0.097X2+0.604X5+0.335X6 12.559 206.44
48 I 1345 I=0.689X1+0.284X3+0.492X4+0.537X5 8.528 140.18
49 I 1346 I=0.807X1+0.241X3+0.328X4+0.37X6 10.308 169.44
50 I 1356 I=0.774X1+0.229X3+0.54X5+0.366X6 11.514 189.27
51 I 1456 I=0.757X1+0.431X4+0.545X5+0.369X6 11.539 189.67
52 I 2345 I=0.117X2+0.182X3+0.283X4+0.407X5 6.693 110.01
53 I 2346 I=0.102X2+0.166X3+0.39X4+0.335X6 5.934 97.55
54 I 2356 I=0.099X2+0.154X3+0.514X5+0.324X6 7.610 125.09
55 I 2456 I=0.098X2+0.404X4+0.505X5+0.324X6 7.501 123.30
56 I 3456 I=0.149X3+0.382X4+0.446X5+0.351X6 6.033 99.16
57 I 12345 I=0.681X1+0.112X2+0.284X3+0.495X4+0.566X5 10.864 178.58
58 I 12346 I=0.839X1+0.104X2+0.244X3+0.284X4+0.342X6 11.252 184.95
59 I 12356 I=0.79X1+0.096X2+0.236X3+0.603X5+0.332X6 12.808 210.53
60 I 12456 I=0.769X1+0.097X2+0.455X4+0.61X5+0.336X6 12.767 209.86
61 I 13456 I=0.762X1+0.235X3+0.428X4+0.542X5+0.367X6 11.751 193.15
62 I 23456 I=0.098X2+0.157X3+0.42X4+0.511X5+0.321X6 7.672 126.10
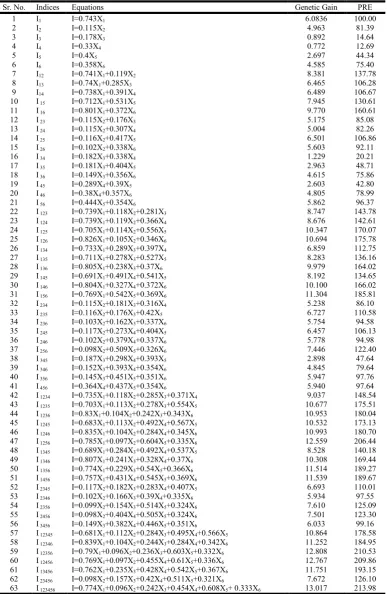
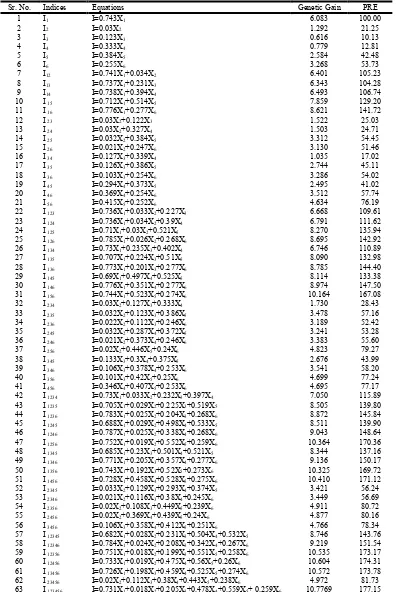
The selection indices with their expected genetic advance and per cent relative efficiency are presented in Table 4 and 5 with
simple correlation coefficients (W1) and path coefficients
(Direct effects) as a weight (W2), respectively. The genetic
gain for rice grain yield per plant (6.0836) with W1 method
was considered as a base in all single as well as combinations of characters. Relative to this, the efficiency was worked out for selection of single character for different methods. The results revealed that a progressive increase in the efficiency of selection was observed with the inclusion of additional character in the selection index.
Grain yield per plant had a highest PRE (100) for both the
weight methods among all the single characters. Index (I16),
which was combinations of grain yield per plant and harvest index had the highest PRE (160.61 and 141.72, respectively for
W1 and W2) for two characters combinations. Index (I156)
which was combinations of grain yield per plant, 1000 grain weight and harvest index showed highest PRE (185.81 and
167.08, respectively for W1 and W2) among all the indices of
combinations of three characters. When plant height added to
the index (I156), it showed the highest PRE (206.44 and 171.72,
respectively for W1 and W2) among all the indices of four
[image:4.595.101.499.212.804.2]characters combinations.
Table 5. Selection indices with their genetic gain and per cent relative efficiency (PRE) with path coefficients (Direct effects) weight method (W2)
Sr. No. Indices Equations Genetic Gain PRE
1 I1 I=0.743X1 6.083 100.00
2 I2 I=0.03X2 1.292 21.25
3 I3 I=0.123X3 0.616 10.13
4 I4 I=0.333X4 0.779 12.81
5 I5 I=0.384X5 2.584 42.48
6 I6 I=0.255X6 3.268 53.73
7 I12 I=0.741X1+0.034X2 6.401 105.23
8 I13 I=0.737X1+0.231X3 6.343 104.28
9 I14 I=0.738X1+0.394X4 6.493 106.74
10 I 15 I=0.712X1+0.514X5 7.859 129.20
11 I 16 I=0.776X1+0.277X6 8.621 141.72
12 I 23 I=0.03X2+0.122X3 1.522 25.03
13 I 24 I=0.03X2+0.327X4 1.503 24.71
14 I 25 I=0.032X2+0.384X5 3.312 54.45
15 I 26 I=0.021X2+0.247X6 3.130 51.46
16 I 34 I=0.127X3+0.339X4 1.035 17.02
17 I 35 I=0.126X3+0.386X5 2.744 45.11
18 I 36 I=0.103X3+0.254X6 3.286 54.02
19 I 45 I=0.294X4+0.373X5 2.495 41.02
20 I 46 I=0.369X4+0.254X6 3.512 57.74
21 I 56 I=0.415X5+0.252X6 4.634 76.19
22 I 123 I=0.736X1+0.033X2+0.227X3 6.668 109.61
23 I 124 I=0.736X1+0.034X2+0.39X4 6.791 111.62
24 I 125 I=0.71X1+0.03X2+0.521X5 8.270 135.94
25 I 126 I=0.785X1+0.026X2+0.268X6 8.695 142.92
26 I 134 I=0.73X1+0.235X3+0.402X4 6.746 110.89
27 I 135 I=0.707X1+0.224X3+0.51X5 8.090 132.98
28 I 136 I=0.773X1+0.201X3+0.277X6 8.785 144.40
29 I 145 I=0.69X1+0.497X4+0.525X5 8.114 133.38
30 I 146 I=0.776X1+0.351X4+0.277X6 8.974 147.50
31 I 156 I=0.744X1+0.523X5+0.274X6 10.164 167.08
32 I 234 I=0.03X2+0.127X3+0.333X4 1.730 28.43
33 I 235 I=0.032X2+0.123X3+0.386X5 3.478 57.16
34 I 236 I=0.022X2+0.112X3+0.246X6 3.189 52.42
35 I 245 I=0.032X2+0.287X4+0.372X5 3.241 53.28
36 I 246 I=0.021X2+0.373X4+0.246X6 3.383 55.60
37 I 256 I=0.02X2+0.446X5+0.24X6 4.823 79.27
38 I 345 I=0.133X3+0.3X4+0.375X5 2.676 43.99
39 I 346 I=0.106X3+0.378X4+0.253X6 3.541 58.20
40 I 356 I=0.101X3+0.42X5+0.25X6 4.699 77.24
41 I 456 I=0.346X4+0.407X5+0.253X6 4.695 77.17
42 I 1234 I=0.73X1+0.033X2+0.232X3+0.397X4 7.050 115.89
43 I 1235 I=0.705X1+0.029X2+0.225X3+0.519X5 8.505 139.80
44 I 1236 I=0.783X1+0.025X2+0.204X3+0.268X6 8.872 145.84
45 I 1245 I=0.688X1+0.029X2+0.498X4+0.533X5 8.511 139.90
46 I 1246 I=0.787X1+0.025X2+0.338X4+0.268X6 9.043 148.64
47 I 1256 I=0.752X1+0.019X2+0.552X5+0.259X6 10.364 170.36
48 I 1345 I=0.685X1+0.23X3+0.501X4+0.521X5 8.344 137.16
49 I 1346 I=0.771X1+0.205X3+0.357X4+0.277X6 9.136 150.17
50 I 1356 I=0.743X1+0.192X3+0.52X5+0.273X6 10.325 169.72
51 I 1456 I=0.728X1+0.458X4+0.528X5+0.275X6 10.410 171.12
52 I 2345 I=0.033X2+0.129X3+0.293X4+0.374X5 3.421 56.24
53 I 2346 I=0.021X2+0.116X3+0.38X4+0.245X6 3.449 56.69
54 I 2356 I=0.02X2+0.108X3+0.449X5+0.239X6 4.911 80.72
55 I 2456 I=0.02X2+0.369X4+0.439X5+0.24X6 4.877 80.16
56 I 3456 I=0.106X3+0.358X4+0.412X5+0.251X6 4.766 78.34
57 I 12345 I=0.682X1+0.028X2+0.231X3+0.504X4+0.532X5 8.746 143.76
58 I 12346 I=0.784X1+0.024X2+0.208X3+0.342X4+0.267X6 9.219 151.54
59 I 12356 I=0.751X1+0.018X2+0.199X3+0.551X5+0.258X6 10.535 173.17
60 I 12456 I=0.733X1+0.019X2+0.475X4+0.56X5+0.26X6 10.604 174.31
61 I 13456 I=0.726X1+0.198X3+0.459X4+0.525X5+0.274X6 10.572 173.78
62 I 23456 I=0.02X2+0.112X3+0.38X4+0.443X5+0.238X6 4.972 81.73
Selection index (I12356) which was combinations of grain yield
per plant, plant height, panicle length, 1000 grain weight and
harvest index showed highest PRE for W1, method while,
index (I12456) showed highest PRE for W2 methods which was
[image:5.595.52.278.194.789.2]combinations of grain yield per plant, plant height, number of productive tillers per plant, 1000 grain weight and harvest index five characters combinations.
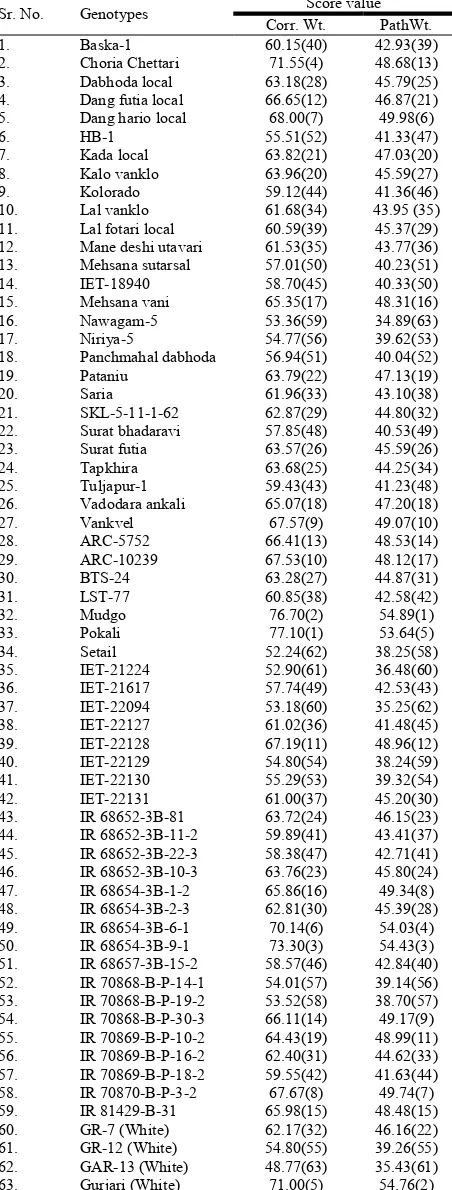
Table 6. Selection score values and ranks of rice genotypes based on best selection index for respective weight methods including
grain yield per plant
Sr. No. Genotypes Score value Corr. Wt. PathWt.
1. Baska-1 60.15(40) 42.93(39)
2. Choria Chettari 71.55(4) 48.68(13) 3. Dabhoda local 63.18(28) 45.79(25) 4. Dang futia local 66.65(12) 46.87(21) 5. Dang hario local 68.00(7) 49.98(6)
6. HB-1 55.51(52) 41.33(47)
7. Kada local 63.82(21) 47.03(20) 8. Kalo vanklo 63.96(20) 45.59(27)
9. Kolorado 59.12(44) 41.36(46)
10. Lal vanklo 61.68(34) 43.95 (35) 11. Lal fotari local 60.59(39) 45.37(29) 12. Mane deshi utavari 61.53(35) 43.77(36) 13. Mehsana sutarsal 57.01(50) 40.23(51) 14. IET-18940 58.70(45) 40.33(50) 15. Mehsana vani 65.35(17) 48.31(16) 16. Nawagam-5 53.36(59) 34.89(63) 17. Niriya-5 54.77(56) 39.62(53) 18. Panchmahal dabhoda 56.94(51) 40.04(52)
19. Pataniu 63.79(22) 47.13(19)
20. Saria 61.96(33) 43.10(38)
21. SKL-5-11-1-62 62.87(29) 44.80(32) 22. Surat bhadaravi 57.85(48) 40.53(49) 23. Surat futia 63.57(26) 45.59(26) 24. Tapkhira 63.68(25) 44.25(34) 25. Tuljapur-1 59.43(43) 41.23(48) 26. Vadodara ankali 65.07(18) 47.20(18)
27. Vankvel 67.57(9) 49.07(10)
28. ARC-5752 66.41(13) 48.53(14) 29. ARC-10239 67.53(10) 48.12(17)
30. BTS-24 63.28(27) 44.87(31)
31. LST-77 60.85(38) 42.58(42)
32. Mudgo 76.70(2) 54.89(1)
33. Pokali 77.10(1) 53.64(5)
34. Setail 52.24(62) 38.25(58)
35. IET-21224 52.90(61) 36.48(60) 36. IET-21617 57.74(49) 42.53(43) 37. IET-22094 53.18(60) 35.25(62) 38. IET-22127 61.02(36) 41.48(45) 39. IET-22128 67.19(11) 48.96(12) 40. IET-22129 54.80(54) 38.24(59) 41. IET-22130 55.29(53) 39.32(54) 42. IET-22131 61.00(37) 45.20(30) 43. IR 68652-3B-81 63.72(24) 46.15(23) 44. IR 68652-3B-11-2 59.89(41) 43.41(37) 45. IR 68652-3B-22-3 58.38(47) 42.71(41) 46. IR 68652-3B-10-3 63.76(23) 45.80(24) 47. IR 68654-3B-1-2 65.86(16) 49.34(8) 48. IR 68654-3B-2-3 62.81(30) 45.39(28) 49. IR 68654-3B-6-1 70.14(6) 54.03(4) 50. IR 68654-3B-9-1 73.30(3) 54.43(3) 51. IR 68657-3B-15-2 58.57(46) 42.84(40) 52. IR 70868-B-P-14-1 54.01(57) 39.14(56) 53. IR 70868-B-P-19-2 53.52(58) 38.70(57) 54. IR 70868-B-P-30-3 66.11(14) 49.17(9) 55. IR 70869-B-P-10-2 64.43(19) 48.99(11) 56. IR 70869-B-P-16-2 62.40(31) 44.62(33) 57. IR 70869-B-P-18-2 59.55(42) 41.63(44) 58. IR 70870-B-P-3-2 67.67(8) 49.74(7) 59. IR 81429-B-31 65.98(15) 48.48(15) 60. GR-7 (White) 62.17(32) 46.16(22) 61. GR-12 (White) 54.80(55) 39.26(55) 62. GAR-13 (White) 48.77(63) 35.43(61) 63. Gurjari (White) 71.00(5) 54.76(2) Parenthesis value indicates rank of genotypes
Combinations of all the six characters increased the PRE than five characters combinations. It was observed that simple correlation coefficients taken as a weight had more PRE than path coefficients (Direct effects) taken as a weight. From
above study this may be observed that index (I123456) had the
highest per cent relative efficiency in two weight methods, which was combinations of grain yield per plant, plant height, panicle length, number of productive tillers per plant,1000 grain weight and harvest index. It was observed that selection of many characters create difficulty at many stage and it was not maintained properly. So, looking to the simplicity of assigning weight and to get higher genetic gain and PRE,
Index (I256) is suggested to select the genotypes for rice grain
yield improvement which was combinations of plant height, 1000 grain weight and harvest index.
The score values of the genotypes were calculated with the best selection index of the respective weight methods (Table
6). In this study, index (I123456) considered as best for the both
weight methods and score value of individual genotypes were calculated and ranked them based on their score value. It was observed that rank of genotypes were more or less similar for
W1 and W2 weight methods which was depicted in Fig. 1.
Fig.1. Comparison of ranking of genotypes with W1 and W2
[image:5.595.307.561.325.433.2]methods for best selection index with rice grain yield per plant
Table 7. Rank correlations between different weight methods based on best selection index of respective weight
methodsincluding rice grain yield per plant
Weight Corr .Wt. Path Wt.
Corr .Wt. 1.000 0.997**
Path Wt. 1.000
**Significant at p< 0.01; n = 63
The spearman’s rank correlation was calculated for among the ranks of selection index score values of genotypes according to different weight methods. The correlation coefficients are given in Table 7.The spearman’s rank correlation study revealed that both weight methods had nearly perfect positive
correlation (rs ≥0.997) indicated that these two weight methods
had more or less similar ranking of genotypes based on the best selection index.
Conclusion
It was observed that index having combinations of all the six characters gave the highest per cent relative efficiency (PRE) in two weight methods but, selection of many characters create difficulty at many stage and it was not maintained properly. So, looking to the simplicity of assigning weight and to get
higher genetic gain and PRE, Index (I256) is suggested to select
[image:5.595.336.528.510.543.2]REFERENCES
Chandra, B. S., Reddy, T. D., Ansari, N. A. & Kumar, S. S. 2009. Correlation and path analysis for yield and yield
components in rice (Oryza sativa L.)! Agricultural Science
Digest, 29 (1), 45-47.
Fisher, R. A. 1936. The use of multiple measurements in
taxonomic problems! Annals of Eugenics, 7 (2), 179-188.
Hasan, M. J., Kulsum, M. U., Akter, A., Masuduzzaman, A. S. M. & Ramesha, M. S. 2011. Genetic variability and character association for agronomical traits in hybrid rice
(Oryza sativa L.)! Bangladesh Journal of Plant Breeding &
Genetics, 24 (1), 45-51.
Hazel, L. N. 1943. The genetic basis for constructions of
selection indices! Genetics, 28(6), 476-490.
Jha, A., Saxena, R. S. & Verulkar, S. B. 2016. Correlation and
path coefficients analysis of F3lines derived from a cross
between Swarna Subl and IR 84984-83-15-862-B of rice
(Oryza sativa L.)! Environment & Ecology, 34 (4B),
2093-2096.
Mustafa, M. A. & Elsheikh, M. A. Y. 2007. Variability, correlation and path coefficient analysis for yield and its
components in rice! African Crop Science Journal, 15 (4),
183-189.
Oad, F. C., Samo, M. A., Hassan, Z. U., Cruz, P. S. & Oad, N. L. 2002. Correlation and path analysis of quantitative characters of rice ratoon cultivars and advanced lines!
International Journal of Agriculture & Botany, 4 (2),
204-207.
Rao, V. T., Bhadru, D., Mohan, Y. C. & Bharathi, D. 2011. Identification of yield components as selection criteria
under aerobic condition in rice! Crop Research, 42 (1, 2 &
3), 15-17.
Smith, F. 1937. A discriminant function for plant selection!
Annals of Eugenics, 7 (3), 240-250.
Tuwar, A. K., Singh, S. K., Sharma, A. & Bhati, P. K. 2013. Appraisal of genetic variability for yield and its component
characters in rice (Oryza sativa L.)! Biolife, 1 (3), 84-89.