ISSN Online: 2159-4481 ISSN Print: 2159-4465
DOI: 10.4236/jsip.2018.93010 Aug. 9, 2018 167 Journal of Signal and Information Processing
Graph Based Filtering and Matching for Symbol
Recognition
Vaishali Pawar, Mukesh Zaveri
Department of Computer Engineering, SVNIT, Surat, India
Abstract
Pattern recognition is a task of searching particular patterns or features in the given input. The data mining, computer networks, genetic engineering, chemical structure analysis, web services etc. are few rapidly growing applica-tions where pattern recognition has been used. Graphs are very powerful model applied in various areas of computer science and engineering. This pa-per proposes a graph based algorithm for pa-performing the graphical symbol recognition. In the proposed approach, a graph based filtering prior to the matching is performed which significantly reduces the computational com-plexity. The proposed algorithm is evaluated using a large number of input drawings and the simulation results show that the proposed algorithm out-performs the existing algorithms.
Keywords
Graphs, Pattern Recognition, Information Retrieval, Graph Matching, Data Mining
1. Introduction
In pattern matching application, a retrieval of input patterns from a database of model patterns is the most important issue. In graph based recognition techniques the model symbols and the input images are also represented using the primitive graph or by a set of sub graphs. These sub graphs may be consi-dered as a pattern for symbol recognition. In this context, the graph based symbol recognition is the pattern matching task. Graph is always a versatile tool for representing and modeling the patterns. Graph can contain huge amount of data due to its representational power. So they are preferred to represent objects with a huge number of attributes. Finding object similarity is an important issue in many applications such as pattern recognition, information retrieval and data
How to cite this paper: Pawar, V. and Zaveri, M. (2018) Graph Based Filtering and Matching for Symbol Recognition. Journal of Signal and Information Processing, 9, 167-191.
https://doi.org/10.4236/jsip.2018.93010
Received: February 22, 2018 Accepted: August 6, 2018 Published: August 9, 2018
Copyright © 2018 by authors and Scientific Research Publishing Inc. This work is licensed under the Creative Commons Attribution International License (CC BY 4.0).
http://creativecommons.org/licenses/by/4.0/
DOI: 10.4236/jsip.2018.93010 168 Journal of Signal and Information Processing
mining etc. Design strategy of any pattern recognition or matching algorithm depends on the representation of the object under consideration and attributes of the object. If graphs are used for object representation, then the problem of determining the similarity of objects becomes the problem of graph matching.
The general form of graph matching problem includes the graph and sub-graph matching algorithms. An inevitable disadvantage of most of sub-graph matching techniques is that they all suffer from high computational complexities [1] [2]
[3] [4]. The problem becomes more complex if the database is large in size. In
this context, it is essential to reduce computational complexity using different techniques like dimension reduction, pre-processing of the data, and transfor-mation of data to feature space etc. One of the preprocessing techniques for compact representation of data is filtering which is applied prior to the match-ing. As the data is represented with a large set of attributes using the graph, there is a need to have an efficient graph based filtering approach to handle this task. The main purpose of having graph database filtering is to reduce the number of database candidates to be matched against the input. In this paper, we present a novel shape based graph database filtering algorithm for optimizing the symbol recognition which is robust and efficient in terms of performance. The overall process of graph matching is to find a good mapping between the vertices and edges of two graphs that satisfy some constraints [5] [6]. In a broad sense, there are two classes of graph matching: exact graph matching and inexact graph matching. In the exact matching [7] [8], a strict bijective mapping is expected between the two graphs to be matched. Graph isomorphism [7] [8] and sub graph isomorphism [7] [8] can be considered as the subclasses of exact graph matching. In the inexact matching [5], the bijective condition is considerably re-laxed. The inexact graph matching algorithms are more flexible to accept errors and distortions of the matching object graphs. Therefore, inexact graph match-ing is also known as error-tolerant graph matchmatch-ing [5] [7] [8]. The rest of the paper is organized as follows. Section 2 describes the literature survey of differ-ent graph matching algorithms. Section 3 introduces the proposed the graph based filtering technique. The simulation results are described in Section 4. It is followed by the conclusion and future work.
Literature Survey
In all classes of graph matching, subgraph isomorphism is a NP-complete
prob-lem [9] [10]. But it is still an open research area to decide whether the graph
DOI: 10.4236/jsip.2018.93010 169 Journal of Signal and Information Processing
process and pruning unprofitable paths in the search space [1] [6] itself. In graph pruning approach there is no restriction on the size and structure of the graphs to be matched. Some algorithms make use of database clustering [15] and filtering [16] techniques to narrow down the search space of graph matching. Our algorithm is based on graph symbol database hierarchical filtering which is applied prior to the graph matching process. A hierarchically structured ap-proach to organize large structural databases has been presented in [17]. The patterns are modeled in the form of random parametric structural descriptions (RPSDs). Objects in image are modeled as parametric structural descriptions (PSDs). The organization process is controlled by pairwise dissimilarity values between RPSDs. The node pointer lists are computed offline during model base organization [17]. During recognition, the only exponential matching process involved is between the scene PSD and the RPSD at the root of the organized tree. Using the organized hierarchy along with the node pointer lists, the task is reduced to tree matching which linearly tests at the subsequent levels of the tree
[17]. Other approaches like hierarchical [18] and hashed [19] databases have been presented for an efficient graph database organization. In most of the algo-rithms the overall process of graph matching is subdivided into preprocessing part and the actual matching part. The preprocessing part reorganizes the graph database which reduces the graph searching and matching.
In [4] [20] a decomposition approach for model graph has been suggested.
The whole model graph data is modeled as network of decomposed graph. [4]
uses decomposition approach for preprocessing of the model symbols. Due to the offline preprocessing and filtering of the database, graph matching time be-comes sublinearly dependent on the database size [4]. In the last few years, few attempts have been made to combine the best of the graph and the vector do-mains in order to get the advantages of both techniques. Another approach for graph database reduction using feature vector has been suggested in [21]. In
analy-DOI: 10.4236/jsip.2018.93010 170 Journal of Signal and Information Processing
sis which are very important applications for architectural and historical pers-pective. For these applications, the first and most important task is to extract the features as these are not regular or structured objects. Second, using these fea-tures how to represent the complete object, i.e., input drawing image or symbol for recognition, using the graph so that efficient graph based matching algo-rithm can be implemented.
2. Problem Statement
Although several statistical techniques have been proposed for symbol recogni-tion [23] [24], graph based structural methods always play their prime role. The selection of graph based pattern matching strategy is always subjective to type of pattern. The selection of appropriate type of graph for specific applications with appropriate graph matching algorithm is the key. The symbols appearing in the graphical symbol recognition are not specific and regular in nature. Especially archived documents, historical documents or images are in degraded form. The analysis, content retrieval, restoration, digitization of such data is a challenge. These images are distorted or noisy. Many document images are not clear. These symbols have enormous attributes. It is always a challenge to achieve a graph based solution for any pattern matching application which can perform or work in the presence of distortion and noise. Even if using graphs is the wise option, the size of graph databases is quite large. Storing symbols in database and se-lecting features for graph matching are key factors. There is no generalised, the best suitable policy available for all the real life pattern matching applications. It is important to have a mechanism which will reduce heavy time complexity of graph matching techniques. Graph based filtering is a process of pruning object database to optimize graph matching. Applying the graph based filtering algo-rithm prior to graph matching reduces the size of database. As for the sake of convenience, we consider architectural symbol recognition. The database con-tains model symbols that are used as symbols in architectural drawings. Both the database and input image are modelled using region adjacency graph. When an input architectural plan image is given to identify symbols from the model data-base, it is an efficient approach to perform filtering and then matching. In this context, it is required to have filtering algorithm, specifically the graph based fil-tering, as we model input using graph.
3. Problem Formulation
DOI: 10.4236/jsip.2018.93010 171 Journal of Signal and Information Processing
copyright protection for trademark symbol, product review or sign language interpretation. In brief, we want to propose an algorithm for model symbol recognition where the model symbol may be regular or irregular shape like window, shelf, bed or any architectural symbol etc. These model symbols can be represented using primitive graphic structures like triangle, rectangle or irregu-lar shape geometry etc. It allows one to represent original object in a better way to ease the process of pattern extraction and pattern matching. Here, only as-sumption is that any regular or irregular shape may be represented by the graph. In the context of above discussion, we exploit the graph to represent any model symbol in our input image. Throughout the work, the terms, the primi-tive graphic symbol or model symbol, are used interchangeably with the mean-ing that it forms a smean-ingle closed region or an entity or a set of closed regions and a set of entities which can be used as a model graph when the given graphical symbol object or input drawing is decomposed and represented by the graph. In short, from a given object the features or attributes are extracted and these fea-tures or attributes can be described using the graph. For example, a simple trian-gle has three sides and three antrian-gles which form an entity or a closed region with sides and angles as features or attributes of a given object. This triangle becomes a graph with a single vertex, representing a closed region with angles, area, sides as attributes of the vertex.
In our proposed algorithm, we use such graphical symbol objects or input drawings as an input which are decomposed into a set of closed regions or enti-ties as described above and stored into the database. For each entity, we extract the features like area of the shape, angles if any, sides, centroid etc. which are nothing but attributes of an entity or primitive graph model symbol. The data-base with these decomposed objects is called as a graph datadata-base. Another im-portant feature that we extract from the input is region adjacency graph (RAG) which provides neighborhood information for a set of closed regions or entities that how they are interconnected with each other. This is also stored as an attribute of a vertex along with other attributes. The RAG formation is the process of establishing a relationship between regions with the help of extracted features.
Our main task is to use these features and attributes to filter out the graph da-tabase to reduce to number of model graph comparisons with a test input. To perform this, we index our database using the features and attributes of a vertex. Here, the meaning of indexing is to reorganize the graph database by grouping of model symbols having similar entities or closed regions as a part of given model symbol. Then, searching is performed using this indexed database which is nothing but filtering of the database. This process is explained as shown below
in Figure 1. For example, given a graphical symbol or input drawing image
DOI: 10.4236/jsip.2018.93010 172 Journal of Signal and Information Processing
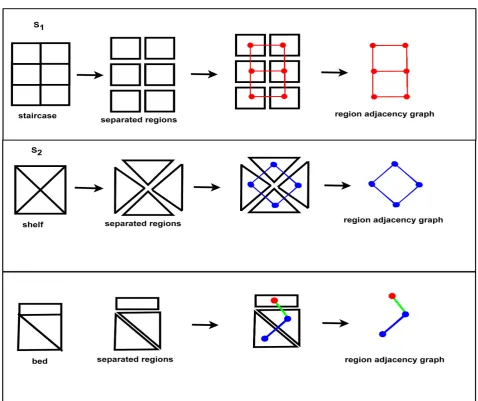
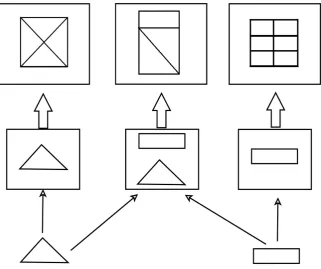
Figure 1. Symbol representation.
vertex. The adjacent regions’ attributes are represented by the edge between them. As depicted in Figure 1, symbol S1 is a model staircase, S2 is a shelf and Sn
is a bed. The vertex of RAG represents a closed region in the symbol. The edge between two vertices in a RAG represents the neighbourhood attributes of the two adjacent regions in the symbol. The staircase contains all same regions which are rectangular in nature. The RAG of staircase is shown in red colour in a symbolic way. It indicates that all the vertices are of same type. So all the ver-tices are in red colour. The adjacency of the verver-tices is shown by the edges. As all the vertices have similar attributes, all the edges are also carrying similar edge properties; hence, all edges are red in color.
DOI: 10.4236/jsip.2018.93010 173 Journal of Signal and Information Processing
of rectangular region. The blue vertices represent triangular regions. The blue edge represents neighbourhood of two blue vertices. The green edge represents neighbourhood of one red and one blue neighbouring vertex.
After representing the model symbols as RAG, the objects are indexed in the database based on the shapes. We propose two variants, linear filtering and the hierarchical filtering. The linear filter filters the symbols in a linear manner, based on the number of shapes. If the model symbols contain exclusive shapes, linear filter performs well. If the input image contains almost all symbols, linear filter performs as good as no filtering of the database. The hierarchical filter ar-ranges the symbol indices based on hierarchy of shapes. It performs well even if the input image is a good mix of all types of shapes.
For example, S1 and S2 are indexed using rectangle and triangle which allows one to do further filtering. If a given input object is decomposed such that one of the closed region is a rectangle then directly it searches to the subgroup of ob-jects in the database which is indexed using rectangle which avoids a linear fil-tering or comparison with all objects stored in the database. If a given object is having different types of closed regions then it is indexed using each type of closed region which it consists of. The advantage of such representation is that for searching a given object; the algorithm explores only the subgroup of objects for which an index is matching, which is nothing but filtering out the large number of objects from database being compared. The filtering algorithms are elaborated in the next section. It also is important to note that the features or attributes can be of great help to filter the database. Given a graph database, the salient features are extracted by a feature extraction procedure. The procedure itself should be fast and efficient. The selection of features should be based on the nature of application. Once the features of the graph are extracted, then the database is filtered and only the selective graphs are matched against the input graph. So the matching of an input graph against all prototypes in the database is avoided. If the filtering process is fast enough, the graph matching algorithm saves considerable number of comparisons.
isomor-DOI: 10.4236/jsip.2018.93010 174 Journal of Signal and Information Processing
phism [2] [3] [25] can be used. Using above formulation, the proposed graph based filtering algorithm is described in the following section.
4. A Novel Algorithm for Graph Filtering and Matching
For graph based symbol recognition the query image is given as input to the al-gorithm. The input drawing may consists of many graphical symbols. The fea-ture extraction is performed. The closed regions are extracted. The input image is represented as a RAG. The graph based symbol database contains the dictio-nary of all symbols used in the application. These symbols are called database model symbols. The graph based filtering and matching is performed to identify the occurrence of model symbols in the input image. Figure 2 explains the con-cept of graph based filtering and matching. The important thing to note is, fil-tering is a process carried out during graph matching. While matching the input image graph G1 and the model symbol graph GM, graph based filtering is per-formed. The filtering algorithm selects few promising symbols from the model database and filters out the non-promising ones. The graph matching algorithm matches the input graph with the selected promising model symbol graphs.
In our approach, we propose two types of the filtering, namely, graph based linear and hierarchical filtering for graphical symbol recognition. The overall symbol recognition is achieved in three steps as preprocessing, graph filtering followed by the graph matching. The filtering algorithm filters the model symbol database. If the model symbol GM is likely to be similar with the symbols of the input image, it selects GM as promising symbol else it is non-promising. We perform a shape based graph database filtering of the database. For filtering we consider two approaches as 1. Shape based graph database linear filtering and 2. Shape based graph database hierarchical filtering.
[image:8.595.59.533.574.705.2]After the graph database filtering, the number of model symbols to be matched with the input graph reduces considerably, which reduces graph matching time. We use region adjacency graph (RAG) based string growing al-gorithm [7] for the graph matching. In brief, the overall symbol recognition is achieved in three steps 1) preprocessing and feature extraction, 2) the graph da-tabase filtering and 3) the graph matching algorithm. In our implementation, we
DOI: 10.4236/jsip.2018.93010 175 Journal of Signal and Information Processing
use RAG based string growing algorithm [7] for the graph matching. We com-pare our hierarchical graph database filtering with a standard linear graph data-base filtering approach to show efficacy of our proposed algorithm. These steps are described in detail as below.
4.1. Preprocessing and Feature Extraction
In this step, the input image and the model symbols of the database are prepro-cessed. It performs primitive operations like thinning, bridging and identifica-tion of juncidentifica-tions and end points, region separaidentifica-tion etc. for the model symbols and input image. It extracts features like edges, corners, junctions, end-points, closed regions in the image. Each closed region is treated as a basic constituting entity in the symbol or input image. The structural features like area of region, centroid and shape of region etc. are extracted for each region. After region wise feature extraction, the symbols and input image is represented as a RAG. Each closed region is represented as a vertex of the graph. All the neighbouring re-gions are adjacent to each other with their extracted attributes. The relationship between these regions or vertices and their attributes is important for further processing.
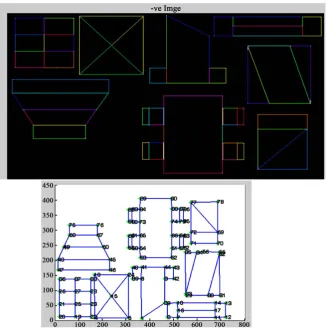
The extracted features of the regions are represented as labels or attributes of the vertices or region in the RAG. After RAG formation each symbol or image is treated as a region adjacency graph with vertices as regions and edges as their inter-relationships. The perfection in feature extraction leads to more accuracy in the graph matching. The results of preprocessing the input image are shown
in Figure 3. As discussed earlier, the preprocessing extracts constituent shapes
of all the model symbols in the database. The status of model symbols after shape detection is listed in Table 1. It depicts the number of constituent basic shapes in each model symbol. Table 2 shows results of region separation and feature extraction for model symbols in the database. Overall, the database mod-el symbols and the input image are described as the region adjacency graphs in this step.
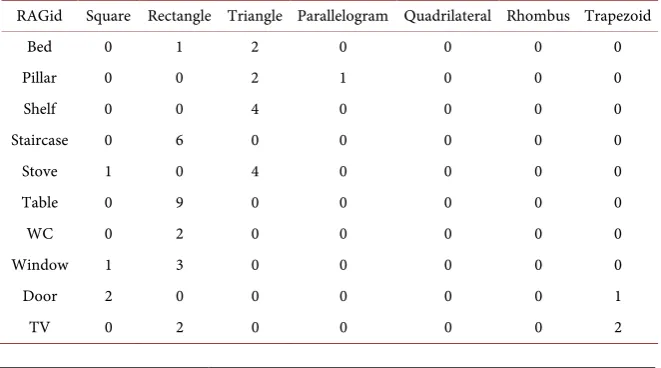
Table 1. Model symbol database after shape detection.
RAGid Square Rectangle Triangle Parallelogram Quadrilateral Rhombus Trapezoid
Bed 0 1 2 0 0 0 0
Pillar 0 0 2 1 0 0 0
Shelf 0 0 4 0 0 0 0
Staircase 0 6 0 0 0 0 0
Stove 1 0 4 0 0 0 0
Table 0 9 0 0 0 0 0
WC 0 2 0 0 0 0 0
Window 1 3 0 0 0 0 0
Door 2 0 0 0 0 0 1
[image:9.595.209.540.554.738.2]DOI: 10.4236/jsip.2018.93010 176 Journal of Signal and Information Processing
Figure 3. Result of input image preprocessing.
Table 2. Result of region separation and RAG construction.
RAGid Nr of Region Nr of Edges Symbol Name Priority
Shelf 4 4 Shelf 4
Staircase 6 7 Staircase 3
Bed 3 3 Bed 2
Window 4 5 Window 1
Pillar 3 2 Pillar 7
Table 9 8 Table 5
Stove 5 4 Stove 6
TV 4 3 TV 8
Door 3 2 Door 9
[image:10.595.209.539.450.620.2]DOI: 10.4236/jsip.2018.93010 177 Journal of Signal and Information Processing
edge end points, junctions, corners are recorded as number of vertices for every closed region. While preprocessing, we also specify a tolerance value to extract these vertices for better a valuation and to show efficacy of our proposed me-thod. The tolerance value greatly affects the result of preprocessing and so the result of symbol recognition as well. During the pre processing, shape of region is one of the important features useful for the database filtering. The status of model symbols database after shape detection is listed below in Table 1. It de-picts the number of constituent basic shapes in each model symbol.
For example, Table 1 shows that, model symbol “bed” consists of one rectan-gle and two trianrectan-gles as constituent shapes. The “pillar” consists of two trianrectan-gles and one parallelogram; the “staircase” symbol consists of six rectangles as the constituent shapes. Table 2 shows results of region separation and some feature extraction for model symbols in the database. The features like “Number of re-gions”, “Number of edges” are extracted for each of the model symbol. The “RAGid” is the identity number of the model symbol graph in the database. The “Priority” is the numeric value assigned to each symbol by the user for selecting a particular symbol to be matched against the input image. Table 1 and Table 2
are interlinked tables generated during feature extraction and preprocessing. In both tables, the first column consists of RAGid using model symbol name. Table 1 displays the primitive shapes detected in the respective model symbol depicted in first column. Table 2 depicts the detailed features like number regions, edges and priority in the model symbol. Here, a priority value represents in which or-der the model symbol is searched in the given input image. Lower the value of priority, that model symbol is searched first. Priority helps in linear sequencing of the matching process. The priority value for each model symbol is set by the user based on application which allows one to tune our proposed algorithm for a specific application.
4.2. Graph Based Filtering
After preprocessing, we apply graph based filtering algorithm which filters the database of model symbols with respect to the input image. It causes reduction in the number of symbols to be tested in the later phase of graph matching. It reduces the number of model symbols that are to be compared with the input image during graph matching. This filtering is done based on the constituent shapes of the input image and the constituent shapes of the model symbol graph database. The filtering algorithms are explained below.
Linear Filter
DOI: 10.4236/jsip.2018.93010 178 Journal of Signal and Information Processing
input graph do not match further graph matching is avoided. Figure 4 depicts the linear filtering.
As shown in Figure 4, consider two symbols S1, a “staircase” and symbol S2 as a “stove”. The symbol Sn is shown as a “bed”. During the preprocessing, database records that S1 comprises six rectangular shapes, S2 constitutes four triangles and
Sn comprises one rectangle and two triangular shapes. Consider, “bed” is the in-put image. Preprocessing of inin-put image identifies that the inin-put image contains one rectangle and two triangular shapes. So, at the time of graph matching, S1,
S2, Sn, all three model symbols are compared with the input image as all three of them are containing either a rectangle or a triangle, which is there in the input image. If input image is a “staircase”, preprocessing of input image concludes that input comprises six rectangular shapes. So the matching is performed with
S1 and Sn only as they are having rectangle as one of their constituents. Compar-ison of the input with S2 is avoided as S2 do not have rectangle as its constituent. If input image is a “stove”, comparison of input with S1 is is avoided as S1 do not have triangle as its constituent. Figure 4 elaborates this process.
Hierarchical Filter
[image:12.595.213.538.423.708.2]In hierarchical filtering the basic constituent shapes are arranged hierarchi-cally in the database. The individual basic constituent shapes are at level 0. At level 1, a combination of any two shapes is considered for filtering. At level 2 a combination of any 3 shapes is considered and so on the hierarchy goes on. The advantage of this type of hierarchy is that the shapes that do not occur in the
DOI: 10.4236/jsip.2018.93010 179 Journal of Signal and Information Processing
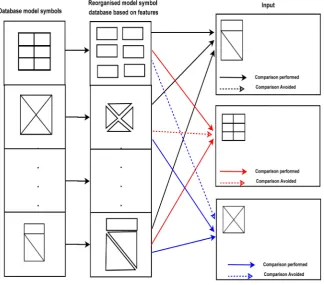
input image are skipped in graph matching algorithm, which further reduces high cost graph matching operations. Figure 5 and Figure 6 depict single level shape based representation of the model symbols. In Figure 5, the first column represents the database model symbol. The second column in Figure 5
[image:13.595.213.536.418.712.2]represents the decomposed model symbols of respective database model symbol. After decomposition, the database is reorganized using indexing. The indexing is performed based on constituent shape. This step is illustrated using third and fourth column of Figure 5. The process of shape based indexing is further illu-strated with an example in Figure 6, where the triangle and rectangle are primi-tive model shapes shown at the bottom in Figure 6 are indices to the database model symbols presented at the top in the figure. When an input image is pre-sented for matching, the features of the input image are extracted. Based on the constituent shapes of the input image, shape based filtering is performed on the database which reduces the number of symbols to be matched. If the total data-base size is of say “n” model symbols, only “m” symbols are selected as relevant symbols to be matched with the input graph. The “n-m” models from the data-base are rejected as irrelevant symbols, and hence, “n-m” symbols are not matched with the input image. The observation is that, shape detection and fil-tering procedure adds extra time to the database construction. But it is impor-tant to note that the database construction is a onetime offline activity. The deci-sion, which symbol to be matched and which symbol not to be matched, is taken at the time of graph matching. In this context, our hierarchical filtering
DOI: 10.4236/jsip.2018.93010 180 Journal of Signal and Information Processing
Figure 6. Hierarchical shape based indexing of the database.
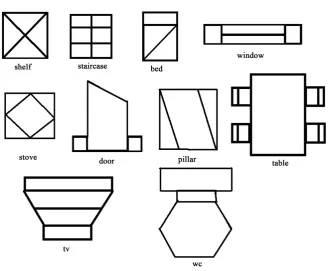
approach provides an efficient solution for graph based matching. Few model symbols from the database are shown in Figure 7.
4.3. Graph Matching Algorithm
After the preprocessing and database construction, the graph based symbol matching is performed. For graph based matching, the RAG based string grow-ing algorithm is applied for the architectural symbol recognition. An architec-tural plan containing various architecarchitec-tural symbols is given as an input. The identification of various model symbols from the database is performed in this step by using the string growing algorithm [7]. It reads each symbol one by one from the database and compares it with the input RAG. While comparing three basic operations are considered as substitute, shift and scale [7]. The substitution operation matches each region by comparing the regions. The shift operation matches the angular rotation to the neighbouring regions. The scaling cost matches expansion or shrinkage of the regions. The cost of mapping the input region with model region is calculated for each region. This cost is called as graph edit cost. The most promising match is accepted as a result. Figure 12
shows the results of symbol identification for different input images. The algo-rithm performs the following steps:
1) Read each prototype symbol linearly from the database.
DOI: 10.4236/jsip.2018.93010 181 Journal of Signal and Information Processing
Figure 7. Model symbol database.
3) Consider the regions, which are below threshold level for further matching. 4) Continue region matching till the prototype symbol is identified otherwise no match is found.
5) Conclude that the symbol is matching.
5. Simulation Results
We evaluated our proposed algorithm using architectural drawings. The input architectural plans are line drawing images. We consider both types of architec-tural images, 1) normal images, where all symbols are properly visible and 2) distorted images where the symbols are error-prone. For our implementation we have a model symbol database which constitutes the large number of model symbols. The few such architectural model symbols are depicted in Figure 7. We evaluate our proposed graph database filtering and matching algorithm using three different scenarios as below.
Scenariol 1: Symbol detection with graph matching without database filtering; Scenariol 2: symbol detection with linear filtering the graph database and Scena-riol 3: symbol detection with hierarchical filtering of graph database.
DOI: 10.4236/jsip.2018.93010 182 Journal of Signal and Information Processing
Figure 8. Vertex deletion due to tolerance.
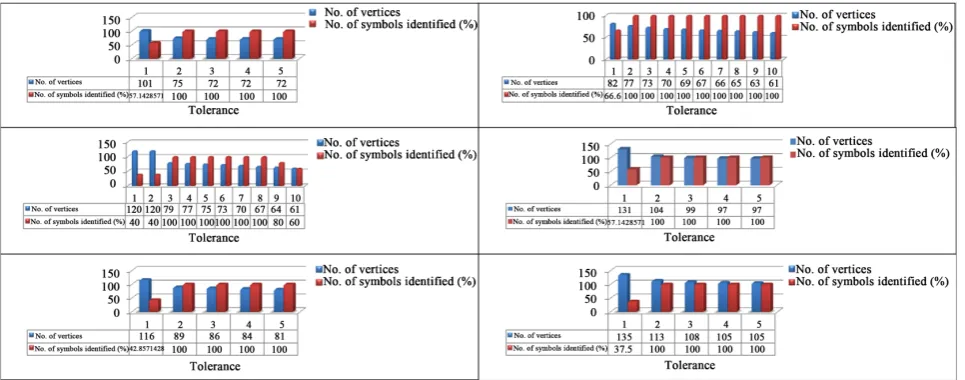
vertices with increasing tolerance value is shown plotting the values in Figure 9. To a certain limit, the decrease in number of vertices is very sharp. The decreas-ing number of vertices signifies about loosdecreas-ing the features. For a specific value of the tolerance, number of vertices remains same. Figure 9, shows the stable re-gion of number of vertices from 72 to 69, where tolerance value is ranging from 5 to 19. After this stability, the further increase in the tolerance results in loss of vertices which are at vital position in the image. Deletion of these vertices changes the basic shape of a symbol in the input image. This is the reason pre-processing affects the global results of symbol detection.
Figure 10, shows the effect of tolerance on the symbol recognition. When
to-lerance value is 8, number of vertices identified in the feature extraction is 72. When tolerance is 10, number of vertices is 71. It looses the significant vertex number 18, which is critical for identifying the symbol door in the image. So the resultant output of graph matching fails to identify symbol door as shown in
Figure 10 with tolerance value 10.
Figure 11, shows the graph of tolerance in relation with number of vertices
identified during feature extraction and the number of symbols identified. The tolerance value is varied from 1 to 5. The output shows that the system remains stable and identifies maximum number of symbols when tolerance value re-mains 2 to 5. Ideally, we keep tolerance value 3 or 4 for further testing.
After the preprocessing, the model symbol database is reorganized in hierar-chical manner based on the constituent shapes. The model symbols are indexed on the basis of constituent shapes of the models. When an input image is given, the graph isomorphism algorithm is applied to recognize model symbols in it.
Figure 12 shows identified symbols in the input image. Various symbols
“stair-case”, “door”, “table”, “window”, “shelf” are identified with variable error toler-ance for the Scenario 1.
Figure 13, shows the result of symbol recognition in the hand drawn image.
DOI: 10.4236/jsip.2018.93010 183 Journal of Signal and Information Processing
[image:17.595.59.542.517.707.2]Figure 9. Effect of tolerance on vertices.
Figure 10. Tolerance and symbol recognition.
DOI: 10.4236/jsip.2018.93010 184 Journal of Signal and Information Processing
Figure 12. Symbol detection output.
Figure 13. Symbol detection in noisy image.
Figure 14 depicts another example of symbol recognition with hand drawn
image. It is observed that if the image contains both very small and very large symbols at same time then the error tolerance factor given for graph matching fails to balance. The error tolerance introduced before graph matching, cannot suit to find very small and very large symbols at the same time. This is because, the smaller symbols need lower tolerance value for accurate features extraction where as the larger symbols can be identified with higher tolerance values. For a stable system, the input image must contain average size symbols.
[image:18.595.212.538.365.509.2]DOI: 10.4236/jsip.2018.93010 185 Journal of Signal and Information Processing
Figure 14. Symbol recognition in hand drawn image.
system gets a particular level of stability for that tolerance limit. The error toler-ance value is subjective to accuracy expected by the various applications. There cannot be any automatic inference method for tolerance which can suit globally to all pattern matching applications. Its estimation is a challenging job which purely depends on the type of application.
Figure 15 shows that the graph matching algorithm shows robustness to
DOI: 10.4236/jsip.2018.93010 186 Journal of Signal and Information Processing
number of symbols take more number of comparisons. The conclusion is that on an average 2/3 number of times comparisons are avoided due to filtering than that of without filtering which is significant achievement.
There is an acceleration gain using hierarchical graph filtering. By inclusion of the filtering stage overall efficiency is enhanced for graph based symbol recogni-tion compared to graph matching without filtering.
[image:20.595.102.546.179.718.2]We compared the time taken for graph processing without using filtering [7]
[image:20.595.211.537.189.474.2]Figure 15. Distorted symbol recognition.
[image:20.595.60.452.520.705.2]DOI: 10.4236/jsip.2018.93010 187 Journal of Signal and Information Processing
and with filtering. Figure 17 shows the results of time comparison for graph processing time with graph filtering algorithm and without graph filtering algo-rithm. The images on the x-axis are arranged in the increasing order of their siz-es. The first image is the smallest image with minimum number of regions while the last image sample shows the largest image with maximum number of re-gions. When we do not apply filtering, the graph processing time is minimum as shown in the graph 17. The linear filtering takes little more time than that of one without filtering.
[image:21.595.75.376.250.472.2]The hierarchical filtering algorithm takes maximum graph processing time in all the three scenarios. We compared the time taken for graph matching without using filtering [7] and with filtering. Figure 18 shows the comparison of graph
[image:21.595.75.526.449.705.2]Figure 17. Graph processing time using filtering.
DOI: 10.4236/jsip.2018.93010 188 Journal of Signal and Information Processing
[image:22.595.232.517.249.704.2]matching time taken for symbol recognition with graph filtering and without graph filtering [7]. It is clearly seen that the graph matching time without filter-ing for all the samples is maximum. In eight of the samples out of eighteen, li-near filtering is performing better than hierarchical filtering time. In other ten samples out of eighteen images, hierarchical filter based graph matching time is the minimum one. We evaluated the proposed method with large number of input drawings of different varieties which include basic symbols, hand drawn images, distorted images and architectural plans. The thumbnails of images we have used for testing the algorithm are shown in Figure 19. The important point is that some of input drawings have 40 closed regions. In the simulation results we have depicted some of them.
DOI: 10.4236/jsip.2018.93010 189 Journal of Signal and Information Processing
6. Conclusion
In this work we have proposed and evaluated graph filtering and matching for symbol recognition. Architectural plan images are provided as input to the algo-rithm. The graph matching is done by region adjacency graph matching [7] [8]
based on string growing matching. It is observed that when we use only graph matching (without filtering) the number of comparisons done is more as com-pared with graph matching with filtering. Filtering prior to matching reduces drastically the number of matching model symbols available in the database averagely by 2/3 times. Ultimately this reduces the time taken for pure matching process, although the graph processing time increases more rapidly with symbol recognition with graph filtering than that of without filtering. In that case it is expected that graph databases processing and filtering is to be done offline prior to graph matching process for best results as a combination. The algorithm for graph matching has very strong restrictions about images due to “specificness” of symbols for different applications. It’s always a challenge to achieve a general platform for various applications and their distortion accepting capacities and needs.
Conflicts of Interest
The authors declare no conflicts of interest regarding the publication of this pa-per.
References
[1] Ullman, J.R. (1976) An Algorithm for Subgraph Isomorphism, Journal of ACM, 23, 31-42. https://doi.org/10.1145/321921.321925
[2] Fernandez, M.L. and Valiente, G. (2001) A Graph Distance Metric Combining Maximum Common Subgraph and Minimum Common Supergraph. Pattern Rec-ognition Letters, 22, 753-758. https://doi.org/10.1016/S0167-8655(01)00017-4
[3] Raymond, J.W. and Willett, P. (2002) Maximum Common Subgraph Isomorphism Algorithms for the Matching of Chemical Structures. Journal of Computer-Aided Molecular Design, 16, 521-533. https://doi.org/10.1023/A:1021271615909
[4] Messmer, B. and Bunke, H. (1998) A New Algorithm for Error-Tolerant Subgraph Isomorphism Detection. IEEE Transactions on Pattern Analysis and Machine Intel-ligence, 20, 493-505. https://doi.org/10.1109/34.682179
[5] Conte, D., Foggia, P., Sansone, C. and Vento, M. (2004) Thirty Years of Graph Matching in Pattern Recognition. International Journal of Pattern Recognition and Artificial Intelligence, 18, 265-298. https://doi.org/10.1142/S0218001404003228
[6] Cordella, L.P., Foggia, P., Sansone, C. and Vento, M. (2004) Subgraph Isomorphism Algorithm for Matching Large Graphs. IEEE Transactions on Pattern Analysis and Machine Intelligence,26, 1367-1372.
[7] Llados, J., Marti, E. and Villanueva, J.J. (2001) Symbol Recognition by Error-Tolerant Subgraph Matching between Region Adjacency Graphs. IEEE Transactions on Pat-tern Analysis and Machine Intelligence, 23, 1137-1143.
https://doi.org/10.1109/34.954603
DOI: 10.4236/jsip.2018.93010 190 Journal of Signal and Information Processing
to Recognize Textured Symbols. In: Blostein, D. and Kwon, Y.B., Eds., Graphics Recognition Algorithms and Applications, Springer, Berlin, Heidelberg, 128-138. [9] Garey, M.R. and Johnson, D.S. (1979) Computers and Intractability: A Guide to the
Theory of NP-Completeness. W. H. Freeman & Co., New York.
[10] Cook, S.A. (1971) The Complexity of Theorem-Proving Procedures. Proceeding of
3rd ACM Symposium on Theory of Computing, Shaker Heights, 3-5 May 1971, 151-158. https://doi.org/10.1145/800157.805047
[11] Luks, E.M. (1980) Isomorphism of Graphs of Bounded Valence Can Be Tested in Polynomial Time. 21st Annual Symposium on Foundations of Computer Science, Syracuse, 13-15 October 1980, 42-49.
[12] Datta, S., Limaye, N., Nimbhorkar, P., Thierauf, T. and Wagner, F. (2009) Planar Graph Isomorphism Is in Log-Space. 24th Annual IEEE Conference on Computa-tional Complexity, Paris, 15-18 July 2009, 203-214.
https://doi.org/10.1109/CCC.2009.16
[13] Foggia, P., Sansone, C. and Vento, M. (2001) A Performance Comparison of Five Algorithms for Graph Isomorphism. Proceeding of the 3rd IAPR Workshop on Graph Based Representations in Pattern Recognition, 23 May 2001, 188-199, [14] Bunke, H. (1999) Error Correcting Graph Matching: On the Influence of the
Un-derlying Cost Function. IEEE Transactions on Pattern Analysis and Machine Learn-ing,21, 917-922.
[15] Joyner, I. and Holder, L.B. (2001) Graph-Based Hierarchical Conceptual Clustering.
Journal of Machine Learning Research, 2, 19-43.
[16] Irniger, C. and Bunke, H. (2005) Decision Trees for Error-Tolerant Graph Database Filtering. 5th IAPR International Workshop, Vol. 3434, Poitiers, 11-13 April 2005, 301-311.
[17] Sengupta, K. and Boyer, K. (1995) Organizing Large Structural Model Bases. IEEE Transactions on Pattern Analysis and Machine Intelligence, 17, 321-332.
https://doi.org/10.1109/34.385984
[18] Shapiro, L. and Haralick, R. (1982) Organization of Relational Models for Scene Analysis. IEEE Transactions on Pattern Analysis and Machine Intelligence, 3, 595-602.https://doi.org/10.1109/TPAMI.1982.4767312
[19] Sossa, H. and Horaud, R. (1992) Model Indexing: The Graph-Hashing Approach.
Proceedings of IEEE Conference on Computer Vision and Pattern Recognition, Champaign, 15-18 June 1992, 811-814.
[20] Messmer, B. and Bunke, H. (1999) A Decision Tree Approach to Graph and Sub-graph Isomorphism. Pattern Recognition, 32, 1979-1998.
https://doi.org/10.1016/S0031-3203(98)90142-X
[21] Riesen, K. and Bunke, H. (2009) Dissimilarity Based Vector Space Embedding of Graphs Using Prototype Reduction Schemes. Proceedings of the 6th International Conference on Machine Learning and Data Mining in Pattern Recognition, Leipzig, 23-25 July 2009, 617-631.
[22] Irniger, C. and Bunke, H. (2003) Theoretical Analysis and Experimental Compari-son of Graph Matching Algorithms for Database Filtering. Proceedings of 4th IAPR International Workshop on Graph Based Representations in Pattern Recognition, Vol. 2726, 30 June-2 July 2003, 118-129.
https://doi.org/10.1007/3-540-45028-9_11
Pro-DOI: 10.4236/jsip.2018.93010 191 Journal of Signal and Information Processing
ceedings of the 2nd International Conference on Circuits, Systems, Communica-tions and Computers, Puerto De La Cruz, 71-79.
[24] Li, M.J. and Dai, R.W. (1995) A Personal Handwritten Chinese Character Recogni-tion Algorithm Based on the Generalized Hough Transform. The Proceedings of the
3rd International Conference on Document Analysis and Recognition, Vol. 2, Montreal, 14-16 August 1995, 828-831.