warwick.ac.uk/lib-publications
Original citation:Zeng, Jing and Glaister, Keith W. (2017) Value creation from big data : looking inside the black box. Strategic Organization.
Permanent WRAP URL:
http://wrap.warwick.ac.uk/86027 Copyright and reuse:
The Warwick Research Archive Portal (WRAP) makes this work by researchers of the University of Warwick available open access under the following conditions. Copyright © and all moral rights to the version of the paper presented here belong to the individual author(s) and/or other copyright owners. To the extent reasonable and practicable the material made available in WRAP has been checked for eligibility before being made available.
Copies of full items can be used for personal research or study, educational, or not-for profit purposes without prior permission or charge. Provided that the authors, title and full bibliographic details are credited, a hyperlink and/or URL is given for the original metadata page and the content is not changed in any way.
Publisher’s statement:
Zeng, Jing and Glaister, Keith W. (2017) Value creation from big data : looking inside the black box. Strategic Organization. Copyright © 2017 The Authors. Reprinted by permission of SAGE Publications.
https://doi.org/10.1177/1476127017697510 A note on versions:
The version presented here may differ from the published version or, version of record, if you wish to cite this item you are advised to consult the publisher’s version. Please see the ‘permanent WRAP url’ above for details on accessing the published version and note that access may require a subscription.
1 Value Creation from Big Data: Looking Inside the Black Box
Abstract
The advent of big data is fundamentally changing the business landscape. We open the “black
box” of the firm to explore how firms transform big data in order to create value and why
firms differ in their abilities to create value from big data. Grounded in detailed evidence
from China, the world’s largest digital market, where many firms actively engage in value
creation activities from big data, we identify several novel features. We find that it is not the
data itself, or individual data scientists, that generate value creation opportunities. Rather,
value creation occurs through the process of data management, where managers are able to
democratize, contextualize, experiment, and execute data insights in a timely manner. We
add richness to current theory by developing a conceptual framework of value creation from
big data. We also identify avenues for future research and implications for practicing
managers.
Key words: Big data, Resource management, Knowledge-based view, Open innovation,
2 INTRODUCTION
Increasingly, companies are exploring how big data can be used to create and capture value
(McKinsey Global Institute, 2011). ‘Big data is about massive amounts of observational data,
of different types, supporting different types of decisions and decision time frames (Goes,
2014: vii). The use of big data enables managers both to know fundamentally more about
their businesses, and to translate that knowledge into better decision-making and improved
performance (McAfee and Brynjolfsson, 2012). For example, Netflix is able to collect data
by monitoring when customers pause, rewind or fast forward, from their browsing and
scrolling behaviour, and identify customer preferences based on the ratings given to the
content. By analysing these data, Netflix is able to predict the popularity of its content and
purposefully design content based on the data insights generated from customers.
Like analytics that preceded it, big data analysis seeks to gather intelligence from data and
translate that into business advantage, however, key characteristics mean that big data is more
powerful than the analytics that were formerly used (McAfee and Brynjolfsson, 2012). These
characteristics relate to the volume of data created; its velocity, i.e., the speed of data creation
makes available real-time or close to real-time information; and its variety, big data is
generated from a plurality of sources (George et al., 2014). McAfee and Brynjolfsson (2012)
point out that while analytics brought rigorous techniques to decision making, big data is both
simpler and more powerful. Added to this the steadily declining costs of computing,
including storage, memory, processing and bandwidth, mean that previously expensive
data-intensive approaches are becoming economical.
In seeking a technology-based competitive advantage, central to growth and success,
exploitation of big data enables companies to create and capture value. Big data and
3 could not before (LaValle et al., 2011). The research findings of McAfee and Brynjolfsson
(2012) show that the more companies characterized themselves as data-driven, the better they
performed on objective measures of financial and operational results. Similarly, the study by
LaVale et al., (2011) clearly connects performance and the competitive value of analytics.
Although organizations are exploring ways of deploying and harnessing big data to create
and capture value, many are struggling with how to create value from the significant amount
of data they already have owing to its volume, velocity and variety (Goes, 2014; Lavalle et al.
2011). Indeed, merely possessing a valuable resource does not guarantee the development of
value creation (Barney and Arikan, 2001; Priem and Butler, 2001a, 2001b; Sirmon et al.
2007). Lepark et al. (2007) define value creation as the relative amount of value that is
subjectively realized by a target user and this subjective value realization must at least
translate into the user’s willingness to exchange a monetary amount for the value received. In
order to realize value creation, firms must effectively accumulate, combine and exploit
resources (Grant, 1991; Sirmon et al. 2007). However, the understanding of how managers
manipulate resources in order to create value is largely underdeveloped (Barney and Arikan,
2001; Kraaijenbrink et al., 2010; Priem and Butler, 2001a; Sirmon et al. 2007). More
recently, scholars and practitioners have noted the necessity for empirical investigation of the
process of transforming big data to create value (Bharadwaj et al. 2013; Georg, et al, 2014;
Goes, 2014; Munford, 2014). In response to this, our aim is to examine how firms transform
big data to create value, and further to investigate why firms differ in their abilities to create
value from big data.
We seek to make a contribution by exploring the value creation process in a Chinese context
for three reasons. First, China is the world’s largest digital market. Due to the scale of the
country’s economy and its engagement in the digital market, understanding how the leading
4 combinations of cultural heritage, rapidly developed infrastructure and digital market have
created a distinct business phenomena embedded in a special context (Whetten, 2009).
Research that focuses on the Chinese context therefore serves to make an important
contribution to knowledge (Tsui, 2007; Whetten, 2009). Third, many Chinese companies
were able to keep foreign competitors, such as Google, eBay and Amazon, at bay (Zeng and
Glaister, 2016). Therefore, understanding the process of how firms in China manage big data
to create value should stimulate novel insights into “local” organizational practices and foster
improvements in borrowed theory (Tsui, 2007; Whetten, 2009).
Our study makes an important contribution by answering the call to investigate how
managers create value from big data (Bharadwaj et al., 2013; George et al., 2014; Goes,
2014; Munford, 2014). Drawing on qualitative data, we observe that firms differ in their
abilities to extract value from big data, both internally within the firm and externally across
the extended data-sharing network. We highlight the process of data management where
managers are able to democratize, contextualize, experiment, and execute data insights in a
timely manner to create value. Further, we move beyond the value creation process at the
firm level of analysis to the network-level of analysis. By sharing data with its partners, the
firm is able to build a leadership position depending on its capability to establish, maintain
and reinforce symbiotic relationships with its partners. We also contribute to the organization
structure literature. We suggest that firms that combine improvisation with low-to-moderately
structured rules to execute a variety of opportunities that emerge from big data are more
flexible and able to respond to market shifts.
We structure the paper as follows. In the next section, we provide a review of the relevant
literature. We then set out the study’s methods, including the sampling strategy, the interview
protocol, and the data analysis. We then discuss the findings, offer an overarching framework
5 THEORETICAL BACKGROUND
Our focus here is on the value creation process from big data at the firm level, a topic that has
so far received very limited attention from management scholars (George et al., 2014; Rai,
2016). We review four streams of literature that are related to the dynamic context in which
our studies were carried out, namely, resource management, knowledge-based view,
organization structure and network collaboration that highlights extracting value from big
data. We review this literature by probing its applicability to the specific context of creating
value from big data.
Resource management
The resource-based view (RBV) of strategic management postulates that the competitive
advantage of a firm lies primarily in its application of the bundle of tangible and intangible
assets, resources and capabilities that are rare, valuable, non-substitutable and difficult to
imitate (Barney, 1991; Rumelt, 1984), which firms need to manage, adopt, and deploy in
product markets in order to create value (Mahoney, 1995; Sirmon et al., 2007). Such superior
resources result in greater value creation i.e. an advantage in competition (Barney, 1991;
Hoopes et al., 2003). Simply owning resources does not guarantee the development of value
creation (Barney and Arikan, 2001; Priem and Butler, 2001a, 2001b; Sirmon et al., 2007).
Resource management is critical to value creation because using resources is at least as
important as possessing or owning them (Hansen et al. 2004; Penrose, 1959). Different
resource management processes can yield heterogeneous outcomes for organizations holding
similar resources and facing similar environmental contingences (Zott, 2003; Lippman and
Rumelt, 2003).
A small but growing number of researchers have attempted to elucidate the role of managers
6 example, Sirmon et al. (2007) defined resource management as the comprehensive process of
structuring, bundling and leveraging the firm’s resources with the purpose of creating value
for customers and competitive advantages for the firm. In parallel with research on the
development of resource management, Helfat et al. (2007) developed a related logic that
focused on asset orchestration emerging from the dynamic capability literature. Dynamic
capabilities are an extension of RBV, and highlights explicitly the role of managers when
they “purposefully create, extend or modify [the firm’s] resource base” to create value to
achieve sustainable advantages (Amit and Schoemaker, 1993; Eisenhardt and Martin, 2000;
Teece et al. 1997; Winter, 2003).
Although a growing number of researchers attempted to look inside the “black box”,
additional theory development is required to add richness to our current understanding of
how to manage resources to create value in dynamic environments (Hefat et al., 2007; Sirmon
et al., 2011). This is particularly the case for big data. What is particularly interesting about
data is that it often increases in value the more it is used. Moreover, it is self-regenerative, in
that the identification of a new piece of information immediately creates both the demand for,
and conditions for production of, subsequent pieces (Huber, 1984; Porat, 1976; Stiglitz,
1975). The unique characteristics of big data differ significantly from those of traditional
physical assets that are generally appropriable (“either I have it or you have it”), scarce,
decrease return to use and are non-renewable (Porat, 1976; Stiglitz, 1975; Glazer, 1991).
Kraaijenbrink et al. (2010) proposed that differentiating between resources and emphasizing
their different characteristics could prove fruitful to offer a more robust explanation of RBV.
Existing understanding of resource management literature has not distinguished the
differences between rivalrous and non-rivalrous resources, nor is it safe to assume that
existing theory could be extended to account for the value creation from big data.
7 The knowledge-based view (KBV) in strategy has largely extended resource-based reasoning
by suggesting that knowledge is the primary resource underlying new value creation,
heterogeneity, and competitive advantage (Barney, 1991; Grant, 1996; Kogut & Zander,
1996). Proponents of this view perceive knowledge as the principal strategic resource, and
argue that firms supersede markets in their ability to create and harness this resource
(Eisenhardt and Santos, 2001). The KBV proposes that the primary reason for the existence
of the firm is its superior ability to integrate multiple knowledge streams, for the application
of existing knowledge to tasks, as well as for the creation of new knowledge (Grant, 1996).
Grant (1994: 375) further states that “At the heart of this theory is the idea that the primary
role of the firm, and the essence of organizational capability, is the integration of
knowledge”.
The knowledge based view highlights the role of the individual as the prime driver in the
creation of organizational knowledge (Nonaka, 1994), and conceptualizes the existence of a
firm as an institution that integrates knowledge that resides within and across individuals
(Grant, 1996). While some scholars have argued the primacy of the individual (Grant, 1996;
Simon, 1991), most have focused on a collective locus of knowledge (Eisenhardt and Martin,
2000; Winter, 2003; Zollo & Winter, 2002). The role of data scientists is often accentuated as
the key source of knowledge that has direct impact in contributing to the firm’s value creation
opportunities from big data (Davenport and Patil, 2012). A data scientist is a specialized
individual who possesses tacit knowledge to understand and analyse big data (Davenport and
Patil, 2012). An interesting question follows: Is value creation from big data about the
attributes and abilities of the individual data scientist involved, or is value creation from big
data about a collective process that is independent of individuals such as data scientists?
Further, as knowledge does not always flow easily within the organization, another question
8 in the context of big data? Research has yet to shed light on such questions. Felin and
Hesterly (2007: 213) pointed to the need for empirical investigation of the individual drivers
of knowledge-based value: “Thus opening up the proverbial black box of the firm by
explicating the underlying a priori capabilities and knowledge of the individuals involved
provides a natural starting point and micro foundation for explaining the creation of new
value”.
Organization structure
The postulate of a trade-off between efficiency and flexibility has gained increasing attention
from management and strategy scholars (Rindova and Kotha, 2001; Rothaermel et al., 2006;
Davis, Eisenhardt and Bingham, 2009). Organizations with too little structure have limited
guidance to generate appropriate behaviors efficiently (Weick, 1993; Okhuysen and
Eisenhardt, 2002; Baker and Nelson, 2005), while organizations with too much structure are
over-constrained and lack flexibility (Siggelkow, 2001; Martin and Eisenhardt, 2010). This
dilemma has created a “paradox of administration” (Thompson, 1967:15) because
organizations operating in a dynamic business environment require both efficiency and
flexibility. In order to manage this dilemma, scholars have pointed out that a moderate
structure balance between these two extreme states will lead to high performance (Bingham
et al., 2007; Weick, 1976). Research shows that high performing organizations resolve this
tension by using a moderate amount of structure to improvise a variety of high-performing
solutions (Brown and Eisenhardt, 1997, 1998). For example, Brown and Eisenhardt (1997)
found that high-tech firms with a moderate number of simple rules (i.e., semi-structure) are
more flexible and efficient (quickly creating high quality, innovative products while
9 This stream of enquiry is particularly relevant in the context of big data. The magnitude of
data volume and the speed at which it should be analysed and acted upon requires
organization to be flexible and agile to cope with a flow of opportunities that emerge from the
data insights. Extant literature has been built around the central argument of how an
organization balances flexibility and efficiency, to the neglect of key factors that are relevant
to big data. For example, with limited managerial attention, how can a firm manage
flexibility and efficiency when it seeks to capture heterogeneous opportunities in the big data
context that, as noted, is high volume, high velocity and high variety? With a group of
specialists, such as data scientists, who are able to generate data insights, how should the firm
be structured in order to transmit knowledge across its boundaries in order to maximize the
value from big data? A superior knowledge base can be associated with greater flexibility and
faster reaction to environment changes (Grant, 1996), how then should a firm be structured to
be able to execute the data insights in a timely manner in order to appropriate value? An
understanding of how organizational structure shapes flexibility and enables fast reaction in a
big data context is crucial to providing additional insights to the existing literature.
Network collaboration
Departing from the traditional RBV, this stream of research contains efforts to differentiate
firms in terms of their ability to build unique resources from external alliances (Dyer and
Singh, 1998; Lavie, 2006). It complements the RBV by arguing that critical resources may
span firm boundaries and therefore a firm needs to build relational rent from a network of
alliance relationships in order to gain “complementarity”, “co-specialization”, and “synergy”
resources that ultimately leads to superior firm performance (Lavie, 2006; Lippman and
Rumelt, 2003; Mahoney and Pandian, 1992; Peteraf, 1993). By building such alliances, firms
that are part of an inter-connected network can gain access to resources without paying their
10 building relation-specific assets with a firm’s close alliance partners can be safeguarded by a
contractual or long-term relationship agreement (Dyer and Singh, 1998). Open networks are
characterised by alliances that are multi-firm based, with partners operating on a “modular”
basis, moreover, they are dynamic as the scope of the sharing network evolves over time as
new members join (Bharadwaj, et al., 2013; Han et al., 2012). This contrasts with firm
collaboration in a closed alliance context which accentuates a centralized approach and a
firm’s bargaining power to ensure its ability to generate superior economic rent (e.g., Gulati
and Gargiulo, 1999; Lavie, 2006), a model which no longer appears sufficient to provide a
robust explanation for superior firm performance in the new information age.
Inspired by Chesborough (2003), open innovation highlights that as the boundary between a
firm and its environment becomes more permeable, external ideas are important information
resources for the firm’s competitive advantage. Many scholars proposed an Open
Collaborative Ecosystem (OCEs) (Baldwin and Von Hippel, 2011; Curley and Formica,
2013) and Open Strategy (Tavakoli et al., 2015) that underscores integrated collaboration,
with co-created shared value and innovative network. This was manifested by companies
such as Facebook, Alibaba and Apple, that started to investigate the significant potential
beyond conventional boundaries in order to tap into unique ideas from various constituencies
within the innovative ecosystem through open platform strategy. Such an open process
enriches a company’s own knowledge base through the synergetic effect from external
resources, which leads to a great increase of a company’s innovativeness (Laursen and Salter,
2006). As a result, firms are able to accelerate the rate of innovation and consequently create
a more compelling competitive position (Chesborough and Appleyard, 2007). Although
research in this domain has focused strongly on concepts such as open innovation and open
11 to create value arguably remains in a black box (Bharadwaj, et al., 2013; Goes, 2014;
Munford, 2014; Sirmon, Hitt and Ireland, 2007).
Taken together, these brief summaries of the dominant themes in theory and research clearly
demonstrate their value in understanding the process of value creation. Studies from
information technology (IT) research streams also illuminate the magnitude and impact of
data-related analytical problems in business organizations. A growing number of IT
researchers have articulated the significant impact of big data and how big data is going to
transform the business landscape (Goes, 2014; Rai, 2016; Chen, Chiang and Storey, 2012).
However, despite the great effort devoted to emphasise the significance of big data, many
firms are still struggling to capture value opportunities associated with big data. Recently,
scholars have attempted to bridge the disciplines between information system strategy and
strategy-as-practice and called for a joint agenda to take full advantage of such theoretical
synergies (Lazer, Pentland and Adamic, 2009; Giles, 2012; Whittington, 2014). As yet, there
does not appear to be a holistic explanation of “how” firms transform big data to create value,
as well as why variations exist across firms in relation to their capabilities to manage big
data. This understanding is important, as recent researchers and practitioners suggest that data
is playing an increasingly significant role in driving the sustainable value creation of the firm
(George et al. 2014; Koutroumpis and Leiponen, 2013; McAfee and Brynjolfsson, 2012;
Mckinsey Global Institute, 2011).
It follows from these observations that the best way to understand the process of managing
big data to create value is to undertake an inductive analysis that, while building on existing
literature, allows new analytical insights on how big data drives the value creation of the
firm. The purpose of this study is twofold. First, we look inside the “black box” and explore
how firms transform big data to create value. Second, as some firms are more able to create
12 from big data. In the following section, we elucidate our study’s sample, data collection,
interview protocol, and data analyses.
RESEARCH METHOD
We adopt a “naturalistic inquiry”, which applies inductive logic to obtain insight (Lincoln
and Guba, 1985). Inductive studies are particularly helpful in developing and extending new
theoretical insights and when the research question is process oriented, such as ours. Multiple
case studies were adopted in order to create the opportunity to triangulate information
collected and to augment external validity, help guard against observer bias and allow for
replication logic (Eisenhardt, 1989; Miles and Huberman, 1994; Yin, 2003). This approach
allows us to extend existing theory and accordingly develop theoretical explanations for the
observed phenomena (Locke, 2001).
Research setting
Internet platform companies (IPCs) are the setting of our research, and one where the core
product is data. First, IPCs such as, Alibaba, are the epitome of data-based organizations
because they are established on the internet and have been collecting data since their
inception (Doan et al. 2011). Compared to traditional companies that largely depend on
physical assets to drive internal and supply-side efficiency, IPCs primarily depend on their
ability to generate information to enable/facilitate the interaction between different groups of
users in order to create value (Parker and Van Alstyne, 2005). Thus, the value of data is
particularly salient in the context of IPCs. Second, rather than protecting data that has been
accumulated and collected by the firm, many IPCs open up their platforms and share their
data with third parties. This phenomenon provides an interesting lens to understand how
firms transform such open data to create value. The owners of open platforms normally
13 the supply of the platform, including its technology, database and interaction with the focal
platform’s users (West, 2003). This differs fundamentally from open source software where
individual programmers and users develop a range of software applications and distribute
them to the public for free.
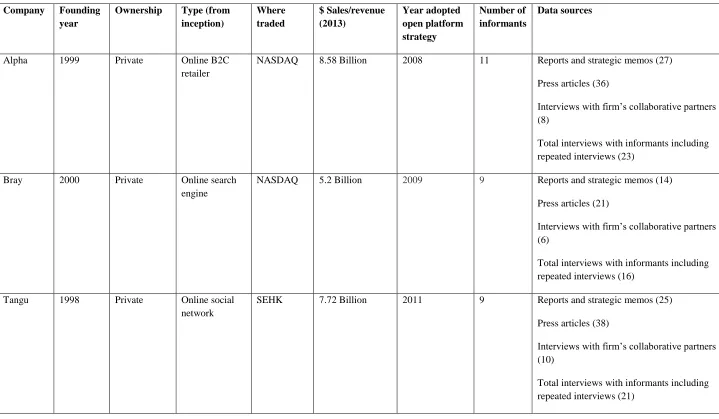
Following a purposeful sampling method (Eisenhardt, 1989; Miles and Huberman, 1994), we
selected five firms in the IPC industry ranging from an e-commerce platform, a web search
engine to a web instant messaging provider. All firms are publicly held. As shown in Table
1, five companies, that were previously successful with a proprietary platform strategy and
have adopted ‘open platform strategies’ (West, 2003) in the last eight years, were eventually
selected for this study. Among these five firms, we selected three firms that had been
successful in creating value from big data and two that had not. We defined successful value
creation as our informants did, in terms of positive characteristics (e.g., ‘made a huge
difference to our job’) and negative ones (e.g., ‘too much hype, don't see the point’). The
firms were selected as the unit of analysis.
[Insert Table 1 about here]
Data collection
We obtained information from four sources: 1) semi-structured interviews with 42 informants
from the sample firms, including CEOs, directors and senior managers who were usually one
level subordinate to the CEO, and with senior data engineers in significant roles in their
companies; a total of 34 additional interviews with the IPCs’ partner firms and third party
developers and repeated semi-structured interviews with the same participants through on-site
visits and conversations via telephone, Skype and WeChat; 2) reports and strategic memos
produced by the companies for the period between February 2008 and March 2013; 3)
14 between March 2000 and July 2014; 4) informal follow-ups with emails and phone calls for
clarification. This diverse range of sources was designed to improve the likelihood of gaining
a complete and accurate picture (Yin, 2003) as well as providing textual accounts of debates
and discussions and strengthening confidence in the findings (Jick, 1979).
The semi-structured interviews were conducted in Chinese, ranged from 60 to 150 minutes,
recorded (unless disallowed by the interviewees) and transcribed verbatim within a week of
the interviews by the first author and professional transcribing and translating service
provider. The interviews were structured into four sections. First, we asked questions about
the background and business strategy of an informant’s firm. Second, using an open-ended
format we asked the informant to describe the process by which firms transform big data to
create value and key challenges they have encountered during such value creation process.
We then asked informants to describe the role of data experts such as data scientists in
contributing to the value creation process. This was followed by questions about how
managers’ action/abilities influence the value creation process. More details of the interview
questions can be found in the Appendix.
We adopted a “court room” style of interviewing, pushing for concrete illustrations to
increase the data trustworthiness (Eisenhardt and Graebner, 2007). Additional interview
questions were added to the interview protocol in order to probe emergent themes or to take
advantage of special opportunities that may have arisen in a given situation (Eisenhardt,
1989). We assured anonymity to informants to encourage candour. The steps taken are likely
to have mitigated informant and other biases and provided detailed and accurate accounts.
Data analysis
We began by conducting within-case descriptions, where the case studies were built based on
15 taking notes and writing narratives. For this purpose, we focused on analyzing the interview
data as well as integrating and triangulating facts from various data sources. Triangulation of
archival and interview data enables richer and more reliable description of each case (Jick,
1979) and improves construct validity (Yin, 2003). This process led to the discovery of
different modes of value creation as well as the mechanisms that enable/inhibit such value
creation processes.
Next, cross case analysis was conducted, looking for similar constructs and themes in the
cases (Eisenhardt and Graebner, 2007). To preserve the integrity of replication logic across
cases (Eisenhardt, 1989; Yin, 2003), we began this cross-case analysis after most data had
been collected. As research progressed, we sought to verify the emerging dynamics by using
supplemental data sources, especially non-interview data (Jick, 1979). From the emerging
constructs and themes, we identified the tentative relationships between constructs and
attempted to discern correlational tendencies between the value creation modes and the
mechanism of enablers and inhibiters. We then used replication logic to further refine these
initial relationships by visiting frequently each case in order to compare and contrast the
specific constructs, relationships and logics. To ensure the validity of the analysis and theory
building, we presented our analysis in an academic workshop in order to stimulate and induce
alternative explanations. The latter were accepted or rejected based on their consistency with
the data and/or theoretical logic. We continued reading broadly in an effort to gain insight
into the data (Glaser and Strauss, 1967). As the theoretical frame clarified, we compared it
with the extant literature to highlight similarities and differences, strengthen the internal
validity of findings, sharpen construct definitions and raise the generalizability of the
emergent theory. We also presented the inductive model to informants inviting their
feedback and comments. These interactions were conducted through face-to-face meetings,
16 RESULTS: AN INDUCTIVE THEORY OF VALUE CREATION FROM BIG DATA
Through iteration of the data described in the previous section, a theoretical framework
emerged. Our inductively derived theoretical framework of value creation from big data is
shown in Figure 1.
[Insert Figure 1 here]
The framework shown in Figure 1 helps to explain how firms manage big data to create value
and why firms differ in their abilities to perform better than others. To trace the chain of
causation, we have identified two modes of value creation processes from big data. Creating
value from internal data is transaction-driven, where the firm mainly focuses on data analysis
to generate superior economic rent that can be exclusively enjoyed by the firm. Creating
value from the firm’s open data network is relation-driven, where the firm mainly focuses on
data collaboration to generate superior economic rent that can be collectively enjoyed by the
firm and its partners. Looking inside the “black box”, we found that data is location, context
and relevance sensitive; when it is combined with different ideas and datasets, it enables
firms to see new, better and different patterns that are impossible to see in isolation.
The findings revealed that some firms are better than others in transforming big data to create
value. In as much as there are gains from an internal data set, that is, when firms are able to
democratize, contextualize, experiment withdata and execute data insights in a timely manner
to create value, these firms generally perform better than others in creating value from the
firm’s internal data network. Gains from data collaboration with external partners tend to
reinforce gains from creating value from an internal dataset, which generate greater value
creation opportunities when coupled with additional capabilities and datasets. In order to
become the leader in an inter-connected data network, a firm’s central position is largely
17 processes, and of its technology relevancy to provide a data infrastructure that can facilitate
data flows and data exchange within the firm’s extended data network. Therefore, the
differences in gains from data mining and gains from data collaboration were caused by
heterogeneity between firms’ capabilities to harness data internally and heterogeneity
between firms’ capabilities to manage relationships externally.
In the following section, we discuss each value creation mode in further detail. We then shift
the focus of the analysis from the question of how firms transform big data in order to create
value to examine why firms differ in their abilities to create value from big data.
FINDINGS
Two distinct patterns of value creation modes from big data emerged from the empirical
evidence: creating value from the firm’s internal data set and creating value from the firm’s
external data network (see Figure 1). Our analysis indicates that the modes of value creation
from big data exhibit common features (the firm’s capability to harness the data internally
and its capability to manage relationships with external partners in an open data network)
with variations in explaining how some firms are able to generate value better than others
from the same value creation process. In this section, we first provide a brief picture of each
mode, and then present a second layer of findings explaining why some firms differ in their
capabilities to create value from big data better than others. We intersperse the narratives
with significant quotes intended to illustrate our interpretation, as recommended by Langley
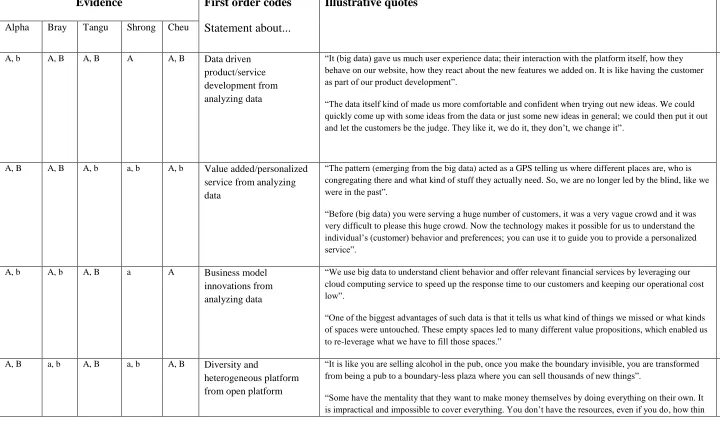
and Abdallah (2011), and we display additional selected quotes in Table 2, to illustrate and
document the robustness of our claims.
[Insert Table 2 about here]
18 This pattern of value creation refers to the process of exploiting and exploring a large volume
of data from the firm’s internal database in order to identify consistent patterns and
systematic correlations among different variables in a particular representational form, and
transforming these insights into actions that leads to identification of new opportunities for
creating value that increase the customer’s willingness to use/pay. The selected IPCs have
accumulated a large volume of data over time which allows sophisticated analysis and pattern
matching. There is a recurring theme among all companies that exploiting data enables a firm
to conduct “demand driven” product/service development. A senior director from Alpha
commented:
Every time customers use our platform, they left a trail of bread crumbs about who they are, what they like, etc. There are many types of data; administrative data, transactional data, behaviour data and real time data, etc. For example, we rely on customer behaviour data to understand how they react to where we place the click button, the size and font of words displayed on the website, the colour, shape. (Alpha, 04a)
In a similar vein, Tangu divided user activity data from one particular product into three
categories: early product utilization stage, peak product utilization stage and end of product
utilization stage. This chain of evidence enables Tangu to gain a holistic understanding about
the entire user experience journey, which provided valuable information guiding future
product improvement and innovation.
We also noted that firms use big data to provide value added and personalized service to
different groups of consumers. Alpha introduced a series of services, such as, online store
design, account management, and transaction data analysis (number of daily orders, the
variation of daily online traffic, the metrics of visitors, sales, etc.) to assist the sellers on their
platform to improve transaction efficiency. Based on big data, Alpha was able to build its
own credit scoring model that provided comprehensive analysis about client behavior,
transaction history, credit rating and review content. This knowledge led to a range of
19 found among other IPCs. For example, Bray developed a set of big data predictive programs
for monitoring diseases like hepatitis, Chinese New Year travel, earthquakes, FIFA World
Cup victories and movie box office success. One of the senior data engineers from Bray
noted that:
Now we have the luxury to have the real-time data which can really make a difference to our lives. We can use such data to have a fairly accurate understanding about, for example, how crowded it is now at Forbidden City. Data is time sensitive too. (Bray, 009a)
As the arbiters of value, the customer plays the key role in determining the value of the
product/service offered by the firm (Priem, 2007). The data generated from the demand-side
can guide and help a firm to understand the consumer’s needs, which leads to the
identification of new opportunities for creating value that increase the customer’s willingness
to use/pay. Firms equipped with the insights generated from big data are more able to respond
to unexpected opportunities. The outcome of data exploiting can enhance a firm’s isolating
mechanism to allow it to decrease threats of imitation, thus increasing the maintainability of
an advantage based on the insights generated from big data. This discussion leads to the
following proposition:
Proposition 1:In a big data context, exploiting data facilitates preferential access to a
greater variety of demand-side opportunities, thus increasing the firm’s potential value
creation.
How do some firms create more value from internal data than others? Prior research placed
emphasis on the role of “data scientists” who have the specialized skills and knowledge to
analyse big data (e.g., Davenport and Patil, 2012) in contributing to the firm’s value creation
opportunities from big data. This perspective implies that companies that have more data
20 The findings from our research indicate a different view. Firms that hired many data
scientists do not always generate better value creation opportunities. Rather, it was the
process of data management where managers are able to democratize, contextualize,
experiment, and execute data insights in a timely manner to create value. In the following
sub- sections, we provide a detailed account of our observations to support our emergent
theme (Eisenhardt and Graebner, 2007). We display additional selected quotes in Table 3 to
illustrate and document the robustness of our claims.
[Insert Table 3 about here]
Capability to democratize data
We define data democratization as the firm’s capability to integrate data across the firm and
enable a wider range of employees to access and understand data where it is needed at any
given time. One challenge dealing with big data, often highlighted during our interviews, is
the sheer volume of data itself, as described by many informants as “we can easily drown in
the big data sea”. We found significant variations in the scale where internal employees can
benefit from exacting insights from big data. The quotes shown in Table 3 indicate that data
democratization is associated with better value creation.
The Alpha case illustrates the linkage between data democratization and value creation.
Alpha data director argued “make big data serve everyone (in the company), not just top
management and executives”. In 2009, Alpha introduced data tools to enable a wider scale of
data application. For example, the data team introduced a data product called “Wu Liang
Shen Zhen”, a data visualization tool that monitors the “heartbeat” of hundreds of thousands
of customers. “It is like an electrocardiogram that hospitals use to monitor a patients’ pulse,
if there is any abnormal sign, it draws our attention to it straightway” (Alpha, 017a). This
21 tool enabled the customer service team to closely monitor the transaction activity of millions
of customers based on historical and real time data, in order to detect any abnormal activities.
As the data director described:
“We want everybody to like data and benefit from data. It is not easy as people often think only data experts can navigate and understand these sets of numbers. So, our goal is to turn big data into something that is tangible and easy to understand and use. Such productizing big data requires our team to work with other teams to understand their needs and
customers’ needs to come up with something that can benefit them on a daily basis.” (Alpha, 014a)
Information gathered from other informants, published industry sources and archival data
confirmed that this company was well known for its data democratization capabilities. Data
products such as “Seismograph” that monitors which functions customers complain about the
most, including gaining access to the original customer complaint, and “Time Machine” that
traces the evolutionary journey of customers, were designed from big data to enable a wide
use of data applications. The informants from the same company often expressed a high level
of confidence in the data team, referring to them as the “magic maker”. One informant
explained:
“We do not need to have a PhD in physics or advanced IT skills to understand the data, everything is so straightforward to understand, it makes our job so much easier. They really did a fantastic job here”. (Alpha, 002a)
The Tangu case also indicates the link between the democratization of data and value
creation. For example, in Tangu each department has its own data team. The purpose of the
data team is to “assist everybody in the department to be able to use data” and to “coordinate
with other departments in terms of data integration and data sharing”. Informants often
noted that “without such collaboration between data experts and non-data experts, it would
be impossible to build the bridge between the pure correlations (generated from big data)
22 provided by a senior data engineer at Tangu displays the relationship between the data
democratization and conversion process.
“Big data may sound fancy but big also means slow, cumbersome, and complex. We used to set up the data team as a separate unit, which meant only a handful of people were able to crunch the data. The problem was then that the value of the data has not been used in an efficient manner as only a small group of people were working on it. We wanted to empower every single member of our team with the insights generated from big data.” (Tangu, 003a)
In contrast, there was little mentionfrom firms that generate limited value from big data
concerning the enabling of large scale data applications. What was commented on suggested
that employees’ access to data and their understanding of data was not particularly germane
to the value creation process. For example, one deputy executive was asked to describe the
process of how data was used at the general managerial and operational levels. He answered
that the “business intelligence team analyse the results on a daily basis and present it to the
senior management team, and the management team can select what is relevant and forward
it to the lower level” (Cheu, 001a). Such information distribution was confirmed by other
informants from the same firm. However, one informant commented, “Sometimes we don't
really know the purpose of the document, to us, it’s more like tick boxing exercises” (Cheu,
010a)
The evidence on the linkage between the firm’s capability to democratize data for wider use
of application and value creation is consistent with the converse found at Shrong. For
example, informants described that while other departments put a cap on how many people
they could hire, the data department was given a green light. “The problem is that they hired
so many people”, one informant said, “so far I didn't see much value from it”. At Shrong,
informants often emphasized the technical role of data scientists but there was lack of interest
in encouraging a wider scale of data use. In such firms, the informants indicated that big data
23 Overall, our findings concerning data democratization capability calls into question the
implicit assumption that the analytical skill of individual data scientists is sufficient to
contribute to a firm’s value creation opportunities. Our evidence indicates that the process of
data scientists transmitting relevant knowledge across internal firm boundaries to enable
wider and collective data application is positively associated with better value creation.
Leaders in these firms tend to view data as a public good that can be used and accessed by all
employees. This discussion suggests the following proposition:
Proposition 2: In a big data context, the greater the firm’s capability to democratize data to
enable a wide range of data applications, the greater the likelihood the firm will increase its
potential value creation.
Capability to contextualize data
This capability refers to the firm’s ability to assign meaning as a way of interpreting the data
within which an action is executed. Firms collect a significant amount and different types of
data, including data on customer behaviour, market demand, shifting preferences and
changing customer needs. The firm’s capability to identify the contextual clues to gain a
holistic view of customers will be positively associated with better value creation.
A key insight is that those firms that created more value from big data than others tended to
actively break down the data barriers that existed within the firm. Such data integration
enables firms to gain a “360 degree context” for customers. For example, Alpha have been
working on integrating internal data since 2004, as documented in an in-house memorandum.
The effort was made to integrate data from multiple systems, inviting collaboration among
24 “We have been working on a unified user cookie and log format for about 10 years. We wanted to build a data warehouse so people get a 360-degree picture of our customers. It is all about joining the dots and understanding data within a context” (Alpha, 021a).
The evidence we collected from other informants from the same company and from the
secondary sources confirmed this view. It was emphasized that the real value of big data is
not just the volume of the data itself, rather, it was the connection between “individual
customers” and “their everyday life”. As pointed out by a senior data expert, “It is not just
about what decision he/she made, it’s about what scenario that drives him/her to make that
decision” (Alpha, 005a). Similarly, this view is also shared by Tangu and Bray. Creating a
closed data loop, collecting and analysing customer data from multiple channels and
magnifying the context about individual needs was constantly highlighted during our
interviews. As explained by one informant,
“There are many different types of data, demographic data, historical data, situational data and locational data. By drawing all of these data together, you can have a full context of every customer interaction. Incomplete data often gives you a partial picture about customers. It’s like the story of blind man and an elephant.” (Tangu, 013a)
In contrast, we noted that many frustrations were expressed regarding information hoarding
among business units within firms that created less value from big data. For instance, several
informants from Cheu pointed out that data was stored in diverse lines of business and this
prevented the firm from gaining a holistic view of individual customers. This is illustrated in
the following observation:
“Incomplete data can only tell you part of the story and people here seem to have the mentality to hold the information. It is not a win or lose situation here, it’s not even about competition because when we mix our data together, we both benefit from it. The mentality needs to be changed and infrastructure needs to build to support this internal data
collaboration otherwise everybody is doing their own thing with their incomplete set of data, nobody is doing a good job in this case.” (Cheu, 011a)
In addition to failing to integrate data internally, many informants also noted that the outcome
25 their data report”. A similar view was shared by other informants who described the
information presented in the data report as “too technical” and “not sure where the business
value lies”. One informant pointed out “delivering data and correlation without the context,
it’s rather pointless” (Cheu, 006a). Our evidence also revealed that companies that are less
active in building infrastructure to integrate internal datasets are also less active in engaging
cross- department communication. This is reflected in the following:
“Not everybody can do (data analysis) that's for sure so we leave it for the experts. They dig out what is relevant first then we decide how to use our resources to make it happen or make changes.” (Cheu, 010a)
From firms that have created more value from big data, we noticed that such cross-
department collaboration was a common practice. Data teams frequently communicated with
other departments to co-create value from big data. As one informant lamented:
“Albert Einstein once said ‘If I had only one hour to save the world, I would spend fifty-five minutes defining the problem, and only five minutes finding the solution’. It is very time consuming and pointless to approach data with no question in mind. You have to put data in a context. So we spent a lot of time talking to our colleagues from different departments, what problems do they have? What data is relevant for this problem? Can it be solved by data? If data is available, what data do you need? With a particular context in mind, it is much easier to find a solution from the data.”(Alpha, 005a)
As a result of this patterned collaboration, firms are more likely to understand data in
different contexts, therefore leading to a better understanding of individual customers. This,
in turn, made firms perform better and achieve prominence in creating value from big data.
This suggests that:
Proposition 3: In a big data context, the greater the firm’s capability to encourage
cross-department collaboration to contextualize data, the greater the likelihood the firm will
26 Capability to experiment with data
Data experimentation is the firm’s capability to promote “trial and error”, cultivate an
inquisitive attitude towards data, encourage continuous experimenting with the data and
monitor the changes. Across the sample companies, we found notable variations in the firms’
actions in engaging in activities associated with data experimentation.
A positive example is Tangu, where a senior data analyst commented:
“People sometimes get very passive and just let computers take over. You need to have the balance between the ‘yin’ and ‘yang’. For me, data analytics is the ‘yin’ and you need the ‘yang’ which entails coming up with new things to test the data, to test how the market reacts and fluctuates. There is a lot of hype about the role of data scientists and what they can do. Often they neglect the right side of your brain, the creative side of things.” (Tangu, 020a)
Information from other informants from the same firm also accentuated the importance of
data experimentation in driving the firm’s value creation. A product development manager
described the process of testing data in order to try out different ideas:
“We sometimes try out different designs and features on our products just to see how the data react. With the internet, we can control the scale in which we wish to experiment. It is a process where you try it out, you gather feedback, and you improve, then try it out again on a larger scale, then feedback- and then improve.” (Tangu, 002a)
The findings suggest that a “trial and error” organizational culture, when coupled with a
greater level of data accessibility, tends to have a better chance to transform value from big
data within the firm’s internal network. This combination is reflected in the following
observation from a senior marketing director at Alpha:
27 the data with a clear focus. This is extremely important given the amount of data we have. We also encourage them to try out new ideas in incremental steps to see how the (real-time) data reacts. We had one idea coming from one of our interns whose idea was to produce
personalized video clips from the historical data to capture our customers’ journey from the time they first opened up a shop on our website. The results were very successful.” (Alpha, 001a)
In contrast, informants from other firms put a lot of emphasis on the robustness of the data
itself, where the experimenting element was mentioned rarely. For example, a Shrong
executive expressed a high level of confidence in the firm’s data analysis skills. Informants
from the same company described the top management’s attitude to big data as “let the
numbers do the talking” or “they stick too much to the number itself”. Similar examples can
be found at Cheu, where the informants were asked to describe the role of big data in
assisting their work activities. What was mentioned suggested that the insights generated
from big data played a crucial role in influencing their jobs. “It is a hard-core science,” as
one informant described “you don't want to mess with it”.
Our findings indicate that firms showing a tendency toward cultivating a learning and
experimental culture also tended to have better conversion rates from the data. The findings
suggest that a “trial and error” approach, when coupled with a greater level of data
accessibility, tends to have a better chance to transform value from big data within the firm’s
internal network. This chain of evidence is consistent with the recent emphasis on managerial
capability with the stress on flexibility, creativity and timing rather than efficiency and
control (Amit and Schoemaker, 1993; Teece, 2007; Teece et al. 1997). This discussion
suggests:
Proposition 4: In a big data context, the greater the firm’s capability to cultivate a learning
and experimental culture towards big data, the greater the likelihood the firm will increase
28 Capability to execute data insight
This capability refers to the firm’s ability to transform data insights into actions that lead to
identification of new opportunities that increase the customer’s willingness to use/pay and
thus for creating value. Our analysis found a clear pattern of variation in how firms execute
big data insights. Several informants from Alpha commented that the real value of big data
depended heavily on the speed of the firm’s execution ability. As one informant emphasized:
“We had many discussions around how are we going to react quickly to these data and how we can capture the opportunities emerging from data there and then. The solution is not easy, it requires structural change, process change and also mind-set change. These are the hidden challenges associated with the management of big data. It is a different management where you build a process to enable people to make sense of the data and take actions to respond to the data in a timely manner. You need to catch that moment”. (Alpha, 011a)
Archival data, such as minutes of meetings and internal newsletters, confirmed this view.
Different from the traditional hierarchal decision making process, operational employees
from Alpha have the flexibility and freedom to act based on the data insights. “It is embedded
in our daily routine, act more like a microscope, help us to see things better, clearer and
quicker so we can make timely and right decisions.” (Alpha, 009a) Individual team members
were able to monitor the market trends and customer activities through a data tool based on
historical and real-time data every day. Employees observing any abnormality emerging from
the data were able to react to the situation in real time or could discuss it with the team leader,
after which action was able to be implemented within 24 hours. “It’s not just about strategy
anymore”, claimed one informant, “it's the ability of execution”.
Similarly, the Tangu case also illustrates the linkage between capability to execute data
insights and value creation. For example, one informant from Tangu described the execution
ability to big data as “creating a harmonious relationship with big data, like a dancing
29 “If you are constrained by the authority and hierarchy, then you lose that movement, agility and flow. Things change fast, and you have to catch that moment. It is all about speed. Time in this age is more important than money”. (Tangu, 001a)
Tangu created a decentralized data ownership and empowered employees with data insights
to make timely decisions. In contrast, firms that created less value from big data usually
adopted a centralized data ownership, where only data experts and top executives could
access the data. The decision-making process generally originated from the top, then
cascaded down to the operational employees. For example, a data team would produce a data
report, present it to the top management, this report would be forwarded to middle
management, and then finally filtered to the operational employees. One informant from
Shrong commented: “it takes layer after layer of digestion, once it is your turn to digest and
do something, it always quite late. So sometimes I don't really understand the purpose of the
report. What do they want us to do? Read it?” As a result of this kind of decision-making
process, firms often missed opportunities to grasp the value emerging from real-time data,
which hindered the firm’s ability to create value from big data.
Our findings support the view that decentralized power enhances the pace of decision
making. This is consistent with Brown and Eisenhardt (1997, 2009) who suggest that firms
with simple or few rules that combine improvisation tend to be more flexible to market shifts.
This discussion leads to the following proposition:
Proposition 5: In a big data context, the greater the firm’s capability to build a decentralized
decision-making process to enable agile execution of big data, the greater the likelihood the
firm will increase its potential value creation.
30 This pattern of value creation refers to the process of attracting and integrating separate
external datasets and resources, and managing this open data network to create value. Such
collaborations can result in significantly higher value being co-created in comparison to value
harnessed through the firm’s internal big data. The alliance partners contribute
complementary and supplementary data/capabilities, so together they are a source of value
that individual partners could not build in isolation. All five IPCs emphasised that their
platforms’ internal resources and capacity can only be stretched to a certain extent to meet the
diversified and heterogeneous market demand, particularly in the mobile internet age.
Therefore, new infrastructure capabilities, as well as new resources centred on improving
customer experience, need to be created and built in order to remain competitive in a
fast-changing market.
Several informants highlighted the network externality effect of opening their resources to
third-party developers, resulting in a distinctive resource within their network innovation
systems. For example, a senior director from Tangu commented:
“We tried to do everything ourselves in the past. After we opened up our platform, we noticed that the most popular games were actually coming from outsiders. It is not about the data itself, it is about how to connect your data to with the ‘a-ha’ moment where you can provide better products for your customers based on the data. Data does not generate innovation, people do.” (Tangu, 005a)
In addition to exposing the public APIs that allow third parties free entry to the supply of the
platform, including its database, firms also coalesced datasets from different external sources.
For example, in 2013, Shrong embarked on a collaborative partnership with Alpha, with the
intention of combining two datasets in order to bring unique and valuable services to both
platform users. A senior executive from Shrong commented:
31 noticed that there were so many things that could be done or improved. That is the beauty of data, when you mix and match them, new and different patterns occur.’ (Shrong, 005a)
Another example is the collaboration between Tangu and a local search engine, who agreed
to integrate their respective datasets in order to jointly develop and cross-promote their
products and services. Similarly, Bray pulled data together from various airline companies
and the Civil Aviation Authority of China. This action not only improved airline operation
efficiency but also provided a better experience for customers. A Chinese electrical appliance
manufacturer entered into a collaborative relationship with Alpha with the aim of building
internet products which allow the management of domestic appliances by remote control and
enables communication between devices. A senior director from this electrical appliance
manufacturer noted:
“Our data has different strengths and sheds different lights on our products and customers. We accumulated years of experience and data in delivering electronic products, and they (Alpha) also sat on a huge amount of data regarding market trends, customer preferences and different metrics. Such online and offline integration is the perfect marriage for product innovation (Alpha-partner, 2a).
A similar example is Cheu’s collaboration with offline travel agents and travel relevant
partners, such as Taxi Company, to further discover new opportunities from the collective
dataset where all parties’ resources can be fully maximized. When asked about whether they
would be worried that such offline travel companies would “steal” Cheu’s online business, a
senior manager commented:
32 Similarly, Alpha and a local logistic company engaged in a “joint data crunching” project in
order to improve delivery efficiency. A senior operational director from a logistic company
commented:
“We have so many parcels to deliver and our drivers are under a lot of pressure. We captured and tracked thousands of package movements from telematic sensors and they (Alpha) tracked thousands of transaction activities from their websites. The data pot enabled us to redesign our logistic system. Together, we can predict how many packages will be generated for which province during different periods of the week.” (Alpha-partner, 6a)
The evidence resonates well with the role of external actors in contributing to the firm’s value
creation in conjunction with the firm’s internal R&D by stimulating innovation through a
combination of the efforts of a diverse pool of complementary firms, leading to superior firm
performance (Chesbrough, 2003; Chesbrough and Appleyard, 2007). This open process
enriches the firm’s own database through the synergetic effect from external knowledge
sourcing, which leads to a great increase in innovativeness (Laursen and Salter, 2006). As a
result, the firm is able to create a more compelling competitive position (Chesbrough and
Appleyard, 2007).
It was evident that IPCs and their collaborative partners were able through collaboration to
combine their datasets into “synergistic bundles” to generate economic rent (Madhok and
Tallman, 1998). Our evidence demonstrates that the value of data increases when it is
combined with different sets of data, a process which fundamentally shifts the nature of the
relationship between the firms and their network partners from competitive to collaborative.
Value can be realized in the form of new products and business model innovation, which
ultimately expand the market opportunities for firms and their partners to create and capture
33 Proposition 6: In a big data context, data layering with inter-industry and intra-industry
partners’ data, allows preferential access to a greater variety of opportunities that generate
additional sources of value for customers, thus increasing a firm’s potential value creation.
A key observation is that instead of passively opening their platforms and sharing their data,
all the study’s IPCs acted in the role of supporter/enabler by providing tailored financial,
technical and analytical data support to their partners. The evidence of this support is found
consistently across all cases. Rather than focusing on acquiring more bargaining power with
their partners, the five IPCs all adopted a conciliatory approach by providing free support
first and only extracting a small commission fee when the developers started to obtain profit
from their own operations. A senior director from Bray stated that:
“We are not like the United States, we are very short of talent and our infrastructure conditions are unevenly distributed across different provinces. There are so many people that would like to take advantage of the resources we have, but they simply do not have the data, knowledge or money to do so. You can see most of us (IPCs) acting as a gardener trying to fertilize the ground to make the flowers blossom. You plant the seeds, you fertilize them, and they will grow and then you can make profit from fruits or vegetables from the plant. It is like making a profit from your resources’ interest. They tell us about their ideas and we help them to crunch the data. The stronger they get, the more profitable we are.” (Bray, 002a)
Acting as an incubator, Bray launched Chengdu High-Tech Zone’s ‘Mobile Internet Venture
Building’, aiming to provide a range of services including free office space to start-up
developers based in China’s Western region. As another informant from Bray commented,
“When people have good ideas, we give ideas enough oxygen to make sure they grow” (Bray,
010a). The concept “the stronger they are, the stronger we will become” was repeatedly
emphasized across all the interviews. This idea was communicated clearly across the
platform and its complementors. Bray further launched the “Light App” that is designed to