A Thesis Submitted for the Degree of PhD at the University of Warwick
http://go.warwick.ac.uk/wrap/77699
This thesis is made available online and is protected by original copyright.
Please scroll down to view the document itself.
HPC Systems
by
Nentawe Yusuf Gurumdimma
A thesis submitted to The University of Warwick
in partial fulfilment of the requirements
for admission to the degree of
Doctor of Philosophy
Department of Computer Science
The University of Warwick
The need for computer systems to be reliable has increasingly become important as the dependence on their accurate functioning by users increases. The failure of these systems could very costly in terms of time and money. In as much as system’s designers try to design fault-free systems, it is practically impossible to have such systems as different factors could affect them. In order to achieve system’s reliability, fault tolerance methods are usually deployed; these methods help the system to produce acceptable results even in the presence of faults. Root cause analysis, a dependability method for which the causes of failures are diagnosed for the purpose of correction or prevention of future occurrence is less efficient. It is reactive and would not prevent the first failure from occurring. For this reason, methods with predictive capabilities are preferred; failure prediction methods are employed to predict the potential failures to enable preventive measures to be applied.
Filibus Istifanus G.
I am indebted to many people who have helped me in one way or the other during my studies at University of Warwick. I am honoured to acknowledge them in this thesis.
First and foremost, I am grateful to Dr. Arshad Jhumka, whose meticulous and relentless guide is second to none. Thank you for believing in me and for your supervisory role. I would like to thank Dr. Maria Liakata for providing useful comments and supervisory guide.
I would like to thank some friends and colleagues - Dr. Phillip Taylor, Dr. Bolanle Ola, Wilson Tan, Fatimah Adamu-Fika, Emmanuel Ige, Daniel Onah, Chinedu Nwaigwe, Huanzhou Zhu, Hasliza Sofian and Zhuoer Gu- for your tremendous help and friendship during my studies. I would also like to thank Pastor & Mrs. Ajutalayo and members of RCCG House of Love, Canley, Coventry - you were more than Church members, you were a family; may God enlarge you for His glory. I am grate to Mr. & Mrs. Leo Bawa, Rev. & Mrs. Kefas Tang’an - you made me a part of your families.
I also wish to thank the Texas Advanced Computing Center (TACC) for providing the Ranger logs. My appreciation also goes to PTDF-Nigeria for funding my PhD, the University of Jos-Nigeria for the support you have given me.
Parts of this thesis have been previously published by the author in the following:
[53] N. Gurumdimma, A. Jhumka, M. Liakata, E. Chuah, and J. Browne. To-wards detecting patterns in failure logs of large-scale distributed systems. InParallel & Distributed Processing Symposium Workshops (IPDPSW), 2015 IEEE International. IEEE, 2015 [Chapter 4].
[54] N. Gurumdimma, A. Jhumka, M. Liakata, E. Chuah, and J. Browne. To-wards increasing the error handling time window in large-scale distributed systems using console and resource usage logs. In Proceedings of The 13th IEEE International Symposium on Parallel and Distributed
Process-ing with Applications (IEEE ISPA 2015), Aug 2015 [Chapter 6].
[55] N. Gurumdimma, A. Jhumka, M. Liakata, E. Chuah, and J. Browne. On the impact of redundancy handling in event logs on classification in clus-ter systems. InProceedings of International Conference on Dependability (DEPEND), Aug 2015 [Chapter 4].
In addition, the following works are under review:
IEEE-ToC An Anomaly Detection Based Methodology to Increase the Er-ror Handling Time Window in Large-Scale Distributed Systems. IEEE Transactions on Computers[Chapter 6].
FGCS An Unsupervised Approach To Detecting Patterns in Failure Logs of Large-Scale Distributed Systems. Future Generation Computer Systems (Elsevier)[Chapter 4].
APE Average Percentage Error
BGL Blue Gene/L
CPD Change Point Detection
CuSUM Cumulative Sum
DE Differential Evolution
ECG Events Correlation Graph
FLOPS Floating point Operations Per Second
FN False Negative
FP False Positive
HAC Hierarchical Agglomerative Clustering
HPC High Performance Computing
HMM Hidden Markov Model
ICA Independent Component Analysis
JSD Jenson - Shannon Divergence
KLD Kullback-Leibler Divergence
LD Levenshtein Distance
MDS Meta-Data Server
MIC Maximal Information Coefficient
NN Neural Network
OSS Object Storage Server
PCA Principal Component Analysis
RAS Reliability, Availability, Serviceability
RI Random Indexing
SVM Support Vector Machine
TACC Texas Advanced Computing Center
Abstract ii
Dedication iii
Acknowledgements iv
Declarations v
Sponsorship and Grants vii
Abbreviations viii
List of Figures xvii
List of Tables xviii
1 Introduction 1
1.1 Motivation . . . 1
1.2 Background . . . 2
1.2.1 Faults, Errors and Failure . . . 3
1.2.2 Dependability . . . 4
1.2.3 Fault Tolerance . . . 4
1.3 The Problem . . . 7
1.4 The Approach . . . 7
1.5 Thesis Contributions . . . 8
1.6 Thesis Outline . . . 9
2 Literature Review 11 2.1 Introduction . . . 11
2.2.3 Other Methods . . . 29
2.3 System Recovery . . . 30
2.3.1 Checkpointing . . . 30
2.3.2 Task Migration . . . 34
2.4 Summary . . . 35
3 System Description, Log Events And Fault Models 37 3.1 System Model . . . 37
3.2 Fault Model . . . 38
3.2.1 Categories of Fault Model . . . 38
3.2.2 Ranger and BlueGene/L Fault Models . . . 40
3.3 Production Systems . . . 41
3.3.1 Ranger Supercomputer . . . 42
3.3.2 The BlueGene/L (BGL) Supercomputer . . . 42
3.4 System Data . . . 43
3.4.1 Ranger Event Logs . . . 43
3.4.2 Ranger Resource Usage Data . . . 45
3.4.3 BlueGene/L Events logs . . . 47
3.4.4 Definition of Terms . . . 49
3.5 Summary . . . 50
4 Error Detection Using Clustering 51 4.1 Introduction . . . 51
4.1.1 Log Size and Structure . . . 52
4.1.2 Errors and Failures . . . 52
4.1.3 Event Logs Redundancy . . . 53
4.1.4 Objectives of the Chapter . . . 53
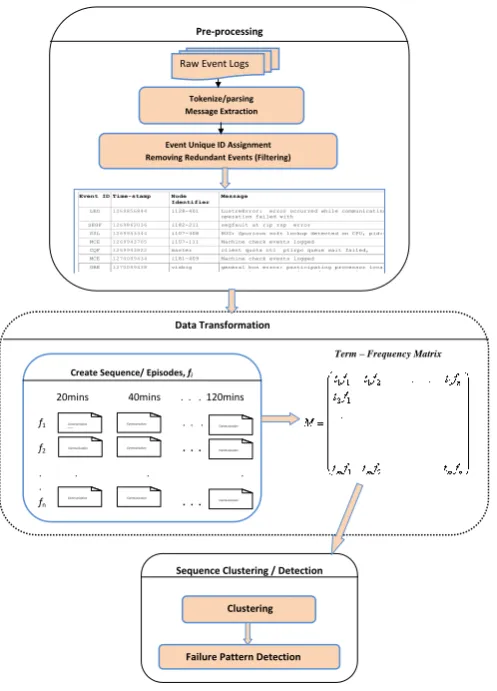
4.2 Problem Statement and Methodology Overview . . . 54
4.4 Data Transformation . . . 63
4.5 Sequence Clustering and Detection . . . 66
4.5.1 Clustering . . . 66
4.5.2 Detection of Failure Patterns . . . 69
4.6 Experiment . . . 72
4.6.1 Experimental Setup . . . 73
4.6.2 Evaluation Metrics . . . 74
4.6.3 Parameter Setting . . . 75
4.7 Results . . . 79
4.7.1 Runtime Analysis . . . 90
4.8 Summary . . . 91
5 Improving Error Detection Using Resource Usage Data and Event Logs 92 5.1 Introduction . . . 92
5.2 Detection Methodology . . . 94
5.2.1 Data Transformation . . . 95
5.2.2 Event Clustering and Feature Extraction . . . 98
5.2.3 Jobs Anomaly Extraction from Resource Usage Data . . . 102
5.2.4 Detection of Failure Patterns . . . 105
5.2.5 Experiment and Results . . . 105
5.3 Detection of Recovery Patterns . . . 112
5.3.1 Introduction . . . 112
5.3.2 Recovery Pattern Detection . . . 113
5.3.3 Results . . . 118
5.4 Improving Failure Pattern Detection . . . 121
5.4.1 PCA and CPD Failure Detection Algorithm . . . 122
6 Early Error Detection for Increasing the Error Handling Time
Window 126
6.1 Introduction . . . 126
6.1.1 Motivation . . . 128
6.1.2 Problem Statement . . . 128
6.1.3 Objectives of the Chapter . . . 129
6.2 Methodology . . . 130
6.2.1 Root Cause Analysis . . . 130
6.2.2 Anomaly Detection . . . 132
6.2.3 Change Point Detection . . . 139
6.2.4 Lead Times . . . 141
6.3 Case Study: Ranger Supercomputer . . . 143
6.3.1 Datasets and Performance Measurement . . . 143
6.3.2 Base Case for Comparison - Error Detection Latency us-ing Clusterus-ing . . . 144
6.3.3 Identifying Anomalies Using our Methodology . . . 146
6.3.4 Propagation Time . . . 148
6.3.5 Other Issues . . . 148
6.4 Summary . . . 149
7 Summary, Conclusion and Future Work 152 7.1 Summary . . . 152
7.1.1 Introductory chapters . . . 152
7.1.2 Error Logs Preprocessing and Pattern Detection . . . 153
7.1.3 Failure Sequence Detection Using Resource Usage Data and Event Logs . . . 154
7.1.4 Increasing the Error Handling Time Window in Large-Scale Distributed Systems . . . 155
7.3.2 Improving the Recovery Run Detection . . . 157 7.3.3 The Error Handling Time . . . 157
1.1 An illustration of the relationship between faults, errors and failures 3 1.2 Dependability tree diagram . . . 5 1.3 Fault Tolerance techniques . . . 6 1.4 An overview of theunsupervised detection approach . . . 8
2.1 A taxonomy of error detection and system recovery methods . . 12
3.1 Permanent, Transient and Intermittent fault model . . . 39 3.2 Sample Log events for Ranger Supercomputer (syslog) . . . 44
4.1 Methodology Work flow showing the steps taken to achieve the objectives . . . 56 4.2 Sample pre-processed logs of Figure 3.2 . . . 61 4.3 Sample preprocessed event logs (syslog) with redundant event
removed . . . 64 4.4 Event logs sequence . . . 64 4.5 Data matrix K ofN sequences, whereFjtiis the number of counts
of message termti in sequenceFj. . . 65
4.6 Evaluation metrics . . . 74 4.7 Cluster goodness based on intra-cluster and inter-cluster
similar-ity (on Syslog, JSD metric) . . . 77 4.8 APE (percentage miss-detection) vs Detection Threshold . . . . 77 4.9 Compression rates given varying LD on syslog . . . 79 4.10 Showing theF-measuredetection of bothour method andnormal
filtering on syslog . . . 80 4.11 Showing theF-measuredetection of bothour method andnormal
4.13 Showing theF-measuredetection on bothfiltered andredundant
logs (syslog) . . . 82 4.14 Showing theF-measuredetection on bothfiltered andredundant
logs (ratlog) . . . 82 4.15 Showing theF-measuredetection on bothfiltered andredundant
logs (BGL) . . . 83 4.16 ThePrecision of our failure pattern detection andXu’s method
onsyslog. . . 85 4.17 TheRecall of our failure pattern detection andXu’s method on
syslog . . . 85 4.18 TheF-measureof our failure pattern detection andXu’smethod
onsyslog data . . . 86 4.19 ThePrecision of our failure pattern detection andXu’s method
onratlog . . . 87 4.20 TheRecall of our failure pattern detection andXu’s method on
ratlog . . . 87 4.21 TheF-measureof our failure pattern detection andXu’smethod
onratlog . . . 88 4.22 ThePrecision of our failure pattern detection andXu’s method
onBGL . . . 89 4.23 TheRecall of our failure pattern detection andXu’s method on
BGL . . . 89 4.24 TheF-measureof our failure pattern detection andXu’smethod
onBGL . . . 90 4.25 The runtime graph of Detection approach . . . 90
5.3 Methodology work flow showing steps taken to achieve detection 96 5.4 Data matrixFtw of a sequence withN nodes andE event types,
whereel
idenotes the number of occurrences of eventelby nodeni. 97
5.5 Jobs outlierness of a sequence using PCA . . . 104 5.6 Evaluation metrics . . . 107 5.7 Results showing accuracy of our detection approach under
vary-ing values of entropy threshold (ϕ) andγ= 0.6. . . 109 5.8 Results showing accuracy of our detection approach under
vary-ing values of varyvary-ing anomaly threshold, withϕ= 0.4. . . 110 5.9 Graph showing detection performance (S-measure) ofour method
andnodeinfo . . . 111 5.10 Graph showing runtime performance ofour method . . . 112 5.11 Sequence of resource usage data . . . 114 5.12 Data matrixM withn subsequences ofS, wherexn,kis the value
of counterkin subsequencen. . . 115 5.13 Graph showing the change point behaviours of both recovery and
failure sequences . . . 117 5.14 Result showing accuracy of detecting recovery sequences among
failure sequences usingCumulative Sum change point detection and varying values of detection threshold,th . . . 120 5.15 Results showing accuracy of detecting recovery sequences among
failure sequences usingKLD change point detection, and varying values of detection threshold,th. . . 121 5.16 Graph showing detection performance (S-measure) of both CPD
methods used . . . 122 5.17 Graph showing detection performance of combining detection
kby jobn. . . 133
6.3 Distribution of jobs outlierness of a sequence using PCA . . . 137
6.4 Distribution of jobs outlierness of a sequence using ICA . . . 137
6.5 Distribution of outlierness/anomaly using MIC . . . 139
6.6 Example showing result of CuSUM CPD on a sequence . . . 141
6.7 Lead Time of Anomalies, Errors and Failures . . . 142
6.8 Processing and analysis of Ranger event logs. . . 145
6.9 Results of clustering algorithms with two different distance metrics.145 6.10 Distribution of outlierness/anomaly of different fault sequence for week 1 . . . 150
3.1 Summary of Logs used from Production Systems . . . 45
3.2 List of 96 Elements of Resource Usage Data . . . 47
3.3 An example of event from Blue Gene/L RAS log . . . 48
4.1 Summary of sequences/patterns obtained from the three produc-tion system’s logs . . . 73
4.2 Experiment Parameter Values . . . 76
4.3 Sample Clustering Result (syslog, HAC) for a cluster with se-quences (seq.1 and seq.2) . . . 78
6.1 Sample Results of Counter correlations (MIC) . . . 143
6.2 Anomaly Detection performance of PCA and ICA. . . 146
6.3 Detection performance for Change Point Detection. . . 147
6.4 Detection performance for Change Point Detection with PCA or ICA. . . 147
Introduction
Since the inception of modern computers, the performance growth has been steady and tremendous. With ever-increasing society’s challenges, applications needing higher computational capabilities increase. This computational need led to the emergence of supercomputers in the 20th century. Since then, the
performance of these systems have been improved to meet the growing need, leading to the era of petascale computing whereby, as at 2015, the fastest su-percomputer can achieve a performance of 33×1015for floating point operation
per second (FLOPS)1.
With the future exascale systems projected to have a performance of up to 1×10¹⁸ FLOPS, the need for these systems to remain fault tolerant becomes increasingly important [43, 76]. This is because people, key sectors or organisa-tions are becoming more dependent on these systems. This is further buttressed by the increasing reliance on these systems by most computationally demanding applications such as used in financial systems, weather forecasting, control sys-tems etc. The increased demand for these syssys-tems has led to continued growth in their capabilities to meet up; this has also led to their increased size and complexities.
1.1
Motivation
Attaining and maintaining a system’s dependability becomes a challenge as these computing systems are not immune to failure, more so, the increasing complexity makes them difficult to manage. The failure of these systems can be costly both in terms of the time and money. This is because it takes a long
time for system administrators to identify and fix the problems. For example, the failure of applications involved in high speed financial trading can be huge. Large-scale systems generate huge volume of “log events“ or system state data. These log events which are sometimes referred to as the health information of the system, are basically the first point of contact whenever there is a failure of the system. However, there is basically no way to know that these systems have encountered faults and could eventually fail by merely observing these system state data or event logs. This is because they are massive and doing so can be overwhelming. Additionally, only few of the events are symptomatic of faults and/or failure [103], that is, a large percentage is redundant. Fortunately, the events could form patterns that characterises failure. In other words, these event patterns preceding a particular failure are the symptoms of such failure.
Root cause analysismethods [118], [23] have been used to find causes of failures from the event logs, however, these methods can only help find the root causes of failure, but cannot prevent it.
In order to make these systems dependable, failure runs must be detected as early as possible to enable taking other proactive failure handling methods or approaches and avoid its consequences. If symptoms of failures can be detected early, failure preventive, avoidance or mitigation measures can be applied. This thesis focuses on detection of error patterns using unsupervised learning ap-proach in large-scale HPC systems.The logs generated by the systems at run time are often indicative of errors; these errors could eventually result in failure if not properly handled by system administrators.
1.2
Background
1.2.1
Faults, Errors and Failure
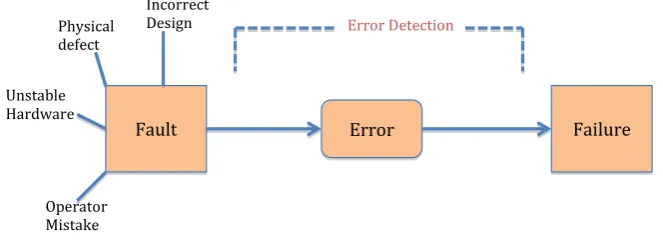
A system generally is made up of interacting components. These components and/or systems are expected to display high level of dependability by delivering the expected service. However, they are usually not immune tofaults and these faults are evident by the errors the system produced which could eventually lead tofailure. These are termed asthreats to dependability [6].
Afailure, according to Avizienis et al. [6] “is an event that occurs when the delivered service deviates from correct service”. That is, a failure occurs when a system transits from correct behaviour to an incorrect implementation of system’s function. The anomalous system’s service may assume different levels of seriousness. An error on the other hand, is a deviation from the correct state given that failure involves one or more system states deviating from the correct state [6]. It is important to note that not all errors would eventually lead to failure. An error is detected by the presence of a loggederror messages
by the system. A faultis the cause of an error. In other words, an error is a manifestation of a system’s fault. When a fault causes an error, it is said to be in an active state otherwise, it isdormant or undetected. Hence, faults are the root causes of failures. Since systems are composed of components, afailure
at the subcomponent level becomes a fault for the component. The concept of faults, errors, failures and their relationships is illustrated in Figure 1.1.
Fault Physical defect Incorrect Design Unstable Hardware Operator Mistake
Error Failure
Error Detection
Fault Tolerance
Error Detection Recovery
Concurrent Detection Pre-emptive Detection Error Handling Fault Handling
[image:22.595.133.465.551.675.2]Availability Dependability Attributes Threats Means Reliability Confidentiality Safety Integrity Maintainability Faults Errors Failures Fault Prevention Fault Tolerance Fault Removal Fault Forecasting
Figure 1.1: An illustration of the relationship between faults, errors and failures
1.2.2
Dependability
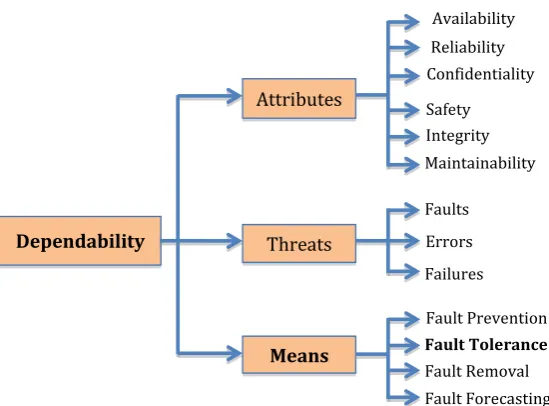
It is expected for systems to be dependable, that is, possessing the ability to avoid service failures that typically occur more frequently with an unacceptable severity level, according to Avizienis et al. [6]. In general, dependability is “a property of a computing system which allows reliance to be justifiably placed on the service it delivers”. A system’s dependability ensures that it is ready to deliver correct service (availability). Such a system must bereliable, that is, the service offered must be correct. Other attributes of a dependable systems includeintegrity, whereby a system is devoid of unacceptable alterations, main-tainability, whereby the system can be modified or updated or repaired; and
safety to ensure no fatal outcomes on users or the system itself.
The dependability schema showing the attributes, threats and means for which dependability of a system can be achieved is seen in Figure 1.2.
Themeansfor which dependability is achieved is as depicted in the schema. These means include:
• Fault preventionwhich involves preventing fault from occurring, especially development faults.
• Fault Tolerance involves avoiding failures in the presence of faults. This is achieve by error detection and system recovery. The work of this thesis is focused on this part.
• Fault Removal involves diagnosis and applying preventive and corrective maintenance.
• Fault Forecasting estimates current and future incidences and their con-sequences.
1.2.3
Fault Tolerance
Fault
Physical defect Incorrect Design Unstable Hardware Operator MistakeError
Failure
Error Detection
Fault
Tolerance
Error Detection
Recovery
Concurrent Detection Pre-emptive Detection Error Handling Fault Handling
[image:24.595.156.431.131.334.2]Availability Dependability Attributes Threats Means Reliability Confidentiality Safety Integrity Maintainability Faults Errors Failures Fault Prevention Fault Tolerance Fault Removal Fault Forecasting
Figure 1.2: Dependability tree diagram
software and hardware fault tolerance became a focus. In distributed systems, it is expected that part of the system may be failing while the remaining part continues to function and outwardly normal. Fault tolerance in distributed systems is aimed at having systems that can automatically recover when part of the system is affected by a failure. The overall performance of the system is also not expected to be affected. In other words, the system is expected to continue its normal operation at an acceptable level even in the presence of failure.
Fault tolerance approaches are aimed at failure avoidance [4, 5]. The pro-cesses involved in achieving this are error detection and system recovery. For clarity, we show the techniques involves in a schema diagram shown in Figure 1.3.
Error handling techniques are aimed at eliminating errors from the system’s state. Such methods include rollback recovery techniques (e.g. checkpointing) and rollforward techniques (where system’s state without errors is used as new state). Fault handling techniques are targeted at preventing future occurrence of failure. Root cause analysis techniques belong to this category.
Error detectionmethods identify the presence of an error in a system. These methods are implemented to detect errors either during the system’s normal
Fault Tolerance
ErrorDetection Recovery
ConcurrentDetection Pre-emptiveDetection ErrorHandling FaultHandling
Rollback Rollforward
Damage Assessment
& confinement Fault Diagnosis
Figure 1.3: Fault Tolerance techniques
operation or when it is suspended. Usually, error detection is performed first before rollback recovery or rollforward techniques are invoked for any recovery process.
As explained earlier,faults are manifested through errors and these errors are logged by systems aserror logs. The errors are pointers to eventual failures, hence, these error events are patterns or signatures of such failures. In this work, error detection is sometimes called failure pattern detection. When an error always lead to a failure, then error detection in this case, is similar to
1.3
The Problem
Large-scale HPC systems produce a significant amount of data (error events and resource utilization data), and these logs contain information about the system’s activities. Whenever a fault occur, errors may become visible and these errors can take a particular pattern depending on the fault [43]. The systems can undergo updates which can change the nature and behaviour of faults and the patterns of error events produced. Similarly, abnormal activities in the system can be experienced due to these faults. The abnormality can be seen in the way the system resources are being used, which is captured in the resource utilization data. If the system administrator does not act upon the errors, an error or some can lead to system failure.
The research questions this thesis seek to answer include: first, can the huge event logs be reduced by filtering redundant ones and still contain useful ones for failure analysis? Secondly, how effective is using event logs and resource utilization/usage data for error detection? And can errors be detected early even when it is not visible yet to enable early prevention of failure?
1.4
The Approach
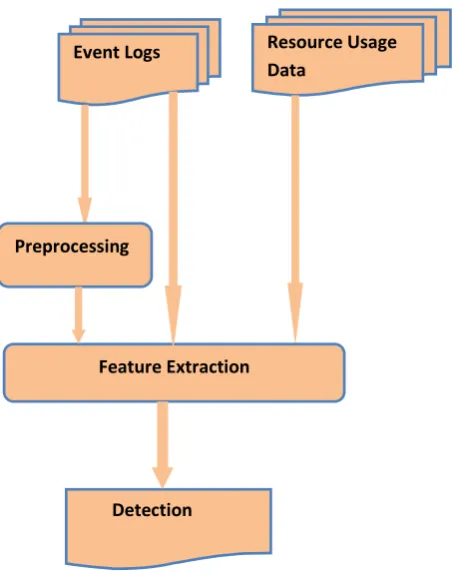
presence of updates and without the need for complete expert knowledge and labelling of the event data. The fact that failures are rare events makes an
unsupervised approach relatively more viable as the problem can be seen as an
anomaly detection. The general overview of the unsupervised approach is de-picted in Figure 1.4. It involves extracting features from sequences of event logs and usage data in order to determine if a sequence is failure inducing or not. In some cases, a preprocessing of the data is required.
Resource Usage Data
Event Logs
Preprocessing
Feature Extraction
[image:27.595.182.412.272.560.2]Detection
Figure 1.4: An overview of theunsupervised detection approach
1.5
Thesis Contributions
from two production systems and the results demonstrated excellent perfor-mance; outperforming established error detection methods in the field of fault tolerance. We make the following specific contributions in this thesis:
• We proposed anovel and generic approach to log filtering that not only filters redundant events, but also preserves events that are not similar but causality-related. This preserves event patterns that can serve as precursors to failures.
• We proposed a novel clustering-based failure pattern detection approach that utilizes the inherent characteristics of faults to detect the presence of errors in computer systems.
• A novel method for error detection based on the combination ofevent logs
andresource utilization data is proposed. This method uses the anomaly in the use of computer resources and the informativeness of event patterns to detect errors in the system.
• We propose an approach for detectingrecovery patterns in system data. These are patterns which characterise errors which do not eventually lead to failure. The approach, which is based on change point detection, identi-fies such patterns based on the consistencies in which resources are utilised.
• A novel method for increasing theerror handling time windowis proposed. This is the time window for which error handling techniques can be applied and it must be large enough for such techniques to complete. Our method increases this time by detecting errors early from minimal error symptoms.
• In this thesis, we provide a taxonomy and a comprehensive survey of fault tolerance techniques.
1.6
Thesis Outline
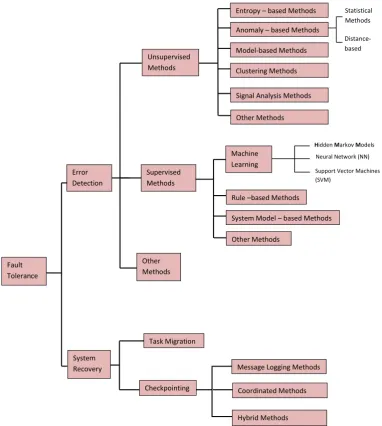
Chapter 2 contains a taxonomy and overview of the current work in the field of dependability in large-scale systems. Particularly, the chapter describes fault tolerant methods with error detection approaches categorised under supervised, unsupervised and other methods. The chapter also reviews system recovery methods.
Chapter 3 briefly describes the system model for which the approaches can be applied. This chapter gives an overview on two supercomputing systems (Ranger and Blue Gene/L) and the data collected from these systems for the experiments performed. It further explains the fault model assumed in this thesis and some basic terminologies related to the use of the data and the approaches used.
Chapter 4 presents a filtering method used to reduce the redundant events in the log data. The chapter further details a clustering approach for detecting error event patterns from these logs that are symptomatic to failure.
Chapter 5 focuses on utilizing both resource utilization data and event logs to detect failure-inducing behaviour in systems. The chapter details the approach which obtains anomalous behaviour in systems from resource utilization data combined with the nodes’ behaviour captured by the event log entropies to detect the error patterns. The chapter explores other methods of improving failure pattern detection for which recovery pattern detection was proposed based on change point detection.
Chapter 6 details the approach for improving the time for which error handling can be performed. This stems from the fact that with future systems projected to have reduced mean times to failure, it is necessary that identification of failure leading errors should be done early enough to enable error handling techniques to complete successfully.
Literature Review
2.1
Introduction
Distance- based Statistical Methods
Hidden Markov Models
Fault Tolerance
Error Detection
System Recovery
Unsupervised Methods
Supervised Methods
Other Methods
Entropy – based Methods
Clustering Methods Model-based Methods Anomaly – based Methods
Signal Analysis Methods
Other Methods
System Model – based Methods Rule –based Methods Machine
Learning
Other Methods
Neural Network (NN) Support Vector Machines (SVM)
Task Migration
Checkpointing
Message Logging Methods
Coordinated Methods
[image:31.595.143.526.135.562.2]Hybrid Methods
Figure 2.1: A taxonomy of error detection and system recovery methods
2.2
Error Detection
is done from known data before testing is performed on unlabelled data. Un-supervised method on the other hand, are methods for which detection is done without any knowledge of previous patterns.
2.2.1
Unsupervised Methods
Detecting error patterns for any proactive failure avoidance measure has received much attention from researchers. Learning such patterns in an unsupervised way has proven to be effective. Generally, these techniques share a common purpose: detecting faults and/or failure inducing errors in systems. These techniques may differ in approaches; we explain the frequently used ones.
Entropy Approach
An entropy-based approach to detecting failure inducing patterns has also been shown to be successful in the domain. It involves capturing the entropy of the system from the event logs. Particularly, several approaches have been developed [106] [94] to detect alerts in logs of large-scale distributed systems.The concept of entropy has also been demonstrated to be useful in detecting changes in the behaviour of distributed systems components [26].
Basically, entropy-based detection methods [106], [93] based its motivation on the premise that in large-scale distributed systems, similar computers cor-rectly executing similar jobs should produce similar logs. That is, they should produce similar content or line tokens. The method leverages the information that each line token carries with respect to the node that produced it. The approach is as follows: Given W as a set of unique terms (tokens) formed by concatenating line tokens with its position in line, C is the total number of nodes, then the matrixM =|W| ×C, with xw,c as the total number of counts
distribution of the terms among nodes, givenGvectors of|M|weights, then,
gw= 1 + 1
log2C C
X
c=1
pw,c log2(pw,c) (2.1)
where pw,c is the number of times term w occurs on nodes c divided by the
number of times it occurs on any other node,
pw,c= xw,c C
P
c=1 xw,c
(2.2)
The next step is to obtain the informativeness of the nodes,Nodeinfo, within
nodehours (all event lines within an hour by a node) and rank them based on how many high information terms are contained in each. Hence, letH be the set of allnodehours, and let Y be the|W| × |H|matrix whereyw,c,j is the number
of times term w occurs in nodehourHc
j, then the Nodeinfo for each nodehour
is given as:
N odeinf o(Hjc) =
v u u t
|W|
X
w=1
(gwlog2(yw,c,j))2 (2.3)
where each nodehour is ranked based on decreasing value of Nodeinfo. Those with high Nodeinfo are considered to have alerts(errors) [106]. This approach was applied on logs of supercomputers with good result.
perfor-mance rather than using every field of an event log. In [53] the authors utilise entropy of events logs and event characteristics to detect failure patterns in logs. One of the advantages of entropy - based methods is that they can be im-plemented easily so long as features can be captured accurately. However, the approach suffers from the following disadvantages:
• Since it depends on obtaining the informativeness of terms of the log events, it can be computationally expensive as the increase in the number of the terms, the higher the size of the features to be considered.
• Its performance is dependent on the nature of logs, that is, it performs poorly on logs where faults are not characterised by presence of high event messages.
• It requires system logs to be decomposed into spatio-temporal partitions; the act of partitioning may not capture the desired events with the required time window or partition, hence decreasing the detection accuracy.
Anomaly-based Approach
The challenge of error detection can also be seen as anomaly detection problem. Anomalous pattern detection assumes the existence of a normal pattern for which an abnormal one can be viewed as a deviation from the former. We discuss some of the approaches widely and recently used under different categories as follows:
individual records are assumed to substantially increase detection. It cal-culates the anomaly score of the subset of the records. The anomalousness is the maximization of anomaly scores over all subsets where those that deviates abnormally from others are likely anomalous. This is achieved by learning a Bayesian network model over the training data where the condi-tional probabilities of each attribute of a record are calculated forming the anomaly scores. This approach was applied on categorical data. Similar approaches can be found in [151]. Most of these techniques assume the knowledge of the underlying data distribution. Even though this method was not used for detection of errors, it can be adopted easily. The logs which are the records can be categorised or other to obtain their anomaly scores.
The frequency or histogram approach is a non-parametric method that constructs a histogram of normal and anomaly data. Particularly, the feature-wise histogram is constructed where by, at the test stage, the prob-ability of each feature is obtained. The anomaly score is then calculated by summing the probability values of each feature, which is calculated as follows:
anomaly score= X
k∈X wk
(1−pk)
|K| (2.4)
where wi is the weight assigned to the feature k, pk is the probability
distribution of featurek andKis the set of features.
This approach is well-applied in fraud detection [35], intrusion detection [148], [149].
canon-ical correlation analysis (CCA) to discover highly correlated subspaces between the sets of variables. The authors further proposed a method calledprincipal canonical correlation analysisto capture the variance be-tween the two features (system inputs and internal measurements). The authors reported good detection based on the deviation observed of inter-nal measurements from the system normal models.
In [149], the authors describe an approach that detects outliers in categor-ical data. The method addresses the problem using a statistcategor-ical learning approach which is an online unsupervised learning process of a proba-bilistic model. The method performs online learning and updating as follows: Whenever a data point input is given to the system, it learns the probabilistic model using an online discounting learning algorithm. The input data point is then scored based on the learnt model; with high score indicating a high chance of it being an outlier. This approach was im-plemented and tested on network intrusion detection data for KDD cup 1999 and the rare event detection for pathology dataset of the Australian Health Insurance Commission. The authors recorded good detection.
2. Distance - based: These methods detects failure patterns based on the dissimilarity and rarity of certain inputs from others. A dissimilarity threshold is defined in this case. We discuss some distance-based anomaly methods as follows.
and perform detection using PCA extracted anomaly vectors from the fea-tures. The approach used on console logs is summarised as follows: Parse logs and source codes to extract useful schema, then create features that capture correlation among events (state ratio vectors and message count features). This is done by combining source codes and message logs where the hidden log schema is extracted. This feature vectors are used as in-puts to the PCA and detection algorithm. In employing PCA for anomaly detection, the feature vectors are labelled as normal or anomalous. The intuition is that, highly correlated feature vectors can be identified and anomalies are assumed to be rare. Therefore, feature vectors that deviate from the correlated pattern are likely to be anomalous. To identify ab-normal vectors, a distance from the uncorrelated subspace to the ab-normal subspace is calculated to determine the abnormality of a vector. That is, a vectorv is projected onto an abnormal space va, the squared distance
is the squared prediction error (SPE) calculated thus:
SP E=||va||2 (2.5)
andva = (1−AAT)v, whereA= [a1, a2, ..., ak] is the kformed principal
components by PCA.
Since it was assumed that the abnormal vectors are distant from the nor-mal subspace, then detection of abnornor-mal vectors is simple: flag v as abnormal ifSP Eis greater than certain defined threshold.
This method was shown to have good detection rate. However, it requires access to source codes of programs, which are not readily available. PCA computation can be costly; hence this might not be suitable for an online detection.
The first step involves transforming the data from multiple data types to a single one to enable detection. Specifically, it involves converting variable-spaced time series to constant-spaced ones, removing noise etc. The result of this step is a feature matrix formed for each of the nodes. The second step deals with feature extraction; where principal component analysis (PCA) and independent component analysis (ICA) are used to extract useful features to be used for detection. Lastly, the abnormally behaving nodes (outliers) are identified using a proposed outlier/anomaly detection algorithm. In order to identify the nodes that are anomalous or significantly dissimilar from others, the authors utilised Euclidean dis-tance. Hence, given two data pointsya ∈ <s andyb ∈ <s, then, distance
is given by:
d(ya, yb) =
v u u t
s
X
i=1
(ya, i−yb, i)2 (2.6)
Therefore, the nodes further away are anomalous. The authors demon-strated that the method is able to detect anomalous nodes with high specificity.
In our method, entropy is extracted as one of the features of event sequence. We combined with resource usage data for which an anomaly score was obtained. Detection is achieved based on features extracted and the anomalousness of the resource usage of the system.
Clustering Methods
In this context, clustering is aimed at grouping similar inputs patterns together. It is believed that those that are likely to be failures are rare, hence detection can be performed, sometimes, in conjunction with other methods.
of events and further show their spatial correlation using stochastic model. Both temporal and spatial correlations are used to model failure propagation in the system. They further developed a clustering algorithm that groups signatures based on the correlations observed. The clusters formed are used to predict future occurrence of failure.
In [119], a clustering-based approach is proposed for detecting abnormal events. They achieved this by first, extracting relevant features and then pro-posed a proximity clustering that groups patterns of events based on the their semantic relatedness. The sparsely clustered features are believed to be anoma-lous or abnormal. This approach was used to detect abnormal events from a surveillance cameras system. It can be adopted and used for detecting failures in logs of large-scale distributed systems. This can be done by creating useful features from the logs that describes correlation among events; then applying clustering to separate normal from abnormal features. Another work that em-ploys clustering for detecting failures in large-scale distributed systems is found in [82]. The work used clustering with gossip-base algorithm to perform this. The clustering groups messages based on location while the gossip-based algo-rithm is aimed at removing uncertainty from massive logged messages and also reduce the detection time. The authors did not elaborate on the performance of the detection approach but demonstrated how it can incorporate existing meth-ods to reduce detection time. Our clustering approach is different; we obtain clusters of similar events to enable extraction of features of patterns particu-larly entropy and mutual information. These features are then used for error detection.
Signal Analysis Methods
characterises event types and detect faults and normal patterns in event logs. The approach extracts and represents the event types as signals where these signals are appropriately characterised and an anomaly detection method is applied to identify anomalous signals. The authors went further to implement this this as online outlier detection. The offline event correlation/analysis is combined with online monitoring and detection of outliers for identification of any deviation from known normal signal patterns for prediction of possible failures. The authors reported good results for predicting failures.
In [102, 105, 107] the authors proposed methods that can address several problems in production systems. Such problems include: abnormal interactions among components and identifying these bad behaviours of systems. The com-ponents behaviour is captured as “surprise”; that is, measuring how anomalous a component is. These anomalies (surprises) are captured as anomaly signals. The anomaly signals are obtained by finding deviations from known models of normal component behaviour. In this method, the degree of anomalousness of each signal is retained rather than discretizing them into either abnormal or normal. In particular, the method represents behaviour of components as sig-nals and computes the anomaly score for each to be able to identify abnormal behaving components. The anomaly score is computed by comparing the his-togram of a recent window of component behaviour with the entire history of behaviours of the components. Kullback Leibler divergence [77] is computed between the probability distributions of the observations. This provides the dis-tance or how each distribution differs from the other. Those with high deviation from the normal are considered anomalous signals.
the using anomaly detection to obtain anomalous signals is indeed a good way to detect faulty components in large-scale systems. The online version of this method is detailed by the authors in [102].
Rule-based Methods
[38] explored a rule-based method of predicting failure events in logs of large-scale systems. They mine correlations in events by leveraging on the unique characteristics of the events. The approach first proposed a new algorithm called Apriori-LIS that mines rules from events representing correlation among them. These rules are then represented using a proposed Events Correlation Graphs (ECGs). The prediction algorithm is built based on the ECGs where the probabilities of failure events are calculated based on correlation seen in the vertices of the ECGs. The authors reported good prediction results when applied on logs of production systems. One major advantage of this approach is its ability to generate rules based on events correlation for effective detection.
Model-based Methods
Cormode [26] introduced an approach that models continuous distributed mon-itoring of streams of data in a distributed computer system. A function for these streams of observation is computed. This method can be used for monitoring usage of compute nodes for detection of abnormal usage patterns of the nodes. These abnormal usage patterns are pointers to failure.
the different machines to compare those performing similar tasks within the same time frame. Anyone that significantly deviates from the others is tagged suspicious. This idea is similar to those presented in [74, 106]. A statistical model is used to capture the behaviours of the machines. The authors imple-mented the detection framework using three test algorithms: the Sign test [30], Tukey test algorithm [133] and the Local Outlier Factor algorithm [12]. The authors reported a good detection of outlier machines.
In [62], models of different hardware component failures is constructed from a 5 years logs collected from a HPC system. The failure models are based on each components usage and capture the correlation between components. The authors demonstrated that these application-centric models are useful in performing other system reliability methods like checkpointing. These models can be utilised easily for performing detection of these failing components.
Log Filtering and Error Detection Methods
Most production systems’ logs do not have that. A general approach is more suitable.
Unlike theirs, this work assumes that temporal events must occur in sequence to be removable and we believe that causality-related but semantically unrelated events are patterns or signatures to failure, therefore, are not filtered.
Gainaru et al. [42] proposed a log filtering approach to enhance failure de-tection. This method clusters similar events that tend to occur massively in sequence. In addition to clustering, Makanju et al. [95] went further to index (IDs) the result of the clustered logs for easier use by any log analysis algorithm. these clusters represents the different event types of the logs. The authors mainly focus on extracting the message types that can be used for indexing, visualiza-tion or model building. One of the caveats of this approach is that it clusters events/message types that are believed to have been produced by the sameprint
statement and their occurrences is non-overlapping. Another approach that use clustering can be found in [70]. By contrast, the method in [55] can cluster non-overlapping events together. In [3], two algorithms for discovering patterns in systems event logs we proposed. The first is the text clustering algorithm which automatically discovers templates generating the messages. The second algorithm discovers patterns of messages in the system. The clustering algo-rithm focuses on creating a dictionary of event types from the text messages with no aim of discovering any faulty pattern, but only different patterns that can be discovered. In [53] the authors went further by discovering and detect-ing patterns that are symptomatic to system failure. The authors group similar patterns through clustering based on the events similarities.
normal.
[114] developed a method that ranks log messages deemed useful to the users. Their approach assumed that most frequently occurring messages are ranked higher using an unsupervised algorithm.
Another approach that ranks logs for failure detection is [129]. Similar to [106], the ranking is based on the location of a text word in a message and similarity in the workload performed by computer nodes where they are assumed to have generated similar log messages. They demonstrated that the method with information entropy of logs produces a very low false positive rate (0.05%) for failure event detection. One of the challenges of this method is that it may not detect failures characterised by presence of few events since it will receive low ranking.
In their approaches,[23] [24] produced a diagnostic toolFDiag, which uses the combination of message template extraction, statistical event correlation and episode construction to identify significant events that led to compute node soft lockup failure in Ranger supercomputer system. Events which are highly correlated with the failure are extracted as episodes.
2.2.2
Supervised Methods
Supervised detection approaches learn the patterns of errors or failure inducing and nonfailure inducing through a supervised training algorithm. After learning from the labelled data, it produces models that can be used to classify, from test data, the patterns identified as failure and non-failure by the model.
Machine Learning
coming to a decision without having to build a target function. We survey papers that use machine learning in the section.
The authors of [99] combined simulation models and machine learning method to perform detection of faults. Unlike other normal machine learning approaches reported in [100], where failure and non-failure patterns are detected, this ap-proach performs classification of more categories of failure. It first, simulate models of the system, then using Neural Network method, it learns different faulty and non- faulty condition from the model signals. This method was validated on inverter-monitor systems and not distributed computer systems. However, this approach, similar to [100], can be adopted for failure detection in the cluster systems. More machine learning methods that were used to detect hard drive failure are detailed in [132]. They modelled the problem as a sequence labelling challenge, where, a Hidden Markov Model (HMM) is used to model these failures as probabilistic models. They extracted 68 features from hard drive data where HMM is trained for each of the supported feature. The time series Self-Monitoring and Reporting Technology (SMART) data is labelled as eitherfailorgood. Yamanishi and Maruyama [148] came up with a different ap-proach to HMM. In their apap-proach, dynamic systems behaviour is represented using a mixture of Hidden Markov Models; these models are learned using an online discounting learning algorithm. Failure pattern detection is done sub-sequently based on anomaly score given to observed patterns. This approach basically utilises the HMM for learning the models.
Bayesian classifier implementation.
Fulp et al. [39] proposed a new spectrum-kernel SVM approach to predict failure events from log files of computer systems. The approach extracts mes-sages in a sub-sequence or sliding window to predict likely failure. The fre-quency observation of the messages in each sub-sequence is used as an input to the SVM. The SVM then classifies the messages as either failure or non-failure. Other methods that combine SVM and other classifiers for detection can be found in [118, 152]. The work in [152] first extracts sets of features that ac-curately captures the characteristics of failures. The authors then investigated four classifiers (rule-based, SVM, Nearest Neighbour and a customised Nearest Neighbour) to detect failures. They reported good results when applied on an IBM BlueGene/L log data, achieving better performance with the customised Nearest Neighbour method.
Fronza et al. [36] presented an approach that predict failure of systems using log files based on random indexing (RI) and Support Vector Machine (SVM). They presented a two-step approach where, firstly, given labelled (failure and non-failure) sequences of logs files representing a change in system state, a fea-ture vector is constructed. These feafea-tures are created using RI. It is a word space model that accumulates vectors based on occurrence of words in context. This approach does not require the data to undergo further dimensional reduc-tion since it forms this vectors incrementally. Secondly, SVM is applied on these data to separate or classify failures and non-failure patterns based on models formed. This approach was validated on an industrial data and the authors reported low performance on true positive rate and high true negative rate.
been done and presented in [51], except that, this method uses the traditional NN. Similar work have been proposed for detecting failure in automotive en-gines [144]. However, the authors were able to verify their technique by simula-tion. Similarly, Selmic and Lewis in [121] presented a neural network approach that identifies and detects fault in nonlinear systems. The approach used how-ever, is a multimodel NN. An NN of the system that emulates the behaviour of system is trained offline based on known nonlinear models. At the simulation part, the neural net is compared to the real non-linear plant for detecting pos-sible failure. The authors did not show detection accuracy but demonstrated how the estimation error converges asymptotically. An approach that combines models of support vector machines and back-propagation neural network is de-tailed in [155]. This method was aimed at improving drive failure detection in large scale storage systems. The models are tested on a real-world dataset and was shown to have high detection accuracy. These methods can be used for detecting failures in computer systems if models of the system failure signatures can be obtained and trained using NN.
Lee et al. [83] presented an approach that captures the contents of fault trees and detect faults using decision trees. A decision tree is built and trained from the sample data containing faulty and non-faulty events. The authors presented the result of such classification as a diagnostic decision tree. This tree helps reveal unknown fault paths also.
Rule-based
and classification with consideration to the time of occurrence of events. This combination enabled the building of robust rule-based models that can be used to detect or identify rare events. The authors reported that the time window affects the performance of this method.
System Model-based
Model-based detection has long received attention [143] [47]. The authors of these papers surveyed works that utilised models to detect and isolate failures in dynamical systems and production plants respectively. A mathematical model of the system and its problems (e.g., memory leaks, sensor biases, equipment deterioration) are detected when there is deviation from the normal system model signatures. [7] developed a Markov Bayesian Network model for predict-ing failures. This method combines causal information and updates the model estimator with new observations.
Vaidyanathan and Trivedi [137] proposed a semi Markov reward model (measurement-based) to estimate the rate of exhaustion of operating system resources. The authors utilised statistical cluster analysis to identify the various network workload states. This is done through clustering of the measurements taken. Next, the authors build a state-space model and then define a reward function based on the rate of resource exhaustion corresponding to each resource. The state reward defines the rate of change of the modelled resources. In order to estimate the rates, a linear function is fitted to the data. This approach estimates the time until resource exhaustion by computing the expected reward rate at steady state from the semi Markov model.
2.2.3
Other Methods
Methods that combine both supervised and unsupervised are highlighted in this section.
unsupervised approaches to detect outliers. The authors perform detection as follows: First, a method [149], an unsupervised online detection of outliers is applied to the data. This method obtain an anomaly score for each data point. A high anomaly score indicates that the data point is likely an outlier and lower scores indicating less possibility of an outlier. The data is then labelled based on the scores with higher scores labelled as “positive” and low scores labelled as “negative”. From these labelled data, a supervised learning method is used to generate outlier detection rules. These rules are generated using stochastic decision list (used as classifier). For the selection of the rules, it utilises the principle of minimising extended complexity. Failure detection is then done using the generated rules on any input data. With the use of system logs, a proper method for extracting patterns that can capture the outlierness of the input sequences can be used, then an anomaly score is assign to each sequence. Finally, a classification algorithm can be used to generate rules to be used for detection.
2.3
System Recovery
The processes involved in achieving fault tolerance include error detection and system recovery. Rollback, rollforward techniques like checkpointing, job mi-gration etc., are applied whenever a fault is detected.
2.3.1
Checkpointing
A checkpoint is an identified area in a program at which fault free system states or status information that would allow restarting of processes at a future time is saved. The process of saving system state and status information is called checkpointing [73]. Periodically, checkpointing process is done and this checkpoint become points of restart whenever a failure noticed [73], [32]. We explain some few checkpointing methods used in distributed systems.
control of I/O node is limited by bandwidth of that I/O node. According to [15, 45], coordinated checkpointing would not scale for future exascale sys-tems because, their design is centred on energy efficiency. Furthermore, El-Sayed and Schroeder [33] provide an extensive study on the energy/performance trade-offs associated with checkpointing and pointed out that periodic checkpointing methods would not scale perfectly in exascale systems [45, 110] and requires further improvement. The best option possible in this case is to save check-points on local nodes. However, the disadvantage of this method is that it can only recover from software faults, since nodes with checkpoints could also fail. Preventive checkpointing methods are promising as they avoid the earlier mentioned challenges. In this methods, prediction is done based on successful detection of non-fatal precursor events. In a sense, early effects of faults must be detected in order for checkpointing to be triggered. Some approaches [21, 29, 57] circumvents checkpointing to provide fault tolerance.
Checkpointing in Distributed Systems: Checkpointing is useful, however, it is also more difficult in distributed systems due to the fact that there is no global clock to bring synchronization to checkpoint streams. The checkpointing methods are discussed under the following:
1. Message Logging Techniques
proposed by [86, 138]
2. Coordinated Checkpointing Techniques
This technique involves the coordination of the processes in order to save their states. The coordination among processes maintains consistent global state of the system. Messages are used to maintain the coordination and this adds to the overhead of the method. Kumar and Hansdah [78] proposed a coordinated checkpointing technique that assumes nodes to be autonomous and do not block during checkpointing. The method can work efficiently with non-FIFO channels for which messages could be lost. In the method, any process can initiate a checkpoint by requesting per-mission from former coordinator. In essence, multiple coordinators are allowed; however, a single checkpoint is permitted at a given time.
in [124] [136] [22]. Most of the methods highlighted in this section are also referred to as preventive checkpointing methods. One of the challenges with this method is that it is difficult to prevent a process from receiving application messages that could make the checkpoints inconsistent. An-other problem is that computation is blocked during the checkpointing thereby causing delay.
3. Hybrid Checkpointing Techniques
These techniques are a combination of two or more other checkpointing techniques. The approaches are mostly improvements on the other tech-niques or aimed at providing better checkpointing results.
Bouguerra et al. [11] proposed a method that utilises the relationship be-tween failure prediction and proactive checkpointing in combination with periodic checkpointing to reduce the effects of failure in the execution time of parallel applications. The rationale behind this is that the use of proac-tive checkpointing only is not sufficient enough to ensure a re-start of an application from the scratch. However, a combination of these methods can mitigate the effects and improves systems efficiency. In the approach, a prototyped state-of-the-art failure prediction, fast proactive checkpoint-ing and periodic checkpointcheckpoint-ing methods are developed. Furthermore, the computing efficiency of the combined methods is captured using a mathe-matical model to obtain the optimal checkpointing interval. The method is evaluated by simulating the methods on large-scale supercomputer. Their result demonstrated that computing efficiency could be improved by as much as 30% using this method and mean time between failures (MTBF) is improved by a factor of two.
com-pression (where only the difference between current and previous file is written) combined with Markov model to predict points at which con-current checkpointing can be done. Their method is reported to reduce applications turnaround time by about 40% when compare with static periodic checkpointing.
2.3.2
Task Migration
In this, a task is migrated to another node that is immediately available [11] when node failure is predicted to occur. Task migration eliminates cost associ-ated with task restart in the face of node failure.
the migration was assessed. The result shows that the overhead of live migra-tion depends on the applicamigra-tion and is higher than the execumigra-tion time of normal rollback approach. Other similar approaches are seen in [111], [108].
In order to realise reduced system response time, Gupta et al. [52] proposed a method that adaptively schedules jobs and manages the resources based on external input. The jobs can be migrated to more processors and can also be shrunk based on the runtime conditions. Even though the approach focused on shrinking or expanding scheduler triggered jobs, it can be adopted to move jobs to safe nodes in the event of failure.
Munk et al. [98] recently proposed a concept that enable task-level migra-tion in real time system many-core systems. It checks the viability of migrating a certain task at runtime. The migration is then performed on resources in-vestigated to be available only. They performed migration through a 3-step procedure. The first is the decision phase, where, similar to [142], temperature monitoring and task runtimes profiling information is performed to decide if migration is necessary. In the case where it is necessary, a migration request is generated with set of possible destinations. The second is the investigation stage where the migration request is assessed. The possible destinations are evaluated for memory availability to store the task, determine if the task can be completed and when the migration task can best be performed. The third stage is the execution. It is triggered at the decision stage where the task on both the source and destination are activated.
The paper’s idea is good, however, it lacks the empirical demonstration of the viability of the method.
2.4
Summary
present in this thesis is the first to exploit the use of event logs combine with resource usage data for the task of error detection using an unsupervised ap-proach.
Contributions of this chapter: The contributions of this chapter are the provision of comprehensive survey of error detection and system recovery techniques. To the best of our knowledge, it proposes the first taxonomy of the methods in the field of fault tolerance.
Most of the techniques discussed in this survey utilise systems data like error logs for performing detection. In the next chapter, we introduce the system and the data we use in this thesis.
System Description, Log Events And Fault Models
In this chapter, we detail the system model (Section 3.1) and the fault models (Section 3.2). We also explain the production systems (Section 3.3.2) we used and from which data is collected and we detail the structure of the log file data (Section 3.4). A summary of the chapter is presented in Section 3.5 including the chapter’s contributions and relationship to other chapters.
3.1
System Model
A cluster system contains a set of interconnected nodes. These nodes run jobs that are allocated to them by a job scheduler. A node contains a set of produc-tion times during which scheduled jobs are executed. The cluster system also contains a set of software components (e.g. parallel file system) to support job execution. All the components involved writes log entries to a container. This is a typical model for most cluster systems like Cray, IBM Blue Gene/L, Ranger etc.
Specifically, we consider a cluster systemCS to consist of the following set of entities: a set of K jobs, J1. . . JK, a set of L nodes, N1. . . NL, a set of M production time-bins T1. . . TM, a job scheduler J S and a set of software
components C. The job scheduler J S allocates nodes (and communication paths among the nodes as required) and production times to each job. Each node in the cluster system maintains (monotonically increases) its own clock, and synchronization between the clocks of the nodes is assumed. Each job
Ji : 1≤i≤K, nodeNj : 1≤j ≤L, job scheduler J S and any other software
component may write messages to containers U1. . . Un. Each node Nj and
cluster system to be a black-box, i.e., access to software code is not permitted. However, we assume that access to the message logs which contain the failure events (written in containersU1. . . Un by the jobs, nodes, job scheduler and any
software component) is permitted.
3.2
Fault Model
We detail the fault models proposed as it relates to the systems investigated in this thesis.
3.2.1
Categories of Fault Model
In order to enhance and maintain system dependability, experts have been able to identify certain activities that could occur in a computer system and could potentially lead to failure. These identified activities are categorized to further assist in enhancing a system’s fault tolerance. We explain some fault model categories and their relations to error detection.
Design-Runtime Fault Model
This model classifies faults based on their origin. Faults that emanate as a result of poor system design are regarded as design faults. Runtime faults on the other hand occur during systems production stage. These faults do not foster fault tolerance [6]. At the design stage, fault tolerance techniques are used to minimise or eliminate (if possible) these flaws using some engineering methods like system testing, formal specification etc. In situation where flaw-free system could not be achieved, runtime faults are inevitable. Error detection can detect such error patterns produced leading to the failure.
Permanent-Transient-Intermittent Fault Model
This model classification focuses on the duration of the faults. Permanent faults
mostly damages to computer hardware. Transient faults occur temporarily and disappear. This fault may not occur again; an example may be a communication between node A and node B where a response to a request is not yet available at that time, but upon a resend of the request, it might be available. Intermittent faultsare defects that occur due to system error and then disappear temporarily and could appear again. For example, when there is a loose connection in a system. This fault model is depicted in Figure 3.1, this structure is according to Siewiorek and Swarz [123] and elaborated in [115]. It can represent both hardware and software faults. For example, a software runtime fault can be a result of a wrong design. In relation to error detection, all these faults produces failure symptoms (error events); these event patterns or mis-behaviour can be detected to further enhance failure prediction or other failure analyses.
Physical Defect
Wrong System Design
Unstable Condition
Accident
Error Permanent
Fault
Service Failure Intermittent Fault
Transient Fault Loose
[image:58.595.147.452.380.623.2]Hardware Connection
Hardware-Software-Human Fault Model
This model classifies faults based on the design and the operation of faults. In particular, the faults caused by hardware malfunction are calledhardware faults, similarly, application-related faults are classified assoftware faults. Those that are the results of human activity are classified as human faults. Generally, all these faults like others explained before, produces error events or patterns that can depict such system misbehaviour. Error detection, which is a fault tolerance technique, can be applied to identify these patterns early enough to enable further proactive measures. In the case where error events are not produced, a fault may go undetected until a full failure is experienced since there would be no error patterns or signature for such failure.
Other Fault Models
Other fault models have been proposed; for example, the one by Gray and Reuter [48]. It is a model that focuses on software faults only. It classifies bugs based on how they are observed. Barborak et al. [8] characterises faults based on their behaviour or impact. He showed that some fault becomes difficult to detect at certain states, e.g. states where processing elements ceases to work.