warwick.ac.uk/lib-publications
A Thesis Submitted for the Degree of PhD at the University of Warwick
Permanent WRAP URL:
http://wrap.warwick.ac.uk/80057
Copyright and reuse:
This thesis is made available online and is protected by original copyright.
Please scroll down to view the document itself.
Please refer to the repository record for this item for information to help you to cite it.
Our policy information is available from the repository home page.
T
HESIS FOR EXAMINATION FOR THE DEGREE OFD
OCTOR OFP
HILOSOPHYA study of the interaction
of end-binding proteins
with microtubules
By:
Ben FITTON
Supervised by: Dr. Anne STRAUBE
University of Warwick, MOAC-DTC
Contents
Chapter 1 Introduction . . . 1
1.1 Microtubules . . . 1
1.1.1 Overview . . . 1
1.1.2 Basic Microtubule Structure . . . 2
1.1.3 Microtubule Dynamics . . . 6
1.1.4 The GTP cap and tubulin conformational changes . . . 9
1.2 Microtubule Associated Proteins . . . 13
1.2.1 Overview . . . 13
1.2.2 EB Family . . . 16
1.3 Thesis Motivation and Outline . . . 20
Chapter 2 Materials and Methods . . . 22
2.1 Materials . . . 22
2.2 EB Protein Cloning, Expression and Purification . . . 22
2.3 Purification of Tubulin from Porcine Brain . . . 25
2.3.1 Phosophocellulose Column Preparation . . . 27
2.4 Sodium Dodecyl Sulfate - Polyacrylamide Gel Electrophoresis (SDS-PAGE) . . . 28
2.5 TIRF Chamber Preparation . . . 29
2.5.1 Microtubule Seeds . . . 29
2.5.2 Glass Coverslip Treatment . . . 30
2.5.3 In Vitro Assay Assembly . . . 30
2.5.4 Imaging . . . 31
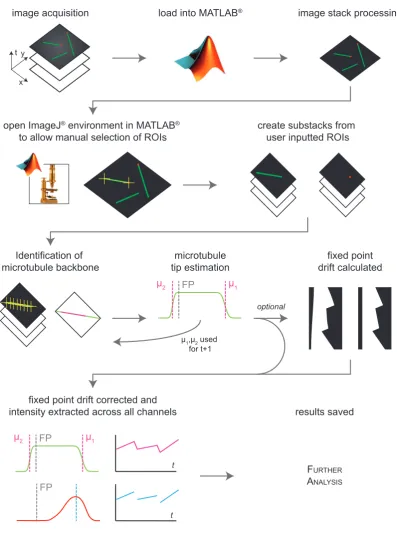
2.6 Image Analysis . . . 31
Chapter 3 Microtubule tip structure in the presence of EB proteins . . . . 33
3.2 Background to Code Development . . . 35
3.3 Identification of Labelled Microtubules . . . 38
3.3.1 Finding Image Files . . . 39
3.3.2 Interpretation and Image Processing . . . 40
3.3.3 Manual Selection . . . 42
3.4 Automatic Identification of the microtubule . . . 46
3.4.1 Gaussian Error Function . . . 46
3.4.2 Locating the Microtubule Backbone . . . 50
3.4.3 Microtubule Drift Correction . . . 53
3.4.4 Intensity extraction and background normalisation . . . 54
3.5 Generation of Synthetic Images of Microtubules . . . 56
3.6 Analysis of Synthetic Images of Microtubules . . . 61
3.6.1 Errors associated with Synthetic Microtubule Image Generation . . . 61
3.6.2 How best to fit the Gaussian Error Function . . . 64
3.6.3 How label density affects fitting of the Gaussian Error function . . . . 71
3.6.4 How the signal to noise ratio affects the fitting of the Gaussian Error Function . . . 75
3.7 Dynamic Microtubules . . . 79
3.7.1 Analysis of Labelled Dynamic Microtubules . . . 79
3.7.2 Analysis of Labelled Dynamic Microtubules in the presence of EB3 . 85 3.8 Discussion . . . 89
Chapter 4 Mammalian EB’s bind to distinct sites on the microtubule lattice in vitro . . . 93
4.1 Introduction . . . 93
4.2 Purification of EB1, EB2 and EB3 . . . 94
4.3 EB1, EB2 and EB3 have the same comet shape . . . 95
4.3.1 Comet Shape Analysis . . . 99
4.3.2 Comet Shape Results . . . 102
4.4 EB Position at the MT tip in relation to each other . . . 104
4.4.1 Dual Comet Analysis . . . 106
4.5 EB localisation relative to the microtubule tip . . . 113
4.5.1 EB localisation Analysis . . . 115
4.5.2 EB localisation Results . . . 116
4.6 Discussion . . . 121
Chapter 5 EB2 is a non-canonical mammalian EB Protein . . . 123
5.1 Introduction . . . 123
5.2 Mixed nucleotide lattice binding for EB1, EB2, EB3 . . . 124
5.3 Binding of EB1, EB2, EB3 to Mixed Nucleotide Lattices . . . 130
5.4 Investigation of Shortened and Chimeric Proteins of EB2 and EB3 . . . . 135
5.5 Discussion . . . 143
References . . . 149
Appendix A Straube Lab Unpublished Results . . . 158
A.1 Affect of EB proteins on microtubule growth parameters . . . 160
A.2 Differences between EB protein binding profiles in the cellular environment 161 A.3 Affinity of EB proteins to different nucleotide substrates . . . 163
List of Figures
1.1 Basic Microtubule Structure . . . 3
1.2 Overview of MT Dynamics . . . 8
1.3 2D Model as proposed by Gardner et al. . . 11
1.4 EB Structure . . . 17
2.1 EB1 pET22b vector . . . 23
3.1 Schema Overview of Microtubule End Fitting Code . . . 37
3.2 Manual Section of Microtubules for Analysis . . . 43
3.3 How the parameters differ between single and dual Gaussian error functions . . . 47
3.4 Overview of the process of fitting to the microtubule backbone . . . 51
3.5 Extracting Intensity across multiple channels . . . 55
3.6 Generation of synthetic images of microtubules . . . 57
3.7 Fitting to an ”unconvolved” microtubule . . . 62
3.8 Dual v Single GEF Fit without image noise . . . 65
3.9 2-step v 1-step GEF fit with image noise . . . 68
3.10 Effect of label percentage on accuracy when fitting the Gaussian error function . . . 72
3.11 Effect of SNR on accuracy when fitting the Gaussian error function . . . 76
3.12 Tubulin concentration has no effect on microtubule tip structure . . . 80
3.13 Comparison of the effect of tubulin concentration on microtubule tip structure . . . 81
3.14 EB3 induces a change in microtubule tip structure . . . 86
3.15 Comparison of the effect of EB3 on microtubule tip structure . . . 87
4.2 AKTA Profiles of Purification Process . . . 97
4.3 Kymographs of EB123-GFP and mCherry . . . 98
4.4 Comet Shape Analysis . . . 100
4.5 EB Comet Shape Parameters . . . 103
4.6 EB Comet Shape Profiles . . . 105
4.7 Dual Comet Analysis . . . 107
4.8 Super-Averaged Intensity profiles of pairwise EB competition experiments 108 4.9 Histograms of the pairwise differences between EB profiles . . . 110
4.10 EB peak to MT tip distance calculation . . . 114
4.11 EB peak to MT tip distance measured parameters . . . 117
4.12 EB peak to MT tip distance calculation results . . . 119
5.1 Nucleotide Decay Model . . . 125
5.2 First order GTP hydrolysis simulation . . . 127
5.3 Distributions of paired nucleotides . . . 129
5.4 EB2 prefers a mixed nucleotide lattice: . . . 131
5.5 Model of EB binding profiles when binding to different mixed lattice fractions . . . 134
5.6 Schematic showing all the GFP variants of the EB proteins; full-length, shortened and chimeric forms . . . 136
5.7 Gels of the purified shortened and chimeric forms of the EB proteins . . 138
5.8 Kymographs of the purified shortened and chimeric forms of the EB proteins . . . 140
5.9 Results of the purified shortened and chimeric forms of the EB proteins 142 A.1 EB1, EB2 and EB3 localise sequentially to the microtubule end . . . 162
A.2 Affinity of EB proteins to different nucleotide lattices examples . . . 164
List of Tables
3.1 2-step v 1-step GEF Fit . . . 70
3.2 Microtubule to Background Intensity ratio and Label Percentage Statistics 74
3.3 Instantaneous velocity statistics for dynamic microtubules . . . 83
3.4 Summary of published results . . . 90
4.1 Summary of the pairwise EB competition experiments: . . . 112
4.2 Summary of the two experiments looking at the distance between binding
sites for EB1, EB2 and EB3 . . . 121
5.1 Full statistics of the purified shortened and chimeric forms of the EB
proteins . . . 143
List of Abbreviations
+TIP a microtubule plus end tracking protein
CH EB protein calponin homology domain
CLASP1 Cytoplasmic linker associated protein 1
CLASP1 Cytoplasmic linker associated protein 2
CV Column Volume
DD EB protein dimerisation domain
E-site Exchangable nucleotide site on theβ-tubulin
EB Member of the End Binding protein family
EB1 End Binding Protein 1
EB1∆T EB1(1-139)-GCN4-GFP-His
EB2∆N EB2(43-326)-GFP-His
EB2∆T EB2(1-179)-GCN4-GFP-His
EB3∆T EB3(1-137)-GCN4-GFP-His
EB2 End Binding Protein 2
EB3 End Binding Protein 3
EB223 EB2-EB3 Chimera, EB2(1-185)-EB3(144-281)-GFP-6xHis
EB232 EB2-EB3 Chimera,
EB2(1-90)-EB3(49-143)-EB2(186-326)-GFP-6xHis
EB233 EB2-EB3 Chimera, EB2(1-90)-EB3(49-281)-GFP-6xHis
EB322 EB2-EB3 Chimera, EB3(1-48)-EB2(91-326)-GFP-6xHis
EB323 EB2-EB3 Chimera,
EB3(1-48)-EB2(91-185)-EB3(144-281)-GFP-6xHis
EB332 EB2-EB3 Chimera, EB3(1-143)-EB2(186-326)-GFP-6xHis
GEF Gaussian Error Function
GFP Green Fluorescent Protein
GMP-CPP Extremely slowly hydrolysing analogue of GTP
GTP Guanosine Tri-Phosphate
GTP-γS Non-hydrolysable analogue of GTP
MAP Microtubule Associated Proteins
MT Microtubule
MTOC Microtubule Organising Center
N-site Non-exchangable nucleotide site on theα-tubulin
OD Optical Density
PBS Phosphate Buffer Saline
PSF Point Spread Function
SAXS Small angle x-ray scattering
SNR Signal to Noise Ratio
STD Standard Deviation
Acknowledgement
First and foremost I must thank my supervisor Dr. Anne Straube for her guidance, support
and wisdom throughout my PhD. I am thankful for her patience through troubled times and
for my numerous mistakes, and occasional moments of stupidity. I thank her for turning
me from a mathematician with an interest in biology, to an interdisciplinary scientist
with a background in mathematics and knowledge of bio-chemistry, image analysis and
programming. I extend my thanks to my second supervisor, Dr. Nasir Rajpoot through
the early years for his frank advice and critique in an unfamiliar research area. I thank
Dr Stefan Grosskinsky for agreeing to take over from Nasir during his secondment in
Qatar.
I’d like to thank my Advisory Committee; Dr. Nick Carter, Dr. Sara Kalvala, and Dr.
Magnus Richardson for their time and guidance.
I would like to thank all past and present members of the Straube lab that I have met
throughout my PhD. Especially Daniel Roth and Ulrike Thiesen. Daniel for his quiet calm,
helpful observations and our invaluable conversation on the state of european football.
Ulrike for her love of coffee breaks and cake that gave a half hour of tranquility to every
day, and her advice in surviving a PhD.
I would like to thank the cake club for providing that weekly sugar dose to power through
the numerous late nights. For allowing me to experiment in a completely different field
and humour at my liquid cheesecake failures (to name one). I would like to thank the
early morning coffee club for that relaxed start to the morning (when I wasn’t purifying
I would like to thank the member of my cohort in MOAC for providing an outlet away from
the lab with a similar background and drive. For our random conversations, our MSc year
of little sleep, for napkin head, and for our away days. I have some fond memories and
hope that we will continue to see each other on a regular basis. Special thanks must go
to Steve for his patience in sharing a house with me for 18 months.
I thank Jess for her patience, and support through the most difficult times of my PhD.
Without her this document may not exist, and for that she will have my eternal thanks and
gratitude.
Special thanks must go to my parents without whom I would not be here. For the
knowledge that they support me without understanding what it is that I have been doing for
Declarations
This thesis is submitted to the University of Warwick in support of my application for the
degree of Doctor of Philosophy. It has been composed by myself and has not been
submitted in any previous application for any degree. The work presented (including data
generated and data analysis) was carried out by the author except in the cases outlined
below:
Tubulin purification was a lab effort (Ben Fitton, Daniel Roth, Ulrike Thiesen, Nida
Siddiqui, and Anne Straube).
Imaging of the EB comet shape and the mixed nucleotide lattice experiments were
conducted by Anne Straube.
Dynamic microtubule chambers for: EB comet shape; EB position at the microtubule tip
in relation to each other; EB localisation relative to the microtubule tip; mixed nucleotide
lattice; and the EB shortened and chimeric construct experiments were created by Daniel
Roth.
Immunoblotting of endogenous EB concentrations in cells, and negative binding effect of
Abstract
Dynamic microtubules control cell shape, cell locomotion and the proper segregation of chromosomes. End Binding (EB) proteins are the key components of the microtubule (MT) plus tip (+TIP) protein network. EBs bind to the MT plus end and regulate microtubule dynamics. EBs localise to the microtubule tip by recognising the nucleotide state of tubulin. Mammalian cells express three members of the EB family (EB1, EB2 and EB3) that localise to spatial distinct sites on the microtubule in cells. Perturbation experiments in cells and in vitro reconstitution experiments have shown that EB1 and EB3 accelerate MT assembly and increase catastrophe frequency. This is a paradoxical effect, as an increase in growth speed should increase the size of the GTP cap thus decreasing the probability of catastrophe. To study this paradoxical effect an image analysis routine was developed to gain insight into any structural re-arrangement at the microtubule tip. An algorithm was developed to extract fluorescence intensity data along the length of a microtubule from time-lapse images. Curve fitting to these data allowed determination of the MT end position with sub-pixel resolution, the measurement of taper (i.e. the length difference of protofilaments at the microtubule end) and the quantitative analysis of the comet-shaped distributions of EB proteins at microtubule ends. The method was verified using synthetic images of MTs and then applied to time lapse movies of dynamic MTs from in vitro experiments where either the tubulin concentration or the EB3 concentration was varied. It was discovered that EB3 may increase microtubule taper, thereby de-stabilising the microtubule tip structure.
Binding of the three EB proteins to spatial distinct sites at the MT tip was carefully re-investigated in-vitro by pair-wise comparison, and in relation to the MT tip. All three EB proteins were found to localise to distinct sites with EB3 found to bind closest to the MT tip and EB2 being the furthest from the MT tip. Based on structural data that became available during the course of the project, and additional evidence of different nucleotide preferences between EB1/EB3 and EB2, a dual nucleotide recognition model was conceived to explain these spatially distinct locations. The model assumes that an EB protein is sensitive to the nucleotide state at both E-sites close to its binding site at the interface of 4 tubulin dimers. All three EB proteins showed evidence of dual nucleotide recognition in mixed nucleotide lattice experiments designed to directly test the model.
Chapter 1
Introduction
The cytoskeleton is a highly specialised dynamic network of protein filaments that is an
important component of all cells (Kaverina and Straube, 2011). Its ability to restructure
itself to the requirements of the cell is vital for many processes such as cell division,
intracellular transport, cell growth and cell motility (Komarova et al., 2002). In eukaryotic
cells, the cytoskeleton consists of three macro-molecular protein assemblies: actin,
intermediate filaments and microtubules (MTs) (Huber et al., 2015). This thesis focuses
on microtubules and how proteins of the mammalian end binding family bind to and
control properties of dynamic microtubules.
1.1
Microtubules
1.1.1 Overview
Microtubules are hollow dynamic protein filaments with a diameter of∼25 nm (Mandelkow
et al., 1991). Within cells one end of the microtubule is usually anchored in the
microtubule organising centre (MTOC), the opposite end is dynamic (Mimori-Kiyosue
et al., 2005; Vicente and Wordeman, 2015). Ordinarily the MTOC is the centrosome,
which is located adjacent to the nucleus (Vicente and Wordeman, 2015). Microtubules
1.1. MICROTUBULES
have important roles in many cellular processes (Komarova et al., 2002; Vicente and
Wordeman, 2015; Lak ¨amper and Meyh ¨ofer, 2006; Straube et al., 2003): Microtubules
give the cell rigidity and provide the network for intracellular transport (Bachmann and
Straube, 2015). They ensure that organelles are properly arranged and maintain a cell
tail providing persistence during cell motility (Theisen et al., 2012). During mitosis, the
MTOC is duplicated and separated by the formation of the mitotic spindle (Vicente and
Wordeman, 2015). The microtubule cytoskeleton connects each pair of chromosomes to
both MTOCs and provides the force required to separate the chromosomes (Vicente and
Wordeman, 2015; Bancroft et al., 2015). Microtubules are the major structural component
of cilia/flagella (Renaud et al., 1968; Lak ¨amper and Meyh ¨ofer, 2006; Stepanova et al.,
2003). Together with microtubule motors they provide the force for swimming in some
single cell eukaryotes, or for moving extracellular material in multicellular organisms
(Lak ¨amper and Meyh ¨ofer, 2006). Within axons, microtubules provide the structure and
stability allowing stable connections to be formed between neurons (Stepanova et al.,
2003).
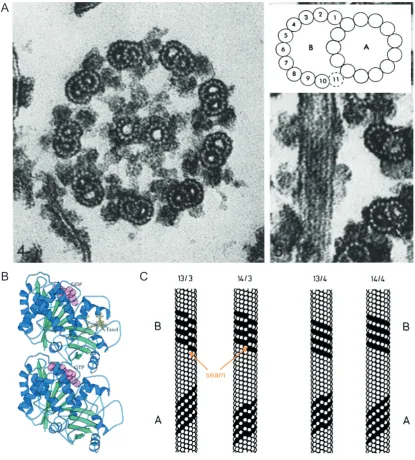
1.1.2 Basic Microtubule Structure
Microtubules (MTs) were first clearly identified in electron microscopy (EM) images in the
early 1950’s (Fawcett and Porter, 1954; Manton and Clarke, 1952). Microtubules were
observed as long, thin filaments in flagella (Fawcett and Porter, 1954). It wasn’t until
1963 that EM techniques had advanced enough through the addition of glutaraldehyde
to the EM fixation media that these filaments were observed to be hollow (Ledbetter and
Porter, 1963; Sabatini et al., 1963). This coined the term “microtubules”, to represent
that they were very small (micro) tubes (tubules) (Ledbetter and Porter, 1963). A year
later Ledbetter and Porter (1964) observed that the walls of microtubules in plants were
formed of long filaments. Subsequent experiments from different groups confirmed that
microtubules in most cell types were formed of thirteen equally spaced parallel filaments
that associated along their length, Figure 1.1 A (Phillips, 1966; Tilney et al., 1973). These
same experiments also demonstrated that doublet microtubules (those found in cilia and
1.1. MICROTUBULES
A
B
C
[image:18.595.104.520.75.536.2]seam
1.1. MICROTUBULES
part of a microtubule bound to the side of a full microtubule such that a second tube is
formed, Figure 1.1 A (Tilney et al., 1973; Fawcett and Porter, 1954).
Meanwhile, experiments into colchicine (an anti-inflammatory drug used in the treatment
of gout) had identified a specific interaction with a protein within cells (Borisy and Taylor,
1967b,a; Shelanski and Taylor, 1967). Borisy and Taylor (1967b) further hypothesised
that the interacting protein was a subunit of microtubules. This hypothesis was due
to; (i) colchicine having a higher binding affinity to cells rich with microtubules and,
(ii) its disruptive effect on mitosis (Borisy and Taylor, 1967b,a; Shelanski and Taylor,
1967). Further experimentation identified the compound as having a molecular weight
of around 110 kDa, which could be further decomposed to two molecules, each with a
molecular weight of 55 kDa (Renaud et al., 1968). This decomposition was determined
to be composed of two similar but different proteins (Adelman et al., 1968; Mohri, 1968;
Shelanski and Taylor, 1967). These similar but different proteins were named asα-tubulin
andβ-tubulin (Adelman et al., 1968; Mohri, 1968). The two proteins were found to exist
in a one-to-one ratio (Bryan and Wilson, 1971). This led to the conclusion that a tubulin
dimer was likely a heterodimer ofα-tubulin andβ-tubulin (Bryan and Wilson, 1971).
The first structural models combining the knowledge of heterodimers of tubulin and
protofilaments were proposed in the early 1970’s (Bryan and Wilson, 1971; Weisenberg,
1972; Tilney et al., 1973; Chasey, 1972; Erickson, 1974; Amos and Klug, 1974). It
was established thatα-tubulin andβ-tubulin were globular proteins with roughly a 4 nm
diameter, Figure 1.1 B (Chasey, 1972; Erickson, 1974; Amos and Klug, 1974). The
tubulin heterodimer associates head to tail to form a protofilament (Tilney et al., 1973;
Amos and Klug, 1974; Erickson, 1974). Protofilaments associate laterally with a small
longitudinal offset between adjacent tubulin dimers (Amos and Klug, 1974; Erickson,
1974). The offset between adjacent protofilaments meant that following a ring of laterally
associating tubulin subunits around the microtubule, the subunit rose by 12 nm for every
complete rotation of the microtubule. The 12 nm increase in height, or three tubulin
subunit increase is referred to as a three-start helix (Amos and Klug, 1974; Erickson,
1974). The offset between adjacent protofilaments is consistent with the protofilament to
1.1. MICROTUBULES
outside of the microtubule. This arrangement is known as a left-handed twist or helix,
Figure 1.1 C.
It was not until roughly 10 years later that the arrangement ofα and β tubulin subunits
were resolved within the lattice. The lateral association of two subunits could be identical
with the α-tubulin subunit interacting with another α tubulin subunit (β-tubulin laterally
associating with a β-tubulin). Alternatively the two interacting subunits could alternate
with α-tubulin associating with β tubulin, Figure 1.1 C. The lateral interaction of two
identical subunits creates a B-lattice, whilst the lateral interaction of alternative tubulin
subunits creates an A-lattice, Figure 1.1 C (Schultheiss and Mandelkow, 1983; des
Georges et al., 2008). Various different combinations of the number of protofilaments,
helix starts, and subunit associations were considered (Schultheiss and Mandelkow,
1983). Experimental evidence, as discussed above, alludes to a thirteen protofilament,
three start helix microtubule. Experimental evidence also appeared to suggest that
the majority of microtubules were formed of B-lattice microtubules, (Schultheiss and
Mandelkow, 1983; Chr ´etien et al., 1995; Nogales et al., 1998). A thirteen protofilament,
3 start helix, B-lattice microtubules must contain an A-lattice join. The A-lattice join, or
seam, was considered to be a weak point within the microtubule lattice and has been the
subject of much discussion, Figure 1.1 C (Katsuki et al., 2014; des Georges et al., 2008;
Chr ´etien et al., 1995; Schultheiss and Mandelkow, 1983; VanBuren et al., 2002). A lot of
the disparity came from microtubulesin vitrobeing observed with 10 -16 protofilaments,
however in cells microtubules are heavily regulated and in mammals always form 13
protofilaments microtubules (des Georges et al., 2008; Chr ´etien et al., 1995, 1992).
Meanwhile biochemical experiments had shown that guanosine-5’-triphosphate (GTP)
associated with a 1:1 relationship with α-tubulin and β-tubulin (Carlier and Pantaloni,
1981; Weisenberg et al., 1976). Upon incorporation into the microtubule lattice the
GTP bound to the β-tubulin underwent hydrolysis to guanosine-5’-diphosphate (GDP),
releasing a phosphate ion (Pi), Figure 1.1 B (Carlier and Pantaloni, 1981). The GTP
binding site on theβ-tubulin is referred to as the exchangeable site (E-site) as the bound
GTP is able to exchange in solution, and undergo hydrolysis when the tubulin heterodimer
is incorporated into the microtubule lattice, Figure 1.1 B (Carlier and Pantaloni, 1981;
1.1. MICROTUBULES
between the α-tubulin and β-tubulin within the stable tubulin heterodimer, and the GTP
molecule is therefore not able to undergo exchange (Melki et al., 1989; Nogales et al.,
1998). Tubulin heterodimers associate head-to-tail, with theβ-tubulin subunit from one
tubulin heterodimer binding to the α-tubulin subunit from another tubulin heterodimer
(Kerssemakers et al., 2006; Chr ´etien et al., 1995; Tran et al., 1997). This head-to-tail
binding of the tubulin subunits gives both the protofilaments and the microtubule an
intrinsic polarity. Within cells theα-tubulin end of the microtubule is usually capped by
γ tubulin whilst the β-tubulin end is exposed within the cell body (Caplow and Shanks,
1996; VanBuren et al., 2002).
1.1.3 Microtubule Dynamics
Early biochemical experiments found that in order to re-polymerise microtubules in vitro
from brain homogenate a number of conditions were essential (Weisenberg, 1972).
Firstly, that the solution had to be warmed; that GTP had to be present; that there
needed to be free Magnesium ions in solution; that there needed to be a Calcium
chelator; and finally that there was a minimum homogenate concentration below which
microtubules would not form (Weisenberg, 1972). It was not until the mid 1980’s
that dynamic microtubules were observed by live darkfield and differential interference
contrast microscopy for the first time (Horio and Hotani, 1986; Walker et al., 1988).
The live microscopy images showed populations of microtubules that were growing
and shrinking (Walker et al., 1988; Horio and Hotani, 1986). Single microtubules
were observed switching stochastically between a growth state and a shrinkage state
(Horio and Hotani, 1986). Either end of a microtubule is capable of both growth and
shrinkage (Horio and Hotani, 1986; Walker et al., 1988, 1991). However the two ends
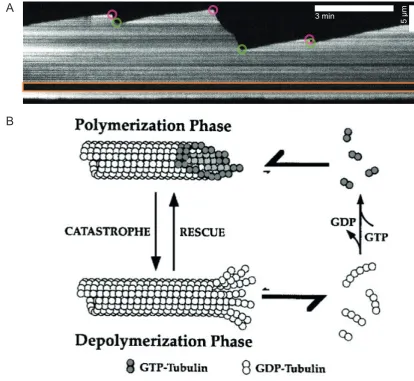
of the microtubule exhibit very different dynamic properties, Figure 1.2 A. One end of
the microtubule (the plus-end) grows more rapidly, and switches between growth and
shrinkage more rapidly than the opposite end (the minus-end) (Horio and Hotani, 1986;
Walker et al., 1988). The microtubule plus-end has theβ-tubulin subunit exposed whilst
the minus end as the α tubulin subunit exposed (Nogales et al., 1998; Caplow and
Shanks, 1996). The change in the end of a microtubule from a growth state to a shrinkage
1.1. MICROTUBULES
was termed a rescue (Walker et al., 1988; Gardner et al., 2011). The stochastic switching
of the microtubule from a growth state to a shrinkage state is known as dynamic instability
(Mitchison and Kirschner, 1984; Walker et al., 1988; Horio and Hotani, 1986).
Walker et al. (1988) undertook the first comprehensive study into dynamic instability
of microtubules in vitro, studying the dynamics of both the plus-end and the minus-end
whilst varying the concentration of tubulin. Walker et al. (1988) found that there was
a critical concentration required for the microtubule to start to grow (nucleate) from a
seed, and that the critical concentration was similar for both ends of the microtubule.
The rate of growth of the microtubule was proportional to the tubulin concentration and
that the association constant at the plus-end was twice that of the minus end. Both the
plus-end and the minus-end shrank at roughly the same rate, which was independent
of the tubulin concentration. The frequency of catastrophe was inversely proportional to
the tubulin concentration, and the frequency of catastrophe at the plus-end was greater
than the rate of catastrophe at the minus end. Conversely the frequency of rescue of the
microtubule was proportional to the tubulin concentration, and the frequency of rescue
was greater at the minus-end.
The explanation for microtubule dynamic instability comes from the observation that a
tubulin dimer binds GTP (Carlier and Pantaloni, 1981). Upon incorporation into the
microtubule the bound GTP undergoes hydrolysis after a short time lag (Carlier and
Pantaloni, 1981). One GTP molecule is hydrolysed for each tubulin dimer incorporated
into the microtubule (Carlier and Pantaloni, 1981; Weisenberg et al., 1976). Dynamic
instability is explained by GTP-tubulin heterodimers stochastically associating and
dissociating from the microtubule tip, Figure 1.2 B (Carlier and Pantaloni, 1981; Walker
et al., 1988; Mitchison and Kirschner, 1984). An increase in tubulin concentration
increases the tubulin association rate, which causes a greater possibility of there being
more GTP-tubulin incorporated at the tip of the microtubule (Walker et al., 1988, 1991;
Hyman et al., 1992). With a constant rate of hydrolysis of the incorporated GTP-tubulin to
GDP-tubulin, the amount of the GTP-tubulin incorporated at the microtubule tip (GTP cap)
is greater (Walker et al., 1991; Tran et al., 1997). A larger GTP cap reduces the possibility
of the GDP-tubulin lattice being revealed due to the stochastic loss of GTP-tubulin from
1.1. MICROTUBULES
5
ȝ
m
3 min
A
[image:23.595.99.514.75.456.2]B
1.1. MICROTUBULES
be lost and the GDP-tubulin lattice being revealed, the microtubule would undergo sudden
shrinkage, Figure 1.2 B (Schek et al., 2007; Gardner et al., 2013; Walker et al., 1988).
If during shrinkage the GTP cap is somehow regained the microtubule switches from
shrinkage to growth (Schek et al., 2007; Gardner et al., 2013; Walker et al., 1988).
1.1.4 The GTP cap and tubulin conformational changes
The GTP cap is the stabilising structure preventing a microtubule from undergoing
catastrophe (VanBuren et al., 2002; Hyman et al., 1992; Gardner et al., 2013). The
size of the GTP cap required to stabilise the microtubule has been reported to be as
little as a single layer of GTP (Caplow and Shanks, 1996). When a GTP-tubulin dimer is
incorporated into the microtubule, hydrolysis cannot happen immediately as the E-site
is left exposed at the plus-end of the microtubule (Caplow and Shanks, 1998). For
hydrolysis to occur a composite α-tubulin β-tubulin bond was required (Caplow and
Shanks, 1996). When a new protofilament capping tubulin dimer binds it was the
previous capping GTP-tubulin dimer of the same protofilament that can now undergo
hydrolysis. It is the α-tubulin of the new protofilament capping tubulin dimer that is the
GTPase. The GTP-tubulin hydrolyses into the intermediary compound GDP+Pi-tubulin.
The GDP+Pi-tubulin dimer undergoes phosphate release to form GDP-tubulin (Melki
et al., 1990). Both of these reactions, nucleotide hydrolysis and phosphate release are
thought to occur with first order kinetics (Carlier et al., 1989; Tran et al., 1997). Until
recently it was thought that a conformation difference between GTP-tubulin (straight) and
GDP-tubulin (kinked) causes the different stability (VanBuren et al., 2002; Nogales et al.,
1998). Loss of the GTP cap would expose the GDP-tubulin lattice, which naturally prefers
a curved orientation causing sudden shrinkage as protofilaments peel away from the
microtubule (Mandelkow et al., 1991; Chr ´etien et al., 1995). However, it has now been
shown that both GDP-tubulin and GTP-tubulin have a curved orientation when free in
solution (Nawrotek et al., 2011; Rice et al., 2008). Upon hydrolysis and phosphate release
different conformational changes were reported to occur within the microtubule lattice
using cryo-EM techniques. (Alushin et al., 2014; Yajima et al., 2012). Yajima et al. (2012)
compare guanosine-5’-(α,β)-methyleno-triphosphate (GMP-CPP), a slowly hydrolysable
1.1. MICROTUBULES
microtubule catastrophe). They discovered that GMP-CPP microtubules have two lateral
interactions between adjacent β-tubulins whilst the taxol stabilised GDP microtubules
only had a single lateral interactions between two adjacent β-tubulins. The reduction
in the number of lateral interactions would increase the chance of loss of GDP-tubulin
dimers. Alushin et al. (2014) compared GMPCPP-microtubules to GDP-microtubules
and suggested that upon GTP hydrolysis the longitudinal-longitudinal interactions (the
bond between two tubulin dimers in the same protofilament) become compacted. This
compaction is thought to generate strain in the microtubule lattice that is released when
the GTP cap is lost causing the microtubule to undergo catastrophe.
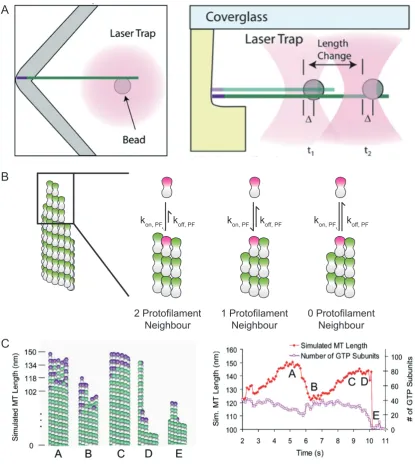
In-vitro imaging experiments on dynamic microtubules show that GTP-tubulin and
GMP-CPP-tubulin dissociates from the growing microtubule plus end (Schek et al., 2007;
Gardner et al., 2011). Dissociation was first shown at the plus-end via experiments
using optical tweezers, Figure 1.3 A (Schek et al., 2007). Optical tweezers work by
holding a bead in the centre of a focused beam. In this case the bead was attached
to a GMP-CPP stabilised microtubule seed. Microtubules nucleated from the stabilised
seed were positioned using the bead so that the plus end grew into a specially fabricated
barrier, Figure 1.3 A. By moving the laser beam such that the displacement of the bead
within the laser beam is kept constant, the force applied to the microtubule in contact
with the fabricated barrier is kept constant. The correction of the laser beam to keep
the force on the bead constant is the growth occurring at the microtubule tip, Figure
1.3 A. Under these experimental conditions it was discovered that microtubules regularly
shrunk by 40 nm (5 tubulin layers) without catastrophe occurring (shortening excursion)
(Schek et al., 2007; Gardner et al., 2011). A similar result was also obtained using
fluorescent tubulin in total internal reflection fluorescence (TIRF) microscopy. Images of
labelled microtubules were analysed using a novel routine that fitted a Gaussian Error
Function (GEF, based on the cumulative distribution function of the standard normal
distribution) along the lattice of the microtubule (Demchouk et al., 2011; Gardner et al.,
2011). This increased the accuracy of measurements (15 nm error at the microtubule tip),
compared to using kymographs, from TIRF microscopy of microtubule length. Additionally
1.1. MICROTUBULES
kon, PF koff, PF kon, PF koff, PF kon, PF koff, PF
2 Protofilament Neighbour
1 Protofilament Neighbour
0 Protofilament Neighbour
A
B
[image:26.595.104.520.73.542.2]C
Figure 1.3:2D Model as proposed by Gardner et al. (2011)(A) Left: Top view and Right: side view of a schematic of the laser tweezers experiment. The bead dark pink circle is attached to the minus of a MT. The growing end is position into the corner of the prefabricated chamber. Under growth the MT forces the bead away from the corner, and by keeping the distance,∆
1.1. MICROTUBULES
Microtubule taper is defined as the distance between the longest (leading) protofilament
and the shortest (lagging) protofilament (Demchouk et al., 2011).
As microtubules were measured losing several layers of tubulin when grown in the
presence of either GTP or GMP-CPP, this removed the possibility that these shortening
excursions were mini catastrophes and rescues. Shortening excursions being observed
using TIRF microscopy excludes the possibility that these shortening excursions were
due to force being applied to the microtubule tip. Gardner et al. (2011) also showed
that with increasing tubulin concentration, the magnitude and the proportion of large
( 32nm) shortening excursions also increased. Gardner et al. (2011) concluded that
this increase in shortening excursions was due to the tubulin subunit dissociation rate
being proportional to the tubulin concentration. This is inconsistent with the 1-D model
of microtubule dynamics proposed by Walker et al. (1988) and presented above, where
the dissociation constant is independent of the free tubulin concentration. To explain
the relationship between tubulin dissociation rate and tubulin concentration, Gardner
et al. (2011) considered the 2-dimensional geometries of different bindings sites at the
microtubule tip, Figure 1.3 B. A tubulin dimer arriving at the microtubule tip could bind to
the longest protofilament. In this scenario there is no neighbouring tubulin dimer for the
arriving tubulin dimer to form a lateral bond with so a single longitudinal bond is formed. If
an arriving tubulin dimer were to bind to a shorter protofilament then one of two scenarios
is possible. Firstly, one of the neighbouring protofilaments might be longer, and one
shorter. In this scenario the arriving tubulin dimer would form one lateral bond and one
longitudinal bond. Secondly, both neighbouring protofilaments are longer. In this scenario
the arriving tubulin dimer would form two lateral bonds and one longitudinal bond. The
probability of dissociation depends on the number of binds, while the association rate
is assumed to be the same in all three configurations. This scenario was modelled
computationally to study the distribution of zero, one and two lateral neighbours as
a function of tubulin concentration/growth rate (Gardner et al., 2011). The simulation
showed that the distribution of binding sites was dependent on the growth rate. The
percentage of zero neighbour binding sites was the same in all cases. However, as
1.2. MICROTUBULE ASSOCIATED PROTEINS
the number of two neighbour binding sites decreased. This indicates that the dissociation
rate of tubulin dimers during growth is dependent on tubulin concentration/growth speed.
It also shows that the shape of the microtubule tip is affected by tubulin concentration. At
low tubulin concentrations there are more two neighbour binding sites implying that the
deviation between the lengths of protofilaments within a microtubule is less. Microtubules
that have little or no difference between the leading and lagging protofilament (taper∼0)
are called blunt microtubules. As tubulin concentration increases there is an increase in
the number of one neighbour binding sites, so the taper of the microtubule increases.
High tubulin concentration therefore has two effects, an increase in growth speed giving
a larger GTP cap, and a microtubule with longer taper. This allows the magnitude of
shortening excursions to be greater at higher tubulin concentrations; more layers of
GTP-tubulin can be lost from the leading protofilaments without revealing the GDP lattice,
causing a catastrophe. The finding that the dissociation rate is dependent on the tubulin
concentration led to the estimated association rate of tubulin during growth phases being
increased 10-fold (Gardner et al., 2011). This model of microtubule dynamics proposed
by Gardner et al. (2011) is referred to as the 2D model.
1.2
Microtubule Associated Proteins
1.2.1 Overview
Within cells, a large number of proteins are known to associate with microtubules (MAPs)
(Kumar and Wittmann, 2012; Jiang et al., 2012; Vicente and Wordeman, 2015). Many of
these proteins are essential in controlling microtubule dynamics, or enabling microtubules
to carry out a cellular function. These proteins can broadly be combined into one of three
groups based upon binding location or function (Kumar and Wittmann, 2012; Jiang et al.,
2012; Vicente and Wordeman, 2015; Wasteneys, 2002). The three groups are the motor
proteins, the structural MAPs and the tip trackers.
The microtubule associating “motor” proteins are a MAP group made up of two protein
1.2. MICROTUBULE ASSOCIATED PROTEINS
group is named as the proteins use adenosine triphosphate (ATP) as an energy source
to “walk” along microtubules (Lak ¨amper and Meyh ¨ofer, 2006). The kinesin family can be
sub-divided into a number of sub-families, named Kinesin-1, Kinesin-2 etc. (Bachmann
and Straube, 2015). The majority of kinesin are plus-end directed motors (they walk
towards the plus end), however the Kinesin-14 family has been shown to be a minus-end
directed motor (Theisen et al., 2012; Bancroft et al., 2015). Dynein is a complex
protein composed of various subunits and is a minus-end directed motor (Carter et al.,
2016). Kinesin and Dynein are involved in intracellular transport, transporting cargo
throughout the cell (Carter et al., 2016; Bachmann and Straube, 2015; Lak ¨amper and
Meyh ¨ofer, 2006). By forming tetramers some kinesin can cross-link microtubules forming
anti-parallel microtubule arrays such as those found in the mitotic spindle (Bancroft
et al., 2015). As mitosis progresses the kinesin walk towards the microtubule plus-ends
forcing the chromosomes further apart (Bancroft et al., 2015). Some kinesin can bundle
microtubules, either by forming a tetramer, or by having a second microtubule-binding
site in the kinesin tail (Straube et al., 2006). Additionally kinesin are part of the
kinetochore-binding complex and ensure that the kinetochore remains attached to the
microtubule from metaphase to anaphase (Vicente and Wordeman, 2015). Axonemal
dynein links microtubules in flagella and generates the forces to bend them (Venier
et al., 1994; Carter et al., 2016). As well as being involved in many cellular processes
some kinesins have been shown to have an effect on microtubule dynamics (Bachmann
and Straube, 2015; Montenegro Gouveia et al., 2010). The best-known microtubule
depolymeriser is the kinesin MCAK, a member of the Kinesin-13 family, which increases
the catastrophe rate of microtubules (Montenegro Gouveia et al., 2010).
The structural MAPs associate to either the inside or the surface of the microtubule
(Orpinell et al., 2010; Bechstedt and Brouhard, 2012). These MAPs bind to the
microtubule and have a role in either stabilising/destabilising the microtubule or ensuring
correct formation of the microtubule Wasteneys (2002); Bechstedt and Brouhard (2012).
Doublecortin ensures the correct formation of the microtubule by preferentially recognises
microtubule with 13 protofilaments and by binding stabilises the microtubule Bechstedt
and Brouhard (2012). Other proteins such as Katanin destabilise the microtubule Srayko
1.2. MICROTUBULE ASSOCIATED PROTEINS
proteins that are thought to bind to the inside of the microtubule such as Tau, a MAP
associated with stabilising microtubules in neuronal cells, and Tubulin Acetyl-Transferase
(TAT) which can acetylateαtubulin Noetzel et al. (2005); Qiang et al. (2006); Orpinell et al.
(2010); Soppina et al. (2012); Kar et al. (2003). The acetylation is not thought to have a
stabilisation effect, but to increase microtubule stiffness (Soppina et al., 2012).
The last group of MAPs associate to the microtubule tip Kumar and Wittmann (2012);
Mimori-Kiyosue et al. (2005); Buey et al. (2012); Slep and Vale (2007). The majority
of these proteins associate with the microtubule plus-end and are known as +TIPs
Kumar and Wittmann (2012). However, there are some proteins, which are known to
selectively bind to the microtubule minus-end (Hendershott and Vale, 2014; Akhmanova
and Steinmetz, 2015). The best known of these are γ-tubulin, calmodulin-regulated
spectrin-associated proteins (CAMSAPs) and Patronin which are all thought to stabilise
the minus end of the microtubule (Hendershott and Vale, 2014; Akhmanova and
Steinmetz, 2015). Whilst many proteins are included in the +TIP network, there
are only a few families that have been shown to autonomously track the plus-end.
XMAP215/chTOG/Stu2p is a TOG (Tumour Overexpressed Gene) domain protein that
binds to the very tip of the microtubule (Slep and Vale, 2007; Zanic et al., 2013).
XMAP215 is a catalyst and increases both growth speed and shrinkage speed (Zanic
et al., 2013). It is formed of six TOG domains (van der Vaart et al., 2012; Slep and Vale,
2007). TOG domains are capable of binding tubulin heterodimers in solution (Nakamura
et al., 2012; Ayaz et al., 2014). Cytoplasmic linker-associated proteins (CLASPs) bind
both to the microtubule tip and to the microtubule lattice via a TOG domain (Grimaldi et al.,
2014). In mammalian cells they rely on EB1 (see below) to localise to the microtubule
plus-ends (Mimori-Kiyosue et al., 2005; Akhmanova and Steinmetz, 2015). CLASPs have
been shown to promote rescues and are capable of binding tubulin hetero-dimers in
solution (Ayaz et al., 2014; Mimori-Kiyosue et al., 2005). The key component of the +TIP
network however is the End Binding (EB) family Juwana et al. (1999); Straube and Merdes
(2007). They have been implicated in binding to a large range of proteins and are thought
1.2. MICROTUBULE ASSOCIATED PROTEINS
1.2.2 EB Family
The EB family of proteins is highly conserved. In mammalian cells there are three
members (EB1, EB2 and EB3) and they are encoded by the MAPRE genes (Juwana
et al., 1999; Su and Qi, 2001). EB1 is ubiquitously expressed with homologues identified
in all other Eukaryotes (Juwana et al., 1999; Tirnauer et al., 1999; Rehberg and Gr ¨af,
2002; Beinhauer et al., 1997). Most widely studied of the EB1 homologues are Mal3 in
S. pombe, and Bim1 in S. cerevisiae (des Georges et al., 2008; Juwana et al., 1999).
EB2 and EB3 have been shown to be differentially expressed (Goldspink et al., 2013;
Straube and Merdes, 2007; Nakagawa et al., 2000). EB3 is up regulated in differentiating
myoblast cells, and has a role in ensuring capture of the microtubule at the cell cortex
in forming myotubes (Straube and Merdes, 2007). Down regulation of EB2 during
epithelial differentiation has been linked to microtubule bundle formation (Goldspink et al.,
2013).
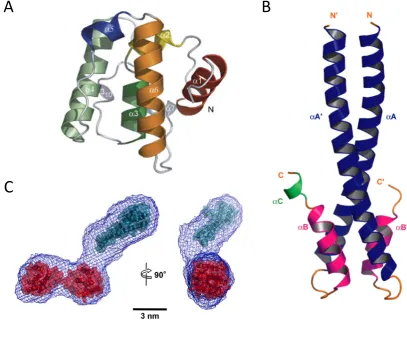
All three mammalian EB proteins are highly similar with a molecular weight of∼35 kDa
and naturally form a stable homo-dimer (Su and Qi, 2001; Sen et al., 2013). They
have a well-conserved calponin-homology (CH) domain near the N-terminus and a
dimerisation-domain (DD) near the C-terminus (De Groot et al., 2010; Hayashi and Ikura,
2003). The structures of the CH and the DD have been solved separately by x-ray
crystallography for EB1 and EB3 (Slep and Vale, 2007; De Groot et al., 2010). The
CH domain is globular is all that is required for binding to MTs (Slep and Vale, 2007;
De Groot et al., 2010; Hayashi and Ikura, 2003; Komarova et al., 2009). The DD is a 4
helix bundle in which there is a pair of two largerαhelices connected to a pair of shorter
αhelices by a short unstructured linker (Honnappa et al., 2005).The DD is followed by a
highly acidic region containing an EEY/F motif (Honnappa et al., 2005). The CH domain
is connected to the DD domain by an unstructured linker (Honnappa et al., 2005). Small
angle x-ray scattering (SAXS) analysis of EB dimers has provided a model to which the
crystal structures of the CH and DD domain have been fitted (Buey et al., 2011). As a
homo-dimer they are thought to be shaped similar to a golf club, Figure 1.4. The two CH
1.2. MICROTUBULE ASSOCIATED PROTEINS
A
B
[image:32.595.103.511.81.420.2]C
Figure 1.4: Cartoon representation of EB Structure(A) Crystal structure of the CH domain of EB1, showing the sixαhelices that comprise the CH domain in differing colours. (B) Crystal Structure of the dimerisation-domain of EB1, made up of four intersectingαhelices, two from each protein. (C) Model of the expected shape of EB dimer from SAXS analysis (blue mesh) mapped onto the known EB calponin-homology domain (red) and dimerisation-domain (cyan) domain structures. (A) taken from Slep and Vale (2007), (B) taken from Slep et al. (2005) (C) taken from Buey et al. (2011)
Due to the similarity between dimerisation-domains, the existence of hetero-dimers has
been investigated and was shown to be possible by the removal of the CH domain
(De Groot et al., 2010). Hetero-dimerisation was shown to exist in vitro between EB1
and EB3 using fluorescence resonance energy transfer (De Groot et al., 2010). However,
with the CH domain intact the EB3 dimer has been shown to be extremely stable over
a large range of conditions (Sen et al., 2013). EB2 is the least similar of the three EB
family members as it contains an N-terminal extension and a less acidic C terminal tail
1.2. MICROTUBULE ASSOCIATED PROTEINS
The C terminus of EB proteins contains two binding domains that allow it to interact with
other proteins (Honnappa et al., 2006, 2005; Weisbrich et al., 2007). The hydrophobic
region of the dimerisation-domain binds to proteins containing an SxIP motif (Jiang
et al., 2012). The proteins that contain an SxIP domain are structurally and functionally
diverse. They include the adenomatous polyposis coli (APC) protein, which has been
shown to stabilise microtubules, through to proteins such as MCAK, a kinesin known to
be a microtubule depolymerase (Montenegro Gouveia et al., 2010; Bjeli´c et al., 2012;
Honnappa et al., 2005). The acidic region containing the EEY/F motif is a target for
proteins containing a CAP-Gly domain (Komarova et al., 2005). CAP-Gly domains
are highly conserved and contain a GKNDG motif that has been shown to be being
responsible for binding to the EEY/F motif (Honnappa et al., 2006). Known +TIPs
with CAP-Gly domains also display a diverse range of functions. Examples include
the cytoplasmic linker protein, CLIP 170, which has been shown in vitro to decrease
catastrophe rate or stimulate rescues. Or the protein p150glued which has been shown
to increase processivity of the dynactin complex (Dixit et al., 2009; Honnappa et al.,
2006).
The microtubule-binding domain of EB proteins is via the N-terminal CH domain. EB
proteins have been shown to bind between protofilaments at the intersection of four
tubulin dimers, close to the E-site of the beta subunits (Sandblad et al., 2006; Maurer
et al., 2012). There is disagreement over whether EB proteins preferentially recognise
the A or B-lattice of the microtubule (des Georges et al., 2008; Sandblad et al., 2006;
Maurer et al., 2012). des Georges et al. (2008) and Sandblad et al. (2006) showed
Mal3 binding to the A-lattice or seam of a B-lattice microtubule. This gave rise to the
idea that EB proteins would bind along the seam (edge of the sheet) and assist in
closing the microtubule into a tube (Vitre et al., 2008). This stabilises the microtubule
and des Georges et al. (2008) showed that a high concentration of Mal3 on S. pombe
tubulin formed full A-lattice microtubules. Maurer et al. (2012) reported Mal3 binding
between B-lattice protofilaments on GTP-γS tubulin microtubules while the seam was left
unoccupied
In the cellular environment both EB1 and EB3 have been shown to autonomously track
1.2. MICROTUBULE ASSOCIATED PROTEINS
2009). Additionally EB1 and EB3 have been shown to promote persistent MT growth
by suppressing catastrophes (Komarova et al., 2009). Whilst no positional difference was
observed between EB1 and EB3 in cells, EB2 does not have such a distinct comet and
its localisation is spread along the microtubule lattice Komarova et al. (2009). No single
published study has yet directly compared the effect of all three EB family members in
vitro. A number of studies have looked at the effect of a single EB protein, nominally
EB1 or one of its homologues Mal3 and Bim1, alongside a binding partner. In vitro
experiments show that EB1 and EB3 autonomously track the growing MT end with the
distinctive EB comet (Komarova et al., 2005; Zanic et al., 2009; Maurer et al., 2014).
Additionally both EB1 (or an EB1 homologue) and EB3 have been shown to increase
growth speed (Komarova et al., 2009; Bieling et al., 2007; Tirnauer et al., 1999), and
increase catastrophe frequency (Maurer et al., 2014; Komarova et al., 2009).
EB proteins are thought to track the growing tip of microtubules by recognising the
nucleotide state of tubulin (Zanic et al., 2009; Maurer et al., 2011). Due to the
preference of EB1 and EB3 to bind strongly to microtubules with GTP-γS lattices, or GTP
microtubules polymerised in the presence of BeF3–, EB proteins are thought to bind to an
intermediate state of GTP hydrolysis (Maurer et al., 2012; Zhang et al., 2015). EB1 and
EB3 have a weaker preference for GMP-CPP microtubules (Zanic et al., 2009; Maurer
et al., 2012), although removal of KCl increases the binding of EB1 to GMP-CPP-tubulin
to a similar level to that observed at the MT tip (Zanic et al., 2009).
EB1 has been implicated in affecting the tip structure of the microtubule (Vitre et al.,
2008; Maurer et al., 2014). Vitre et al. (2008) show that in electron microscopy images
EB1 reduces the amount of protofilament splaying at the microtubule tip. Maurer et al.
(2014) report that EB1 accelerates a maturation step on the microtubule, as they observe
the peak EB signal approaching the tip of the microtubule with an increase in EB1
1.3. THESIS MOTIVATION AND OUTLINE
1.3
Thesis Motivation and Outline
EB3 (and EB1) have been shown to increase microtubule growth speed and to increase
microtubule catastrophe rate. Based on the GTP cap model this effect appears to
be a paradox. As microtubules grow faster the size of the GTP cap should increase
reducing the probability of catastrophe. However, EB3 causes an increase in catastrophe
rate. The increase in growth speed can be explained by EB proteins stabilising lateral
and longitudinal interactions, thereby reducing the rate of dissociation of tubulin. The
reduction in the disassociation rate of tubulin, increases the growth speed of the
microtubule. According to the 2D model this would present an increase in taper at the
tip of the microtubule. This idea appears to contradict Maurer et al. (2014) who show
that EB1 accelerates a maturation step on the microtubule and report no measurable
microtubule taper. This leads to the first research question that was investigated:
”How does EB3 simultaneously promote catastrophe and growth of a microtubule?”
To test this, EB3 was chosen as in our hands it has the highest affinity to the microtubule
in the hope that any result would be more pronounced. Dynamic fluorescent microtubules
were imaged by a total internal reflection fluorescence microscopy. The methods used
to detect changes in microtubule taper in Gardner et al. (2011) (based on the paper
Demchouk et al. (2011)) were carefully investigated and further developed. The code
was then used to measure microtubule tip structure during growth, both in the presence
and absence of EB3. This part is described in the first results chapter, Chapter 3
Whilst all Eukaryotes express a homologue of EB1, mammalian cells express three
members of the EB protein family. EB1 is ubiquitously expressed whilst EB2 and EB3 are
differentially regulated (Straube and Merdes, 2007; Nakagawa et al., 2000). The three
EB proteins have been shown to bind to different sites on the microtubule lattice, and
whilst EB1 and EB3 have similar binding profiles, EB2 is distinctly different. EB1 and EB3
co-locate with sharp peaks, whilst EB2 is displaced down the lattice with no distinctive
1.3. THESIS MOTIVATION AND OUTLINE
”Why do EB family members track the growing microtubule end at spatially distinct sites?”
To test this EB1, EB2 and EB3 distributions were carefully compared against each other
in vitro using total internal reflection fluorescence microscopy. The EB comet shape was
determined over a range of concentrations. Additionally the peak position was determined
for EBs whilst in competition against with other, and alone measured relative to the tip
of the microtubule. These results are described in the second results chapter, Chapter
4.
In Chapter 5 I describe a model to explain the differences in localisation of the three EB
proteins. Structural function analysis by creating chimeric versions of EB3 and EB2 is
presented to begin investigating the mechanism underlying binding preferences.
The results are discussed in detail at the end of each chapter. There is no global
Chapter 2
Materials and Methods
2.1
Materials
Labelled tubulin was from Cytoskleleton Inc, nucleotides were from Jena Biosciences and
all other chemicals were from Sigma unless indicated.
2.2
EB Protein Cloning, Expression and Purification
EB1, EB2 and EB3 ORFs were amplified from random primed cDNA from
mouse-myoblast (C2C12) cell line (Straube and Merdes, 2007) introducing NdeI and EcoRI
restriction sites. GFP was amplified from pEGFP-C1 to introduce EcoRI and NotI
restriction sites. EB and GFP fragments were ligated to pET22b opened with NdeI
and NotI. A resulting frameshift was corrected by opening with EcoRI, mung bean
nuclease treatment and re-ligation of the vector. This allowed expression of N-terminal
EB constructs with a GFP-6xHis C-terminal. GFP was replaced by mCherry to obtain
EB-mCherry-6xHis. All plasmid sequences were verified by DNA sequencing.
DNA constructs were transferred into E. coli BL21 (DE3) and grown to OD 0.6 at 18◦C
in 2xYT broth (1.6% peptone, 1% yeast extract, and 0.5% NaCl) supplemented with
2.2. EB PROTEIN CLONING, EXPRESSION AND PURIFICATION
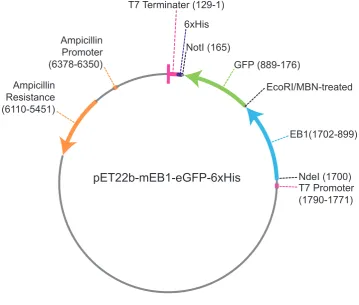
NotI (165)
NdeI (1700) GFP (889-176)
EB1(1702-899) Ampicillin
Resistance (6110-5451)
Ampicillin Promoter (6378-6350)
T7 Terminater (129-1)
T7 Promoter (1790-1771) 6xHis
pET22b-mEB1-eGFP-6xHis
[image:38.595.110.470.81.386.2]EcoRI/MBN-treated
Figure 2.1: EB1 pET22b vector: Vector showing the final vector for mouse EB1 with a C-terminal GFP and 6xHis tag. T7 promoter and terminater shown in pink, the GFP in green, mouse EB1 in blue and the ampicillin promoter and resistance in orange. The NotI and NdeI sites are shown in black along with the location of the EcoR1 site before it was mung bean treated.
concentration of 0.8 mM and bacteria were left for 18 hours to express protein. Bacteria
were harvested in a Thermo Scientific SLA-3000 rotor at 3,000 rpm, 4◦C, for 15 minutes.
The supernatant was discarded, and the pellet was resuspended in twice the pellet
volume of column buffer (50 mM KPO4 buffer pH 7.2, 400 mM NaCl, 2 mM MgCl2, 2 mM
2-Mercaptoethanol). The bacteria were then washed by increasing the volume to 10
times the pellet volume with column buffer and pelleting in a Thermo Scientific Sorvall
Primo centrifuged at 3000 rpm, 4◦C, SLA-3000 rotor for 10 minutes. The pellet was
resuspended in twice the pellet volume of column buffer + 20% glycerol and snap frozen
in liquid nitrogen and stored at -80◦C until required. If used immediately, the glycerol was
omitted.
Cell pellets were defrosted on ice. On defrosted bacteria were lysed in binding buffer
2.2. EB PROTEIN CLONING, EXPRESSION AND PURIFICATION
lysozyme and 1 mM PMSF by sonication. The lysed cells were clarified by two
consecutive spins in Thermo Scientific SS-34 rotor at 20,000 rpm, 4◦C for 15 minutes,
or until clear. The supernatant was incubated for one hour at 4◦C with 0.5 ml of Ni-NTA
Agarose (Qiagen, 30210) per ml of pellet volume. The Ni-NTA agarose had been
equilibrated into binding buffer by being washed with ddH2O three times. The Ni-NTA
agarose was washed by dilution with 5xNi-NTA volume of ddH2O, resuspension, pelleting
via very gentle centrifugation, and careful removal of the waste liquid above the agarose
bed volume. To equilibrate Ni-NTA into binding buffer, the washing step was repeated
with binding buffer. Following incubation the supernatant was passed through a 5 ml
syringe with a glass wool filter, and the resulting agarose bed washed with 5 column
volumes of binding buffer and 5 column volumes of wash buffer (column buffer with 20 mM
imizadole). The protein was eluted in column buffer supplemented with 400 mM imizadole
and collected in 500µl fractions.
The main EB containing fractions were identified by absorbance at 280 nm (A280) using
a Thermo Scientific NanoDrop 2000 Spectrophotometer, and combined. Full length
proteins were then purified by size exclusion chromatography using a Superdex200
16/60 column (GE Healthcare) on an AKTApurifier (GE Heathcare) system, controlled
by UNICORN software (GE Heathcare). Modified and chimeric versions of full length
proteins skipped this step.
All buffers used with the AKTApurifier were filtered using a Millipore Stericup-HV, 0.45µm,
PVDF, 500 ml. The column was removed from storage buffer (20% ethanol) by washing
with 2 CV of ddH2O at 1 ml/min and equilibrated with column buffer by washing with 4 CV
of column buffer at 1 ml/min. Protein was loaded using a 2 ml sample loop equilibrated
in column buffer, and eluted at 0.3 ml/min and was collect in 0.5 ml fractions. The peak
fractions identified by absorbance at 280 nm were combined. The column after use was
washed with 2 CV of column buffer. For storage, the column was washed with 2 CV of
ddH2O or until the conductance was stable, and then transferred into 20% ethanol.
Further purification was performed by passing the protein over a HiTrap Q 1 ml ion
exchange column followed by a HiTrap SP 1 ml ion exchange column attached to the
2.3. PURIFICATION OF TUBULIN FROM PORCINE BRAIN
ddH2O at 1 ml/min. They were then equilibrated in modified column buffer (no NaCl,
pH 6.8 for the SP column, pH 7.9 for the Q column) by washing with 5 CV at 1 ml/min.
Further washings were performed by washing with elution buffer (5 CV modified column
buffer with 1 M NaCl, before re-equilibrating with 5 CV of modified column buffer. Protein
from the previous step was diluted 1:10 in modified column buffer and loaded by a sample
pump at 3 ml/min. The sample pump was washed with 5 ml of modified column buffer at
3 ml/min. The protein bound to the column was washed with 5 CV of modified column
buffer at 1 ml/min. The protein was eluted by salt gradient over 15 CV by linear change
from modified column buffer to elution buffer at 1 ml/min. Elutions were captured in 250µl
fractions When moving from the Q column to the SP column, the peak fractions (>50%
of the maximum) from absorbance at 488 nm was combined as the sample to be added
to the SP column. After use, the column was washed with a further 5 CV of elution buffer,
and re-equilibrated with 5 CV of modified column buffer at 1 ml/min. For storage, the
column was washed with 5 CV of ddH2O or until the conductance was stable, and then
transferred into 20% ethanol.
If further concentration was required (<25µM for EB3, or <30µM for EB1 or EB2),
The peak fractions were combined and concentrated using vivaspin columns (Sartorius),
supplemented with 20% glycerol, snap frozen and stored in liquid nitrogen. Protein
concentration was determined by measuring absorption at 280nm and coomassie blue
staining of poly-acrylamide gel electrophoresis protein gels.
2.3
Purification of Tubulin from Porcine Brain
Tubulin was prepared from porcine brains according to published protocols (Gell et
al., 2011) with a couple of modifications. The brains were extracted immediately after
termination of the animal and placed into bags of ice cold PBS containing PBS ice cubes,
and transferred to the laboratory. The brains were normally within the laboratory within
two hours of termination. Upon arrival the brains were weighed and supplemented with
50% weight to volume crude buffer (100 mM PIPES pH 6.8, 0.5 mM MgCl2, 2 mM EGTA
2.3. PURIFICATION OF TUBULIN FROM PORCINE BRAIN
anti-proteases) homogonised by blending at full power for 30 s (Kenwood Mixer). The
slurry was then clarified by centrifugation in SLA-1500 rotor (Thermo Scientific) at 14,500
rpm, 4◦C for 1 hour.
The tubulin was then subjected to its first polymerisation cycle. The supernatant was
transferred to a clean vessel and made up to 5 mM MgCl2, 1 mM NaGTP and 50µl
DCI, 33% v/v glycerol. The solution was then raised quickly, under constant swirling,
to 37◦C and left incubating at 37◦C for an hour, with intermittent perturbation, to allow
microtubules to form. The microtubules were pelleted by centrifugation in SLA-1500 rotor
at 14,500 rpm, 37◦C for 3 hours. The supernatant was discarded and at 4◦C the pellets
were released from the centrifuge pot wall with 10 ml/pellet polymerisation buffer (100 mM
PIPES pH 6.8, 0.5 mM MgCl2, 2 mM EGTA pH 8.0, 0.1 mM EDTA, 0.1 mM NaGTP, 4 mM
DTT supplemented with anti-proteases and 0.1%β-mercaptoethanol) and homogenised
by fifteen strokes of a tight Wheaton homogeniser on ice. The MT’s were then left to
depolymerise on ice for 40 minutes and the solution clarified by high speed centrifugation
in T-865 (Sorvall) at 65,000 rpm, 4◦C for 30 minutes.
The tubulin was then subjected to a second polymerisation cycle. The supernatant was
transferred to a clean vessel and made up to 5 mM MgCl2, 1 mM NaGTP and 50µl DCI,
33% v/v glycerol. The solution was then raised, under constant swirling, to 37◦C and
left to incubate for an hour, with intermittent perturbation, to allow microtubules to form.
The microtubules were pelleted by centrifugation in T-865 rotor at 45,000 rpm, 37◦C for
1 hour. At this point the supernatant was discarded and the pellet snap frozen, and stored
at -80◦C.
In general at this point the frozen pellets were split in half and purified in two batches.
This was due to reduced capacity in the centrifugal rotas used below to process the
whole prep in one step.
The pellets were defrosted on ice and detached using 250µl of column buffer (50 mM
PIPES pH 6.9, 0.2 mM MgCl2, 1 mM EGTA pH 8.0). Each pellet was transfer to a Wheaton
homogeniser with an additional 1 ml column buffer per pellet, and homogenised by ten
2.3. PURIFICATION OF TUBULIN FROM PORCINE BRAIN
depolymerise on ice for 40 minutes and the solution clarified by high speed centrifugation
in TLA-100.3 (Sorvall) at 50,000 rpm, 4◦C for 30 minutes. The clarified supernatant was
then loaded onto a phosphocellulose column equilibrated with GTP column buffer (see
below). The supernatant was loaded via sample loop at 0.2 ml/min with GTP column
buffer. The tubulin was eluted at 0.2 ml/min with GTP column buffer and collected in 1 ml
fractions. Following elution the peak fractions were combined, aliquoted and snap frozen
in liquid nitrogen.
If required the MAPs can be eluted/ or the column cleaned for a second round by running
2 CV of high salt column buffer at 1ml/min. The column was then equilibrated with
GTP column buffer, then ddH2O, before being dismantled. The AKTA was washed and
returned to its storage state by rinsing with 20% EtOH.
2.3.1 Phosophocellulose Column Preparation
The phosphocellulose column was prepared by adding 20 g of phosphocellulose (P11,
Whatman) powder to 0.5 L of 0.5 M NaOH to create a uniform slurry. The resin was
allowed to settle for 5 minutes before the supernatant was removed. The solution was
then neutralised by the addition of 0.5 L of 0.5 M K-phosphate, pH 6.8. Neutralisation was
tested by pH paper. After allowing the resin to settle for 5 minutes the clear supernatant
was removed and the resin washed with 1 L of ddH2O. The resin was then acid treated by
removing the clear supernatant after 5 minutes and re-suspending into 0.5 L 0.5 M HCl.
The resin was allowed to settle for 5 minutes before the clear supernatant was removed.
The solution was then neutralised by the addition of 0.5 L of 0.5 M K-phosphate, pH 6.8.
Neutralisation was tested by pH paper. After allowing the resin to settle for 5 minutes
the clear supernatant was removed and the resin washed with 0.5 L of ddH2O, this step
was repeated once. The clear supernatant was removed after 5 minutes and the resin
was resuspended in column buffer. After 5 minutes half of the clear supernatant was
removed.
The resin was hand packed into a XK56 AKTA column by gravity flow using column buffer.