2019
Addressing New Views on
Working Memory by
comparing Stimulus Complexity
to Performance Load
J.W. Vinke
1 Abstract
Regarding working memory, there are several models competing for viability with the scientific
community. Among the most prominent are the discrete resource models, i.e. the slot model and
discrete representations model, and the continuous scale models, i.e. equal resource model and
variable precision model. We hypothesized whether adding more relevant features to a target
object that needed to be remembered increased the error in recollection. We used a
within-subjects design across three conditions. In the first condition, participants had to just remember
the color of a bar. In the second condition they had to just remember the orientation of the bar. In
the third condition they had to remember both color and orientation. There were no significant
results that showed that adding more relevant features increases error in recollection. However,
an increase in elements to be remembered did increase error. This suggests a middle ground
between the discrete representations model and continuous scale models.
Introduction
Working memory has been defined increasingly detailed conceptually in the past decades (Ma,
Husain, & Bays, 2014). There is, however, still much unknown about the exact nature of
working memory. One particular area of interest lies in the mechanisms by which the capacity of
working memory is governed. This paper explores some theories regarding this subject; focusing
on slot models and limited resource models. We examine which theory is most likely.
Traditional views on working memory
Working memory is a model of the system that is used to maintain and store information for a
short amount of time (A. Baddeley, 2003). The term is used to set it apart from short term
2 short term memory (A. D. Baddeley & Hitch, 1974). Working memory also allows for
manipulation of information through its subsystems (A. Baddeley, 1992).
The capacity of this working memory is traditionally understood to consist of slots. Miller’s
model (Miller, 1956) states that people, on average, can store up to seven items in their working
memory; with a margin of two items less or more. He also offers a solution to the problem of
people being able to remember way more than would normally be possible in this model:
chunking. By combining several items into one slot, people could exceed the number of items
posited by the slot theory. It has already been found that objects comprised of multiple features
are remembered the same as single-feature objects, at least when these objects contain a limited
number of features (Luck & Vogel, 1997).
New views on working memory
The slot model of working memory does not quite fit with recent findings, though. For instance,
it has been found that recollection decreases continuously even before the capacity of seven slots
would be reached (Ma et al., 2014). The slot theory is also insufficient for explaining differences
in precision when measuring on an estimate scale (P. M. Bays, Catalao, & Husain, 2009). This
leads to claims stating that while the slot model is convenient, it is also too simple and limiting to
accurately describe working memory.
Limited resource models
An alternative conceptualization of working memory is that of limited resource models. These
state that memory is a finite pool to be used in flexible quantities across items. Some of these
models still use mostly slot theory to explain distribution of memory capacity, like the discrete
3 be used to enhance the resolution of a remembered item by using multiple slots to process a
single item.
Other models see the resource pool as a singular thing, to be distributed flexibly. These
continuous scale models are further differentiated in the equal resource model (Paul M. Bays &
Husain, 2008; Palmer, 1990; Wilken & Ma, 2004) and variable precision model (Fougnie,
Suchow, & Alvarez, 2012; van den Berg, Shin, Chou, George, & Ma, 2012). The equal resources
model states that the memory resources from the pool are distributed equally across the items
needed to be remembered. This means that in the case of one item, the entire pool can be utilized
on that single item. When remembering multiple items, the resources will be allocated uniformly
to those items.
The variable precision model proposes that the memory resources can be distributed flexibly,
with resource distribution being governed by attention, alertness and salience of the items
(Fallon, Zokaei, & Husain, 2016; Klink, Jeurissen, Theeuwes, Denys, & Roelfsema, 2017; van
den Berg et al., 2012). The resource pool is not necessarily distributed equally among all items in
this model. The pool can be distributed flexibly a priori, and even a posteriori (Schneider,
Göddertz, Haase, Hickey, & Wascher, 2019).
Aims and research question
Most of the models mentioned focus on the items that need to be remembered, and not much
research is done on the properties of those items. This paper seeks to explore whether a
difference in complexity of the items by adding more features relevant to the task at hand
impacts the performance of the working memory. This would not be the case in a discrete
resource model like the slot theory or the discrete representations model because the features
4 several in case of the discrete representations model. Because the item with all its features is
being chunked into one slot, there would be no additional resource drain from extra features.
As for the continuous resource models like the equal resources model and the variable precision
model; it is to be expected that performance drops and errors rise in these models when adding
more features as resources become strained between individual features and the item they are
associated with. In these cases, every additional feature drains the resource pool, causing more
errors.
This brings up the question: does the adding of more features relevant to the memory task in the
same number of items increase the amount of error in recalling those features in visual stimuli?
Method
Participants
Eighteen subjects (age 18 to 28, sixteen female, three male) who gave their informed consent
prior to the experiment participated in the study. The experiment was approved by the University
of Twente ethics committee. The subjects had normal or corrected-to-normal visual acuity,
which was tested before the experiment using 18 Landolt-C stimuli (Bach, 2006). They also had
no to slight color blindness (14 or more correct answers on the first 21 plates), as tested by an
online color blindness test (Flück, 2006), a digital adaptation of the Ishihara 38 plate Colour
Vision Deficiency test (Ishihara, 1960).
Materials
The physical set-up comprised a display 21 inch in diameter and used a standard international
keyboard as input. The participant was set at a viewing distance of 50 cm from the screen. The
5 background, with a white cross in the middle to center fixation. The colors of the bars, described
here in the Hue, Saturation, Value (HSV) model, all had a brightness (value) and saturation of
100%, while their hues ranged from 0° to 324° with increments of 36° in between. They were
rotated at angles 0° to 150°, with increments of 30° within that range. The bars had a visual angle
of 3.2° in length. The stimuli appeared in a square area with a radius of 7.9° centered on the
white fixation cross. The bars were spaced apart far enough to avoid accidental illusory
conjunctions (A. Cohen & Ivry, 1989). The gray prompt square had a surface of 7.9° x 7.9°.
Procedure
After giving informed consent the participants were asked to fill in a general questionnaire, after
which they were tested for visual acuity and color blindness.
After the preliminary tests, the participants were tasked to complete the main exercise. All trials
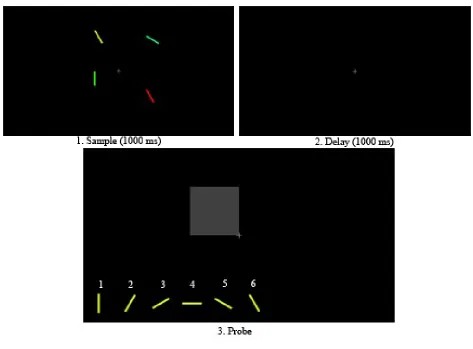
followed the same basic framework, a visual example of which is shown in Figure 1. In each trial
a sample picture containing stimuli was shown for 1000 ms, after which it would disappear for
1000 ms. Then, the gray prompt square would indicate the area which had contained the bar the
participant needed to have remembered. They were then shown multiple-choice options of either
10 different colors or 6 different orientations, at which point they could enter their answer. When
a choice was made the screen would be blank for 1000 ms, after which the next trial started. The
fixation cross would be on screen during the full length of every trial.
The participants got a small break of up to one minute after each 25 trials, which they could end
early by pressing a key. The first block of 25 trials always contained only one stimulus in the
sample picture, always displayed in the top-right quadrant of the picture due to programming
limitations. The second block of 25 always contained two stimuli, always in the top-right and
6 quadrant around the fixation cross. The stimuli always appeared in a random location within
quadrants of 7.9° by 7.9° in size. The blocks were always presented in this order. After these
[image:7.612.69.542.157.506.2]three blocks the participants moved on to the next condition within the overall experiment.
Figure 1 Example of a trial with four items, and orientation needed to be remembered.
Each participant had to complete three sets of these three blocks, each with slightly varying
instructions. In condition 1, participants were instructed to remember only the color of the bars,
and were only given the option of answering in terms of the 10 different colors. Likewise, in
condition 2, the participants were tasked to remember only the orientation of the bars, and given
the option to answer only in terms of the 6 different possible orientations. In condition 3, the
7 asked to answer in terms of either color or orientation. Whether they would be asked for color or
orientation was randomized per trial in this condition.
Design
The experiment was set up as a within-subjects type of design. In this case, the first independent
variable was the condition of what to memorize with three factorial levels, i.e. the color of the
bar, orientation of the bar, or both. This is directly linked to the amount of features the
participant had to memorize. The second independent variable was the number of elements, with
three levels as well: one element, two elements and four elements.
The error participants made in recalling was measured in degrees in order to quantify the amount
of error. This means that a greater deviation from the correct answer resulted in a greater
recorded error. It is important to note though that while both color and orientation were measured
in degrees, they are not directly comparable. The error in color in measured in degrees of hue in
the HSV-model of describing color and ranges from 1 to 359. Meanwhile the error in orientation
is measured in degrees of rotation, ranging from 1 to 179.
The order in which the conditions (color, orientation, both) were presented to each participant
was varied across participants to correct for learning effects that might occur between these
conditions. So, in total there were 6 different orders in which participants could have undergone
the experiment. These six were divided equally across the eighteen participants.
Results
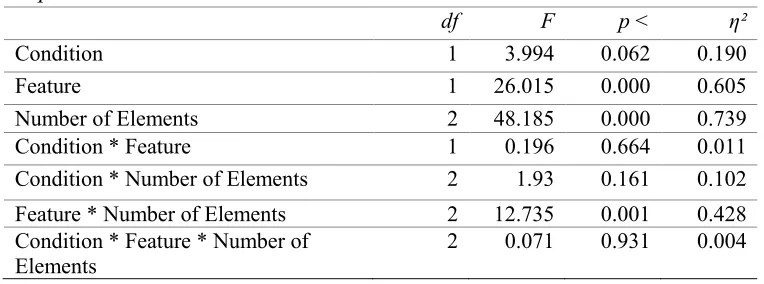
As presented in Table 1, which shows results of the repeated measures ANOVA test, there is a
8 F(2,17) = 48.2 p < 0.001, with an effect size of η² = 0.739. This is in accordance with the
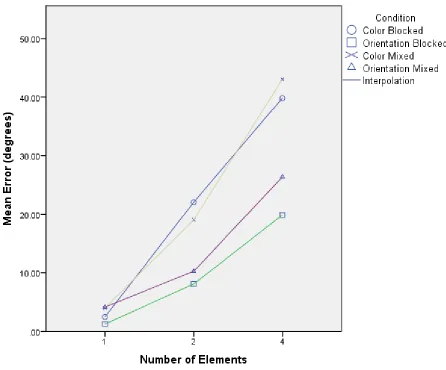
discrete representations model of working memory. This is also illustrated in Figure 2.
When looking at the difference in error between conditions (blocked or mixed), no effect was
found, F(1,17) = 3.994 p = 0.062, η² = 0.190. Neither was there any interaction effect between
condition and either the number of elements on screen, which feature was prompted, or both.
Although no effect can be concluded, there is still a medium effect size when analyzing error
between conditions (J. Cohen, 2013).
Finally, there is also an interaction effect between the type of feature and the number of
[image:9.612.70.452.385.527.2]elements, F(2,17) = 12.74 p = 0.001, η² = 0.428.
Table 1
Repeated measures ANOVA
df F p < η²
Condition 1 3.994 0.062 0.190
Feature 1 26.015 0.000 0.605
Number of Elements 2 48.185 0.000 0.739
Condition * Feature 1 0.196 0.664 0.011
Condition * Number of Elements 2 1.93 0.161 0.102 Feature * Number of Elements 2 12.735 0.001 0.428 Condition * Feature * Number of
Elements
9 Figure 2 Mean Error in Degrees plotted against the multiple numbers of elements, across each
condition. Note that Condition 3 (Mixed) is divided over both possible prompts in that condition.
Discussion
The results show that there was not enough evidence to say that adding more relevant features to
an item increases the amount of errors, and therefore impacts performance. This observation, as
well as the increase in errors with the increasing number of items, is in accordance with the
findings of Zhang & Luck (2008) and their discrete resource model.
It should be noted, however, that though no statistical evidence was found linking the number of
10 circumstances, a type II error is not unlikely. In case of such a type II error, adding multiple
features would have an impact on working memory performance, supporting the continuous
resource models (Paul M. Bays & Husain, 2008; Fougnie et al., 2012; Palmer, 1990; van den
Berg et al., 2012; Wilken & Ma, 2004). This outcome also lines up with one of the open
questions Ma, et al. pose: “Another direction would be to combine ingredients from existing
models in new ways, such as a continuous-resource model with a maximum number of items that
can be stored or models in which the number of items stored varies across trials” (Ma, et al.,
2014, p.354).
Limitations
Due to the discrepancy between effect size and p-value regarding different conditions, a Mauchly
test for sphericity was performed, which returned positive results. This means the findings were
not distorted by a violation of the assumption of sphericity in the repeated measures ANOVA.
Other confounding factors may have had to do with color perception. Since humans do not
perceive colors equally well across the entire spectrum (Schnapf, Kraft, & Baylor, 1987), this
might have resulted in a bias towards certain colors in the results, since a linear scale was used in
the experiment. There is also a possibility of bias regarding orientation, since humans are more
sensitive to lines of certain orientations than others (Girshick, Landy, & Simoncelli, 2011;
Movshon & Blakemore, 1973).
Attentional bias may also have been in play during the experiment due to position uncertainty, in
combination with having more stimuli being shown in certain places with more frequency. Since
single stimuli were always shown in the top-right quadrant, and double stimuli in both right
quadrants, participants might have been predisposed to those locations in any arrangement. This
11 orientation. Since these were only six instead of ten, they were show predominantly on the left
side of the screen.
The difference in multiple choice options might also be the cause of the significant effect that
was found regarding the interaction effect between the type of feature being shown and number
of elements; either by making it easier to remember by only having to remember relatively few
orientations, or by making it more likely to guess right due to the lower number of options.
Finally, position uncertainty may have distracted participants from the task of remembering the
items. Because the positions of the stimuli changed with each trial (random within bounds) they
might instead have been focused on finding the stimuli first, so they could not have their full
attention on the memorization.
Further research
This study showed a possible effect of the number of features on working memory performance,
but nothing conclusive. To improve this study, more features might be added to individual
elements, and the effect measured. It could be possible that the number of features used in this
study was insufficient to reach the limits of chunking, explaining the trend towards continuous
resource models, though not being able to confirm it.
Perhaps more lifelike stimuli are a good way to go with further research (Ma et al., 2014). This
also falls in line with the previously mentioned adding of more features, while simultaneously
representing a more natural and practical environment.
Conclusion
As it stands this study suggests a middle ground between discrete resource models and
12 Ma, 2018). Meanwhile it confirms the discrete resource model (Zhang & Luck, 2008) as an
adequate fit as it stands now.
References
Bach, M. (2006). The Freiburg Visual Acuity Test-Variability unchanged by post-hoc re-analysis.
Graefe's Archive for Clinical and Experimental Ophthalmology, 245(7), 965-971.
doi:10.1007/s00417-006-0474-4
Baddeley, A. (1992). Working memory. Science, 255(5044), 556-559. doi:10.1126/science.1736359
Baddeley, A. (2003). Working memory: looking back and looking forward. Nature Reviews
Neuroscience, 4(10), 829-839. doi:10.1038/nrn1201
Baddeley, A. D., & Hitch, G. (1974). Working Memory. In G. H. Bower (Ed.), Psychology of Learning
and Motivation (Vol. 8, pp. 47-89): Academic Press.
Bays, P. M., Catalao, R. F. G., & Husain, M. (2009). The precision of visual working memory is set by
allocation of a shared resource. Journal of Vision, 9(10), 7. doi:10.1167/9.10.7
Bays, P. M., & Husain, M. (2008). Dynamic shifts of limited working memory resources in human vision.
Science (New York, N.Y.), 321(5890), 851-854. doi:10.1126/science.1158023
Cohen, A., & Ivry, R. (1989). Illusory conjunctions inside and outside the focus of attention. Journal of
Experimental Psychology: Human Perception and Performance, 15(4), 650.
Cohen, J. (2013). Statistical Power Analysis for the Behavioral Sciences.
Fallon, S. J., Zokaei, N., & Husain, M. (2016). Causes and consequences of limitations in visual working
memory. Annals of the New York Academy of Sciences, 1369(1), 40-54.
doi:doi:10.1111/nyas.12992
Flück, Daniel. “Ishihara 38 Plates CVD Test – Colblindor.” Colblindor, 2006,
www.color-blindness.com/ishihara-38-plates-cvd-test/
Fougnie, D., Suchow, J. W., & Alvarez, G. A. (2012). Variability in the quality of visual working
13 Girshick, A. R., Landy, M. S., & Simoncelli, E. P. (2011). Cardinal rules: visual orientation perception
reflects knowledge of environmental statistics. Nature neuroscience, 14, 926.
doi:10.1038/nn.2831
Ishihara, S. (1960). Tests for colour-blindness: Kanehara Shuppan Company.
Klink, P. C., Jeurissen, D., Theeuwes, J., Denys, D., & Roelfsema, P. R. (2017). Working memory
accuracy for multiple targets is driven by reward expectation and stimulus contrast with different
time-courses. Scientific Reports, 7(1), 9082. doi:10.1038/s41598-017-08608-4
Luck, S. J., & Vogel, E. K. (1997). The capacity of visual working memory for features and conjunctions.
Nature, 390, 279. doi:10.1038/36846
Ma, W. J., Husain, M., & Bays, P. M. (2014). Changing concepts of working memory. Nature
neuroscience, 17(3), 347-356. doi:10.1038/nn.3655
Miller, G. A. (1956). The magical number seven, plus or minus two: some limits on our capacity for
processing information. Psychological Review, 63(2), 81-97. doi:10.1037/h0043158
Movshon, J., & Blakemore, C. (1973). Orientation specificity and spatial selectivity in human vision.
Perception, 2(1), 53-60.
Palmer, J. (1990). Attentional limits on the perception and memory of visual information. Journal of
Experimental Psychology: Human Perception and Performance, 16(2), 332-350.
doi:10.1037/0096-1523.16.2.332
Schnapf, J. L., Kraft, T. W., & Baylor, D. A. (1987). Spectral sensitivity of human cone photoreceptors.
Nature, 325(6103), 439-441. doi:10.1038/325439a0
Schneider, D., Göddertz, A., Haase, H., Hickey, C., & Wascher, E. (2019). Hemispheric asymmetries in
EEG alpha oscillations indicate active inhibition during attentional orienting within working
14 van den Berg, R., & Ma, W. J. (2018). A resource-rational theory of set size effects in human visual
working memory. eLife, 7, e34963. doi:10.7554/eLife.34963
van den Berg, R., Shin, H., Chou, W.-C., George, R., & Ma, W. J. (2012). Variability in encoding
precision accounts for visual short-term memory limitations. Proceedings of the National
Academy of Sciences of the United States of America, 109(22), 8780-8785.
doi:10.1073/pnas.1117465109
Wilken, P., & Ma, W. J. (2004). A detection theory account of change detection. Journal of Vision, 4(12),
11-11. doi:10.1167/4.12.11
Zhang, W., & Luck, S. J. (2008). Discrete fixed-resolution representations in visual working memory.