The Impact of Energy Consumption and Economic
Development on Changes in China’s Provincial-Level
Environmental Quality
*
Wan-Ping Yang1,2, Ban Lan1, Kunshi Zheng1
1School of Economics and Finance, Xi’an Jiaotong University, Xi’an, China 2School of Public Policy administration, Xi’an Jiaotong University, Xi’an, China
Email: [email protected], [email protected]
Received September 18, 2012; revised October 16, 2012; accepted November 10, 2012
Copyright © 2013 Wan-Ping Yang etal. This is an open access article distributed under the Creative Commons Attribution License, which permits unrestricted use, distribution, and reproduction in any medium, provided the original work is properly cited.
ABSTRACT
Based on the features of energy consumption and economic development in China, since single pollutant can hardly express the situation of environmental pollution, we propose a pollution emissions index that can reflect the level of environmental quality, measure China’s 28 provinces’ environmental quality from 1995 to 2010 with a dynamic objec-tive evaluation method based on the overall differences first time. Then panel data model was applied to analyze the impact of energy consumption and economic development on China’s and regional environmental quality. The results showed that emissions index varied among different regions and there was great potential for emission reduction; there was a significant positive correlation between emissions index and scale of economies and industrial structure; there was a negative correlation between emissions index and energy efficiency, energy prices and degree of opening up. Policy implications are as follows: 1) reduction policies should be made in line with local conditions; 2) the eastern re-gion is the key areas of emissions reduction; 3) to improve energy efficiency is an important way to reduce emissions.
Keywords: Energy Consumption; Economic Development; Dynamic Comprehensive Evaluation;
Pollution Emissions Index; Panel Data Model
1. Introduction
In the past 30 years, China has experienced sustained and rapid economic growth, which is partly simulated by the extensive mode of economic growth aimed to GDP one- sided. However, a series of problems such as energy shortage and environmental pollution has been brought meanwhile. Faced with a “dilemma” between energy and development in the traditional sense to a “tripartite tan- gle” of energy, environment and development, the state
proposed the strategic goal of building a “two-oriented society” timely, trying to achieve the harmony and unity of the three by integrating. In the “Eleventh Five-Year Plan”, it is clearly proposed that energy consumption intensity (ton of standard coal per ten thousand Yuan Dynasty of GDP) should be reduced by 20% and major pollutants emissions should be cut 10%.
Economic development must not stop in spite of en- ergy consumption and environmental pollution. Since Chinese reform and opening up, energy consumption has increased significantly in the rapid economic growth: in 2010 it is 5.69 times as that of 1978. However, energy consumption intensity (in current price) dropped signifi- cantly from 15.68 tons of standard coal in 1978 to 0.81 tons of standard coal in 2010 and the proportion of coal in total energy consumption fell by 2.7 percentage point. Meanwhile the rate of environmental pollutants emis- sions decreased as well. These indicate it is possible that achieving the strategy of sustainable development through
*Supported by: the major project of State Social Sciences Fund:
coun-termeasures study of the transformation of economic development in China to promote scientific development (11AZD001); the Program for New Century Excellent Talents in University of Ministry of Education of China: the research on the index evaluation system of Chinese low-carbon economy (NCET-10-0683); the youth programs of State Social Sciences Fund: energy consumption, pollution emissions and sustainable economic development in China (10CJL034); China’s Post-doctoral Fund: the transformation and sustainability of economic development in China in “tripartite tangle” society (2012M521752); the special fund of state-run university’s basic research funding, the re-search plan supporting new teachers and the third subproject of 211 in Xi’an Jiaotong University: the national key subjects of industrial eco-nomics oriented to the research of strategic industrial development.
To control the regional pollution is based on a clear understanding of the regional pollution characteristics, which can provide a theoretical basis and macro-control ideas on coordinating regional economic development, energy consumption and environmental protection in China. Therefore, we will correctly understand and accurately evaluate the environmental pollution in different areas of China and study the influence of energy consumption structure, energy consumption intensity, energy prices, economic growth and economic structure on the envi- ronmental pollution in different regions of China. The study can help to find out the potential cause of the dif-ference of the environmental pollution in different areas, provide a scientific basis on formulating the effective measures of reducing pollution emissions, and then con- tribute to the long-term sustainable economic develop- ment of China. Overall, it is undoubtedly significant in both theory and practice to correctly.
2. Literature Review
Foreign scholars studied the impact of economic devel- opment and energy consumption on the environmental quality earlier. Hettige et al. (2000) [1] calculate the ef- fect of economic scale, industrial structure and techno- logy on the BOD of both developed and developing countries. Zhang (2000) [2] calculates the effect of the proportion of fossil energy in total energy consumption, the ratio of fossil energy consumption to non-fossil, pro- ductivity and economic scale on the carbon dioxide
emissions of China. Antweiler et al. (2001) [3] calculate
the effect of economic scale, industrial structure, tech- nology and trade on global sulfur dioxide emissions. Stern (2002) [4] believes that the expansion of economic scale has a positive effect on the increase of global sulfur dioxide emissions while it has a negative effect on scien- tific and technological progress by non-linear pollution decomposing model and regression analysis based on the panel data of 64 countries’ sulfur dioxide emissions in 1973-1990. Dinda (2004) [5] considers that there are many reasons for environmental degradation, while the main factors are the expansion of economic scale, changes in industrial structure as well as scientific and technological progress.
Domestic scholars researched more deeply into the is-sues of economic development, energy consumption and environmental quality from various angles. Yang Fu-xia, Nie Hu-ling, Yang Mian (2010) [6] measure the compos-ite environmental pollution index of China in 1986-2007 by selecting three indictors: the total wastewater emis- sions, industrial exhaust emissions and industrial solid waste emissions; then study the effect of industrial struc-ture, environmental policy, the level of urbanization and FDI on the composite environmental pollution index of China via introducing the generalized impulse response
expansion of economic scale as well as the changes of industrial structure and energy consumption structure exacerbated environmental pollution while the improve-ment of productivity as well as the innovation and pro-motion of environmental technologies reduced environ-mental pollution.
It can be seen that the above embrace both direct and indirect way, in which economic development and en-ergy consumption affect environment. However, when the mechanism of action how economic development and energy consumption impact environment studied, there are at least two issues: 1) most literatures characterize environmental quality with single indicator or multiple single indicators. Single indicator is difficult to represent the pressure on the environment (Grossman and Krueger, 1991 [16]), integrating all the indictors that influence environmental pollution into the form of single index is required. Although some researches introduce the com-posite environmental indicators (Wang Xi-qin, Li Fen, 2005 [17]; Shen Feng, 2008 [18]; Yang Wan-ping, Yuan Xiao-ling, 2009 [19]), which is a step forward than single indicator, yet there is a great deal of subjectivity and limitations because of the evaluation object selected only from a single region or the weights determined by ex-perts scoring method. Yang Long, Hu Xiao-zhen (2010) [20] and Shen Neng (2010) [21] comprehensively evalu-ate environmental quality of province region by im-proved entropy method, but there are at least two debat-able problems: a) there is duplication of selecting indica-tors, because they ignore the fact that industrial exhaust emissions include industrial soot emissions, industrial dust emissions and industrial sulfur dioxide emissions; b) inter-provincial pollution evaluation is not comparable, since entropy method is only suitable for the analysis of time series or cross-sectional data, then the data of panel analysis is not comparable among province. 2) Most studies limit to single or sporadic several elements and lack of comprehensiveness and systematization.
Owing to these, we try to expand existing literatures on the basis of existing achievements: above all, we set up a comprehensive indicator of environmental quality— the environmental pollution index. Since we introduce a dynamic objective evaluation method in view of the overall differences to evaluate the environmental quality of China’s provinces at different times, the index can maximize the representation of the overall environmental quality in order to solve the dilemma that the empirical research based on a single or a few independent envi-ronmental pollution indicators can not reveal the overall environmental quality. Next, in the perspective of eco-nomic structure and energy, we comprehensively and systematically study the main factors affecting environ-mental quality by panel data model so as to find a rea-sonable scientific basis for formulating environmental
policy and explore the focal point of emission reduction.
3. The Trend of Environmental Quality
3.1. Indicator Selection and Data Sources
Environmental quality can be measured from multiple dimensions. Taking the availability of data into account, the paper selects the indicators of pollution emissions; considering the impact of three pollutants including waste-water, exhaust and solid waste, the paper consolidates them to form a pollution emissions index that can reflect the level of environmental quality. Because wastewater and exhaust is difficult to be stored, emissions are adopted. Since tremendous amount of solid waste is stored instead of being discharged, production is employed. Seeing that the monitoring and statistics of China’s environmental quality is mainly on the base of industrial pollutants sta-tistics, finally we pick industrial wastewater emissions, industrial exhaust emissions and industrial solid waste production as indictors that influence the comprehensive evaluation index of environmental quality. The index simultaneously considers the impact of gaseous, solid and liquid emissions on the environmental quality, which is able to report environmental quality better. Therefore, we can directly compare the overall environmental qual-ity of various regions. Data sources from “China Statis-tical Yearbook” and “China StatisStatis-tical Yearbook of En-vironment” in the relevant years.
3.2. Dynamic Comprehensive Evaluation Method of Pollution Emissions Index
Evaluation of environmental quality should be based on objective fact to avoid the interference of subjective fac-tors. Thence, we choose dynamic objective comprehen-sive evaluation—vertical and horizontal scatter degree method [22], which is suitable for panel data. It is the first time that the method is used to evaluate environ-mental quality. The main steps to evaluate the overall environmental quality are:
1) Standardization of data. Since different indicators have different dimensions and units, which give rise to incommensurability, so as to eliminate it we should turn evaluation indicators into dimensionless in the first place. Suppose
x tij
k
as the numerical value of indicator jof sample i at time
1, 1, 2, , ; 1, 2, ,
k
t i 2, , ; m j n k T ).
ij
k
j
k ij kj k
x t x t
x t
s t
(1)
In the formula: x tij
k is the numerical value ofstan-dardization; i is province; j is pollution indicator; x tij
kis the original numerical value; x tj
k ,s tj
k are mean2) Calculate real symmetric matrix Hk:
1, 2, ,k k k
H X X k T . In the formula:
11 1
1
, 1, 2, ,
k m k
k
n k nm k
x t x t
X k T
x t x t
(2)
3) Find maximized eigenvalue and standard
eigenvec-tors corresponding to it. And,
1 2 k 1, 2, ,
HH H H k T (3)
4) Calculate weight vector j: Normalize standard
eigenvectors to certain combined j.
5) Calculate the numerical value of environmental pol-lution index P ti
k :
1
, 1, 2, , ; 1, 2, , n
i k j ij k j
P t x t k T i m
(4)In the formula: is the pollution index that
in-dicates the environmental quality of province at time
k,
i k
P t
i
t j is the weighs of pollution emission j. The larger
the index, the worse the environmental quality.
3.3. The Evolution of Environment Quality
The study covers all the regions of China except Tibet, Taiwan, Hong Kong and Macao. Moreover, in order to maintain the consistency of the statistical coverage of data, we classify the data of Hainan Guangdong and the data of Chongqing Sichuan, thus there are 28 provinces, municipalities and autonomous regions altogether (here-inafter referred to as provinces).
Calculate the weight coefficient corresponding to
maxi-mized eigenvalue due to symmetric matrix H. Then we
can obtain the numerical value of the comprehensive evaluation of the environmental quality in 28
prov-inces—pollution emissions index . For the
pur-pose of visual comparison and generality, we process the
translation of , which is
i k P t
i kP t
P ti k 2
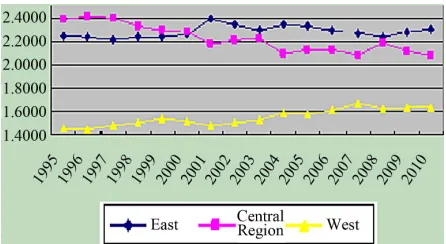
(Table 1).From the regional perspective1 (east, central region
and west) (Figure 1), the mean of pollution emissions
index of east in 1995-2010 is in an overall upward trend; while that of central region is exactly opposite, in a gradual downward trend; the index of west in 1995-2010 is in an overall upward trend as well, it is noteworthy that the trend of pollution is severely exacerbated after 2000.
Comparing the mean of pollution emissions index of different regions in China in sample period of 1995-2010,
we can see: the mean of pollution emissions index of east, central region and west are followed by 2.2711, 2.2175 and 1.5488 in sample period of 1995-2010, the mean of east and central region is higher than that of China and much higher than that of west. Single provinces whose numerical values of pollution emissions index are higher than the sample mean of all provinces are followed by Hebei (3.8212), Jiangsu (3.4260), Jilin (3.4194), Liaon-ing (3.4066), Shanxi (3.1711), Heilongjiang (2.6472), Henan (2.6263), Shandong (2.5830), Zhejiang (2.2650), Hubei (2.0793), Ningxia (2.0210) and other provinces.
4. Data Sources and Model Specification
4.1. Data Sources
The paper applies the panel data of China’s 28 provinces in 1995-2010. Data sources from “China Statistical Year-book” and “China Statistical Yearbook of Environment” in the relevant years. Explained variable is the pollution emissions index that represents the environmental quality; on the basis of China’s current historical period and its real situation, explanatory variables include: 1) Economic scale (GDP). Characterize it with GDP of each province, set 1990 as the base year and commodity retail price in-dex lay the foundation of GDP decorator; 2) Industrial Structure (SC). Use each the proportion of (regional) secondary industry output in (regional) GDP to indicate SC; 3) Trade Openness (OPE). Express it as the propor-tion of (regional) import and export value (in RMB) in (regional) GDP; 4) Energy Efficiency (EE). It equals reciprocal of energy consumption intensity; 5) Energy Price (EP). Express it as Purchasing Price Index of Raw
Material, Fuel and Power(PPIRM)and set 1990 as the
base year.
Considering that logarithm can eliminate heterosce-dasticity of data and maintain the characteristic of data, in the paper we actually analyze logarithmic value of each variable. Therefore, we construct an empirical model containing seven explanatory variables.
, , 1 , 2 , 3 4 , 5 , ,
GDP SC OPE
EE EP
i t i t i t i t i t
i t i t i t
LnP C Ln Ln Ln
Ln Ln
,
(5)
In the formula: i, t denote the corresponding value of
different provinces in different period; ij is stochastic
error term and obey normal distribution.
4.2. Model Specification
Because of the data in the paper is 28 provincial cross- sectional data of year 1995-2010, they can be regarded as Pool Data as well as Panel Data. Pool Data assumes each cross-section independent but obey different distribution while Panel Data is obtained by annually repeating the
1East: 10 provinces including Beijing, Tianjin, Hebei, Liaoning, Shanghai,
Table 1. Pollution emissions index of 28 provinces in China (1995-2010).
Year 1995 1996 1997 1998 1999 2000 2001 2002 2003 2004 2005 2006 2007 2008 2009 2010 Mean value
Beijing 1.3631 1.3970 1.4318 1.3250 1.2642 1.2384 1.1693 1.0793 1.0247 1.0533 1.0389 1.0287 1.0005 0.9221 0.9013 1.0042 1.1401 Tianjin 0.9699 0.9408 0.9332 0.8634 0.8334 0.9098 1.0698 1.1108 1.1092 1.0375 1.1577 1.1554 1.0721 1.0563 1.0198 1.1626 1.0251 Hebei 3.3898 3.4090 3.4599 3.7402 3.5501 3.4005 3.5725 3.5163 3.6198 4.3034 4.1424 4.1323 4.2968 3.8837 4.2783 4.4443 3.8212 Liaoning 3.1262 3.2406 3.4038 3.3887 3.3997 3.5640 3.5625 3.3956 3.3953 3.3782 3.4210 3.3262 3.3668 3.5027 3.5461 3.4880 3.4066 Shanghai 2.1554 2.1670 2.1034 1.9387 1.8842 1.8789 1.8781 1.8215 1.7304 1.6846 1.5358 1.4513 1.3821 1.3681 1.3027 1.3888 1.7294 Jiangsu 3.5882 3.5483 3.1974 3.2613 3.3493 3.3076 3.8274 3.7610 3.5165 3.5166 3.5196 3.5365 3.1593 3.1799 3.2048 3.3425 3.4260 Zhejiang 1.7556 1.6996 1.8046 2.1290 2.1663 2.3438 2.4852 2.4540 2.5161 2.4305 2.4071 2.3837 2.3920 2.3852 2.4154 2.4720 2.2650 Fujian 1.2939 1.2452 1.1789 1.2301 1.3735 1.5468 2.0177 1.8642 1.7792 1.8437 1.8963 1.8557 1.9155 1.9284 2.0190 1.9003 1.6805 Shandong 2.6458 2.5301 2.3407 2.5281 2.5997 2.6132 2.5126 2.6817 2.6069 2.5945 2.7150 2.5534 2.6473 2.7055 2.6286 2.4242 2.5830 Guangdong 2.0862 2.1787 2.1989 1.9215 1.8459 1.7919 1.7335 1.6737 1.6176 1.5004 1.4451 1.4521 1.4040 1.4017 1.4631 1.3972 1.6945 Shanxi 1.5806 1.5851 1.5561 1.3870 1.4178 1.3731 1.3339 1.2960 1.2608 1.2942 1.3425 1.3047 1.2782 1.2667 1.2931 1.3310 1.3688 Jilin 4.0467 4.0572 4.1077 3.7694 3.7022 3.5392 3.2648 3.1707 3.1742 2.8023 3.2010 3.3635 2.9853 3.5599 2.9348 3.0324 3.4194 Heilongjiang 2.3237 2.4008 2.3907 2.7669 2.6701 2.7634 2.6224 2.7911 3.0325 2.6700 2.6711 2.6636 2.6383 2.7789 2.5701 2.6011 2.6472 Anhui 2.0839 2.0079 2.0821 1.8649 1.8641 1.8209 1.8704 1.8485 1.7848 1.7094 1.7033 1.7681 1.8968 2.0229 2.0214 1.8342 1.8865 Jiangxi 1.9550 1.9780 1.8205 1.7051 1.6507 1.7891 1.6568 1.8556 1.8894 1.7963 1.7763 1.7976 1.7590 1.7634 1.7792 1.6996 1.7920 Henan 2.5885 2.5724 2.6965 2.5594 2.6139 2.6622 2.6622 2.7493 2.7220 2.5700 2.6025 2.5734 2.5574 2.5974 2.6988 2.5954 2.6263 Hubei 2.3013 2.3868 2.3021 2.3446 2.3732 2.2925 2.0634 2.0807 2.0029 2.0120 1.9103 1.8913 1.7684 1.8035 1.8168 1.9186 2.0793 Hunan 2.2156 2.2447 2.1723 2.2196 2.0632 1.9800 1.8827 1.8482 1.9086 1.9056 1.8112 1.6567 1.7370 1.6786 1.7548 1.6558 1.9209 Inner Mongolia 1.4511 1.4209 1.4502 1.4328 1.4189 1.4056 1.3723 1.4428 1.4325 1.4834 1.5415 1.4922 1.5132 1.6238 1.5818 1.4792 1.4714 Guangxi 1.3599 1.3554 1.3784 1.3339 1.3003 1.2752 1.1634 1.1840 1.2691 1.1923 1.1871 1.1683 1.1778 1.1444 1.1228 1.1623 1.2359 Sichuan 0.5938 0.6088 0.5810 0.5784 0.6147 0.6677 0.7464 0.7067 0.6989 0.8031 0.8434 0.8620 0.8855 0.8889 0.8685 0.9204 0.7418 Guizhou 0.7304 0.7437 0.7318 0.7008 0.7357 0.8338 0.8342 0.8344 0.8230 0.9183 0.9876 0.9493 0.9892 0.9740 0.9768 1.0576 0.8638 Yunan 0.9703 0.9278 0.9341 0.9223 0.9382 0.9616 1.0252 1.0207 1.0214 1.1014 1.1267 1.1084 1.1345 1.1369 1.1832 1.2259 1.0462 Shaanxi 3.4483 3.1881 3.4038 3.1519 3.4837 3.4627 3.1674 3.2517 3.1540 3.0267 2.9159 3.0551 3.3937 2.9105 2.9895 2.7349 3.1711 Gansu 1.4311 1.3686 1.4118 1.4531 1.5234 1.5657 1.5490 1.5581 1.5300 1.5512 1.5379 1.6181 1.6372 1.6349 1.6559 1.5888 1.5384 Qinghai 1.2647 1.1581 1.2080 1.7343 1.6592 1.4868 1.4083 1.3857 1.4291 1.4456 1.3941 1.5953 1.5464 1.3474 1.4284 1.5307 1.4389 Ningxia 1.6848 1.9043 1.9094 1.9486 1.9591 1.9004 1.9838 1.9385 2.1222 2.2533 2.0456 1.9204 2.2172 2.2945 2.1518 2.1018 2.0210 Xinjiang 1.5960 1.7353 1.8108 1.8009 1.7454 1.6249 1.5649 1.6795 1.8288 2.1223 2.1231 2.3369 2.2482 2.2396 2.3933 2.5064 1.9598
Data sources: calculating according to corresponding data.
Figure 1. Changes in trends of environmental pollution emissions index.
measurement of the same individual within a certain time, which allows a certain degree of correlation between each cross-section [23]. Since each provincial data of
economic development, energy consumption, environ-mental pollution isn’t dependent, we choose to construct a panel data model and estimate by software, Eviews6.0.
The basic expression of panel data model is:
, ,
1, 2, , ; 1, 2, ,
i t i i i t i i t
y C x
i N t
,
T
(6)
In the formula: y is explained variable; x is k-dimen-
sional explanatory variable; i means cross-sectional data;
t indicates time-series data; β is the vector of regression coefficient; intercept term is C i i, among it C is
constant, i measures the differences of individuals,
i
measures differences of time i t, is stochastic error term and represents ignored impact of cross-sectional and time-varying factors in the model. According to different
[image:5.595.61.284.537.659.2]can be divided into three basic regression models: ordi-nary mixed regression model, fixed-effect model and random effect model.
As Panel Data possess two-dimensional characteristics of cross-section and time-series, the model specification directly determines the effectiveness of parameter esti-mation. Therefore, the test of estimation model specifica-tion is essential. We introduce individual fixed-effect test and Hausman test to judge and choose model from three
basic regression models. Test results are shown in Table
2.
Depend on test results, with significance level 1%, F test reject all the null hypothesis and accept all the alter-native hypothesis; so does the Hausman test. Therefore, the model specification in the paper is individual fixed- effect model.
5. The Measurement Results
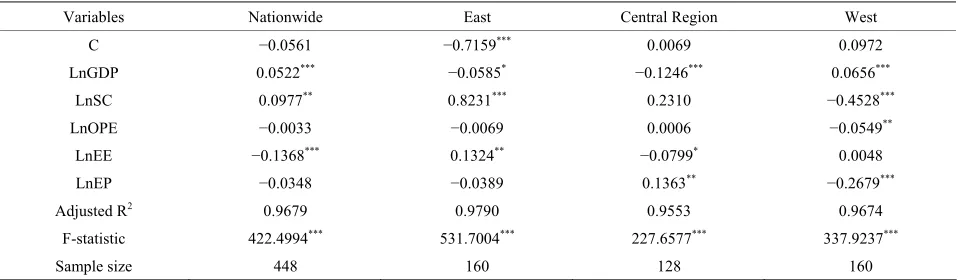
We should accept generalized least squares method to conduct regression analysis of model (5) in order to eli- minate heteroscedasticity and serial correlation that may exist in the panel data analysis. Then we establish indi-vidual fixed-effect model based on the panel data of na-tionwide, east, central region and west. Regression re-sults are shown in Table 3.
From Table 3, we obtain the following results:
1) Economic scale facilitates the increase of national and western regional pollution emissions. In the condi-tion of the other factors unchanged, when GDP increase by 1%, pollution emissions will increase by 0.05% from the national angle; from the western angle, the pollution
emissions will increase by 0.07% and is significantly higher than national level. Then the coefficient of east and central region is negative, indicating the pollution emissions of east and central region is gradually reducing with economic growth. In the condition of the other fac-tors unchanged, when GDP increase by 1%, from the eastern angle, pollution emissions will decrease by 0.06%; from the central regional angle, pollution emissions will decrease by 0.12%. Prior to 2020, China’s economy will maintain rapid growth. Therefore, the pollution emis-sions that result from economies of scale will be inevita-ble.
2) Industrial structure also exacerbates the increase of pollution emissions except that of west. The coefficient of central region do not pass the test with significance level 10%, indicating that industrial structure has an un-apparent effect on pollution emissions of central region. Meanwhile the coefficient of west is negative, from the angle of real situation, in the process of the industry transfer from east to west, western region has avoided the simple pollution transfer by the formulation of policy, and the pollution has been decreased. However, indus-trial structure of east and west has a negative effect on the decrease of pollution emissions. As the process of China’s industrialization won’t basically end until 2020, the increase of pollution emissions caused by industriali-zation tendency of industrial structure will be unavoid-able.
[image:6.595.60.537.492.534.2]3) Improving of trade openness is helpful to reduce pollution emissions except in east. However, only the coefficient of west passes the relevant significance test,
Table 2. Test results of model specification.
Nationwide East Central Region West
F-statistic 306.2644*** 187.0185*** 228.3487*** 285.9415***
Hausman test 56.3657*** 36.7642*** 106.3553*** 68.2051***
Note: ***, **, *denote that significance levels are 1%, 5% and 10%.
Table 3. Regression results of individual fixed-effect model about factors of environmental quality in 1995-2010.
Variables Nationwide East Central Region West
C −0.0561 −0.7159*** 0.0069 0.0972
LnGDP 0.0522*** −0.0585* −0.1246*** 0.0656***
LnSC 0.0977** 0.8231*** 0.2310 −0.4528***
LnOPE −0.0033 −0.0069 0.0006 −0.0549**
LnEE −0.1368*** 0.1324** −0.0799* 0.0048
LnEP −0.0348 −0.0389 0.1363** −0.2679***
Adjusted R2 0.9679 0.9790 0.9553 0.9674
F-statistic 422.4994*** 531.7004*** 227.6577*** 337.9237***
Sample size 448 160 128 160
Notes: 1) estimate model by cross-section weighting and calculate robust standard deviation by cross-section SUR (PSCE); 2) ***, **, *denote that significance
[image:6.595.59.538.573.713.2]trade openness promote rational allocation of resources in the world, which makes China’s industrial structure more reasonable and promote technological progress. In a word, the overall impact of trade openness on envi-ronment is favorable and “pollution haven hypothesis” isn’t obvious in China. However, as the result of global financial crisis, it is difficult to reduce pollution emis-sions by improving trade openness.
4) From the national angle, improving of energy effi-ciency contributes to reducing pollution emissions, and its coefficient test is significant, indicating the influence is significant. However, from the regional (east, central region and west) angle, since the development stages of east, that are different, the gap of technological progress among regions still exists. Therefore, improving energy efficiency is an effective way to reduce pollution emis-sions.
5) Rising energy prices significantly affect reducing pollution emissions of west, when energy prices rise by 1%, pollution emissions of west will reduce by 0.27%. In recent years, China’s reform in energy sector has achieved initial success, government regulation on energy prices has been gradually liberalized and some energy field has established market mechanism. However, due to the dif-ferent process of regional marketization and differences of energy resources endowment, east whose energy re-source is poor pay more attention to the relationship of input and output, when energy prices rise, these areas will make it possible to improve energy efficiency through resource allocation of market and substitution effect of technical progress.
6. Conclusions and Revelation
As single pollutant can hardly express the situation of environmental pollution, we propose a pollution emis-sions index that can reflect the level of environmental quality, measure China’s 28 provinces’ environmental quality from 1995 to 2010 with a dynamic objective evaluation method based on the overall differences first time, and test the impact factors on China’s and regional pollution emissions index by panel data model, we get the following conclusions.
1) China’s 28 provinces’ pollution emissions index that is measured by dynamic objective evaluation method based on the overall differences-vertical and horizontal scatter degree method is more scientific and realistic and has the vertical and horizontal comparability. It turns out that east and central region are the major regions of China’s pollution emissions, but that of central region is in a gradual downward trend; 28 provinces’ pollution emissions index is greatly different and it is huge poten-tial to reduce pollution emissions.
2) In terms of nationwide, energy efficiency, energy
prices and trade openness have a negative effect on pol-lution emissions index. However, the impact of each variable on each region is very different.
The above conclusions imply policy implications in-cluding: 1) In line with whole national interests, when formulating pollution emissions reduction policies, gov-ernments should not only focus on national situation but also the actual situation of each region’s development to develop different policies due to different regions; 2) It is the key links of reducing pollution emissions to improve energy efficiency and deepen market-oriented reforms of energy prices by straightening out property right system of resources and environment, cultivating property right trading market of resources and environment, rising the relative price and cost of energy, and gradually build pricing mechanism that can reflect resource scarcity, the relationship of market supply and demand and environ-mental costs, which can provide effective and lasting incentive to reduce pollution emissions.
REFERENCES
[1] H. Hettige, M. Mani and D. Wheeler, “Industrial Pollu-tion in Economic Development: The Environmental Kuznets Curve Revisited,” Journal of Development Eco-nomics, Vol. 62, No. 2, 2000, pp. 445-476.
doi:10.1016/S0304-3878(00)00092-4
[2] Z. X. Zhang, “Decoupling China’s Carbon Emissions Increase from Economic Growth: An Economic Analysis and Policy Implications,” World Development, Vol. 28, No. 4, 2000, pp. 739-752.
doi:10.1016/S0305-750X(99)00154-0
[3] W. Antweiler, B. R. Copel and M. S. Taylor, “Is Free Trade Good for the Environment,” American Economic Review, Vol. 91, No. 4, 2001, pp. 877-908.
doi:10.1257/aer.91.4.877
[4] D. I. Stern, “Explaining Changes in Global Sulfur Emis-sions: An Econometric Decomposition Approach,” Eco-logical Economics, Vol. 42, No. 1, 2002, pp. 201-220.
doi:10.1016/S0921-8009(02)00050-2
[5] S. Dinda, “Environmental Kuznets Curve Hypothesis: A Survey,” Ecological Economics, Vol. 49, No. 4, 2004, pp. 431-455.doi:10.1016/j.ecolecon.2004.02.011
[6] F. X. Yang, H. L. Nie and M. Yang, “Analysis of Envi-ronmental Effects of Economic Development in China —Empirical Research Based on the Generalized Impulse Response Function,” Finance and Economic Research, Vol. 36, No. 50, 2010, pp. 133-143.
[7] F. X. Yang, H. F. Ding and P. Y. Li, “The Patterns and Features Analysis of the Regional Pollution in China,” Economic Geography, Vol. 30, No. 3, 2010, pp. 501-507. [8] J.-S. Wang and C. F. He, “Energy Consumption, Eco-nomic Growth and the Changes of Carbon Dioxide Emis-sions,” Resources and Environment of the Yangtze Basin, Vol. 19, No. 1, 2010, pp. 18-23.
Province in China,” Economics, Vol. 9, No. 2, 2010, pp. 415-446.
[10] G. Z. Li, J. R. Jiang and C. Y. Zhou, “The Analysis of China’s Environmental Pollution Factors During the Transition Period—Based on the Perspective of Total Factor Energy Efficiency,” Journal of Shanxi Finance and Economics University, Vol. 31, No. 2, 2009, pp. 32- 39.
[11] Z. X. He and S. C. Xu, “An Empirical Study on the Im-pact of China’s Economic Opening up on the Environ-ment: 1997-2007,” Journal of International Trade, No. 10, 2009, pp. 87-93.
[12] M. X. Yu and M. L. Zhou, “Dynamic Trends and Factors of Environmental Pollution of Each Province in China,” Journal of Beijing Institute of Technology, Vol. 11, No. 4, 2009, pp. 46-49.
[13] B. Q. Lin and Z. J. Jiang, “Forecast and Factors of China’s Carbon Kuznets Curve,” Management World, No. 4, 2009, pp. 27-36.
[14] W. P. Yang and X. L. Yuan, “Analysis of the Impact of FDI on Environmental Pollution—Based on the Impulse Response Function Analysis of China’s Time Series,” World Economy Study, No. 12, 2008, pp. 62-68.
[15] F. Yu, J. G. Qi and X. L. Tian, “The Empirical Analysis of the Impact of Economic Development on Environ-mental Quality—Based on the Panel Data of All the China’s Provinces and Cities in 1994-2004,” China In-dustrial Economics, No. 8, 2006, pp. 36-44.
[16] G. M. Grossman and A. B. Krueger “Environmental Im-pacts of a North American Free Trade Agreement,”
Na-tional Bureau of Economic Research Working Paper, Cambridge, 1991.
[17] X. Q. Wang and F. Li, “The Relationship of Economic Growth and Environmental Pollution Levels in Tianjin,” Geographical Research, Vol. 24, No. 6, 2005, pp. 834- 842.
[18] F. Shen, “The Relationship of Economic Growth and Environmental Pollution in Shanghai—Based on the Em-pirical Analysis of Environmental Kuznets Theory,” Fi-nance and Economic Research, Vol. 34, No. 9, 2008, pp. 81-90.
[19] W. P. Yang and X. L. Yuan, “The Empirical Study of the Environmental Kuznets Hypothesis in China,” Resources and Environment of the Yangtze Basin, Vol. 18, No. 8, 2009, pp. 704-710.
[20] L. Yang and X. Z. Hu, “Regional Differences and Con-vergence Analysis of Green Economic Efficiency in China Based on DEA,” Economists, No. 2, 2010, pp. 46- 54.
[21] N. Shen, “Regional Spatial Analysis of Energy Inputs, Pollution Emissions and the Efficiency of Energy Econ-omy in China,” Finance & Trade Economics, No. 1, 2010, pp. 107-113.
[22] Y. J. Guo, “Comprehensive Evaluation Theory, Methods and Applications,” Science Press, Beijing, 2007.