http://www.scirp.org/journal/ojs ISSN Online: 2161-7198
ISSN Print: 2161-718X
Microarray Analysis Using Rank Order
Statistics for ARCH Residual Empirical Process
Hiroko Kato Solvang
1*, Masanobu Taniguchi
21Marine Mammals Research Group, Institute of Marine Research, Bergen, Norway 2Deparment of Applied Mathematics, Waseda University, Tokyo, Japan
Abstract
Statistical two-group comparisons are widely used to identify the significant differentially expressed (DE) signatures against a therapy response for micro-array data analysis. We applied a rank order statistics based on an Autoregres-sive Conditional Heteroskedasticity (ARCH) residual empirical process to DE analysis. This approach was considered for simulation data and publicly available datasets, and was compared with two-group comparison by original data and Auto-regressive (AR) residual. The significant DE genes by the ARCH and AR residuals were reduced by about 20% - 30% to these genes by the original data. Almost 100% of the genes by ARCH are covered by the genes by the original data unlike the genes by AR residuals. GO enrichment and Pathway analyses indicate the consistent biological characteristics between genes by ARCH siduals and original data. ARCH residuals array data might contribute to re-fining the number of significant DE genes to detect the biological feature as well as ordinal microarray data.
Keywords
Time Series Model, ARCH, Wilcoxon Statistic, Volatility, Deferentially Expressed Gene Signatures, Two-Group Comparison, Breast
Cancer GEO, Genome-Wide Expression Profiling, GO Analysis
1. Introduction
Microarray technology provides a high-throughput way to simultaneously inves-tigate gene expression information in a whole genome level. In the field of can-cer research, the genome-wide expression profiling of tumors has become an important tool to identify gene sets and signatures that can be used as clinical endpoints, such as survival and therapy response [1]. When we are contrasting expressions between different groups or conditions (i.e., the response
ispoly-How to cite this paper: Solvang, H.K. and Taniguchi, M. (2017) Microarray Analysis Using Rank Order Statistics for ARCH Residual Empirical Process. Open Journal of Statistics, 7, 54-71.
https://doi.org/10.4236/ojs.2017.71005
Received: October 20, 2016 Accepted: February 17, 2017 Published: February 20, 2017
Copyright © 2017 by authors and Scientific Research Publishing Inc. This work is licensed under the Creative Commons Attribution International License (CC BY 4.0).
http://creativecommons.org/licenses/by/4.0/
tumous), such important genes are described as differentially expressed (DE) [2]. To identify important genes, a statistical scheme is required that measures and captures evidence for a DE per gene. If the response consists of binary data, the DE is measured using a two-group comparison for which such statistical methods as t-statistics, the statistical analysis of microarray (SAM) [3]), fold change, and
B statistics have been proposed [4]. The p-value of the statistics is calculated to assess the significance of the DE genes. The p-value per gene is ranked in as-cending order; however, selecting significant genes must be considered by mul-tiple testing corrections, e.g., false discovery rate (FDR) [5], to avoid type I errors. Even if significant DE genes are identified by the FDR procedure, the gene list may still include too many to apply a statistical test for a substantial number of probes through whole genomic locations. Such a long list of significant DE genes complicates capturing gene signatures that should provide the availability of ro-bust clinical and pathological prognostic and predictive factors to guide patient decision-making and the selection of treatment options.
To investigate whether ARCH residuals can consistently refine a list of sig-nificant DE genes, we apply publicly available datasets called Affy947 [12] for breast cancer research to compare significant gene signatures. As a statistical test for two-group comparisons, the estrogen receptor (ER) is applied in clinical out-comes to identify prognostic gene expression signatures. Estrogen is an impor-tant regulator of the development, the growth, and the differentiation of normal mammary glands. It is well documented that endogenous estrogen plays a major role in the development and progression of breast cancer. ER expression in breast tumors is frequently used to group breast cancer patients in clinical set-tings, both as a prognostic indicator and to predict the likelihood of response to treatment with antiestrogen [13]. If the cancer is ER+, hormone therapy using medication slows or stops the growth of breast cancer cells. If the cancer is ER-, then hormonal therapy is unlikely to succeed. Based on these two categorical factors for ER status, we applied our proposed statistical test to the expression levels for each genomic location. After identifying significant DE genes, biologi-cal enrichment analyses use the gene list and seek biologibiologi-cal processes and in-terconnected pathways. These analyses support the consistency for refined gene lists obtained by ARCH residuals.
2. Method
Denote the sample and the genomic location by i and j in microarray data
ij
x . The samples for the microarray data are divided by two biological different groups, one group is for breast cancer tumors driven by ER + and another group is for breast cancer tumors driven by ER−. We apply the two-group comparison testing to identify significant different expression level between two groups of ER+ and ER− samples for each gene (genomic location). As the statistical test, we propose the rank order statistics for ARCH residual empirical process intro-duced in 2.1. For comparisons with the ARCH model’s performance, we consid-er applying the two-group comparison testing to original array data and apply-ing the test to the residuals obtained by ordinal AR (autoregressive) model. The details about both methods are summarized in 2.2. For the obtained significant DE gene lists, biologists or medical scientists require further analysis for their biological interpretation to investigate the biological process or biological net-work. In this article, we apply GO (gene ontology) analysis shown in 2.3 and Pathway analysis shown in 2.4, which methods are generally used to investigate specific genes or relationships among gene groups.
2.1. The Rank Order Statistic for ARCH Residual Empirical
Process
Suppose that a classes of ARCH (p) models is generated by the following equa-tions
( )
2( )
0 21
, for 1, ,
0, for 1, , 0 X
p i t X t t X X i X t i t
X
X t m
X
t p
σ θ ε σ θ θ = θ −
= + =
=
= − +
∑
where
{ }
εt is a sequence of i.i.d.(0,1) random variables with fourth-order cumulant 4X
κ ,
(
0 1)
1, , , pX pX
X X X X X
θ = θ θ θ ′∈ Θ ⊂ + is an unknown parameter
vector satisfying 0 0
X
θ > , θXi ≥0, i=1,,pX −1, X 0 p X
θ > , and
ε
t is inde-pendent of Xs,s t
<
. Denote by F x( )
the distribution function of2 t ε and we assume that f x
( )
=F′( )
x exists and is continuous on(
0,∞)
.Suppose that another class of ARCH(p) models, independent of
{ }
Xt , is generated similarly by the equations( )
2( )
0 21
, for 1, ,
0, for 1, , 0 Y
p i t Y t t Y Y i Y t i t
Y
Y t m
Y
t p
σ θ ξ σ θ θ =θ −
= + = = = − +
∑
(2.1.2)
where
{ }
ξt is a sequence of i.i.d. (0,1) random variables with fourth-order cumulant 4Y
κ ,
(
0, 1, , pY)
pY 1Y Y Y Y Y
θ = θ θ θ ′∈ Θ ⊂ + is an unknown parameter
vector satisfying 0 0
Y
θ > , i 0
Y
θ ≥ , i=1,,pY −1, Y 0 p Y
θ > , and
ξ
t is inde-pendent of Ys,s t
<
. The distribution function of2 t
ξ is denoted by G x
( )
and we assume that g x( )
=G′( )
x exists and is continuous on(
0,∞)
. For (2.1.1)and (2.1.2), we assume that 1
1 X p
X X
θ ++θ < and 1
1 Y p
Y Y
θ ++θ < for sta-tionarity (see [14]).
Now we are interested in the two-sample problem of testing
( )
( )
( )
( )
0: for all agains A: for some .
H F x =G x x t H F x ≠G x x
In this article, F x
( )
and G x( )
correspond to the distribution for theex-pression data of samples driven by ER+ and ER−, individually.
For this testing problem, we consider a class of rank order statistics including, such as Wilcoxon’s two-sample test. The form is derived from the empirical re-siduals 2 2 2
( )
ˆˆt Xt t X , 1,t ,n
ε
=σ θ
= and ˆ2 2 2( )
ˆ , 1, ,t Yt t Y t n
ξ
=σ θ
= .Be-cause Lee and Taniguchi [11] developed the asymptotic theory for not squared empirical residuals, we may apply the results to
ε
ˆt and ˆt ξ .
2.2. Two-Group Comparison for Microarray Data
To obtain the empirical residuals as mentioned in 2.1, the ARCH model is ap-plied to a vector
{
xi1,xi2,,xiL}
for the ith sample, whereL
is the total number of genomic locations in the microarray data. Assuming that the ER+ and ER− samples correspond to distributions F x( )
and G x( )
as shown in2.1, orders pX and pY of the ARCH model are identified by model selection using the Akaike Information Criterion (AIC), where the model with the mini-mum AIC is defined as the best fit model [15] (see 1. in Figure 1). According to those responses, the empirical residuals are grouped as
ε
ij+
and
ξ
ij−
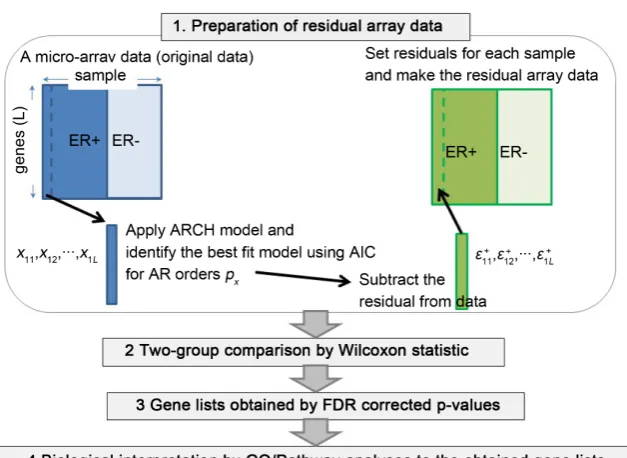
. Wilcoxon statistic is applied as order statistic to those two groups for each genomic loca-tion j, and the p-value is calculated (see 2. in Figure 1). The p-values obtained for all genes are adjusted for multiple testing corrections using false discovery rate (FDR) [5] (see 3. in Figure 1).
Figure 1. Complete proposed algorithm.
value using the weighted average of the past values as 1
K
ij k i ij k ij
x =
∑
=β
x− +w , where βi, k, and wij are the AR coefficient, the AR order, and the error terms. The AR model is widely applied in time series analysis and the signal processing of economics, engineering, and science. In this article, we apply it to the expres-sion data for two ER+ and ER− groups. The AR order for the best fit model is identified by AIC. Empirical residualsw
ij+
for ER+ and
w
ij−
for ER− are sub-tracted from the data by predictions.
These procedures are finally summarized as follows: 1) take the original mi-croarray and the clinical data for ER from one study cohort; 2) apply the ARCH and AR models to the original data for each sample and identify the best fit model among the model candidates within 1 - 10 time lags; 3) subtract the resi-duals from the data by the prediction for the best fit model; 4) apply Wilcoxon statistic to the original data and to the empirical residuals by ARCH and AR; 5) list the p-values and identify the significant FDR (5%) corrected genes. 6) apply Gene Ontology analysis and pathway analysis (see the details in 2.3 and 2.4) for biological interpretation to the obtained gene list (see 4. in Figure 1).
The computational programs were done by the garchFit function (in “fGARCH”) for ARCH fitting, by the ar.ols function for AR fitting, the wilcox.test as a rank- sum test, and fdr.R for the FDR adjustment in the R package.
2.3. GO Analysis
func-tional enrichment tools and is highly regarded both for its comprehensiveness and its unified approach for annotating genes in different species to the same basic set of underlying functions [16]. Many tools have been developed to ex-plore, filter, and search the GO database. In our study, Gorilla [17] was used as a GO analysis tool. GOrilla is an efficient web-based interactive user interface that is based on a statistical framework called minimum hypergenometric (mHG) for enrichment analysis in ranked gene lists, which are naturally represented as functional genomic information. For each GO term, the method independently identifies the threshold at which the most significant enrichment is obtained. The significant mHG scores are accurately and tightly corrected for threshold multiple testing without time-consuming simulations [17]. The tool identifies enriched GO terms in ranked gene lists for background gene sets which are ob-tained by the whole genomic location of microarray data. GO consists of three hierarchically structured vocabularies (ontologies) that describe gene products in terms of their associated biological processes, cellular components, and mo-lecular functions. The building blocks of GO are called terms, and the relation-ship among them can be described by a directed acyclic graph (DAG), which is a hierarchy where each gene product may be annotated to one or more terms in each ontology [16]. GOrilla requires a list of gene symbols as input data. The obtained significant Etrez gene lists by FDR correction are converted into gene symbols using a web-based database called SOURCE [18], which was developed by the Genetics Department of Stanford University.
2.4. Pathway Analysis
As well as for GO analysis, the identified genes are mapped to the well-defined- biological pathways. Pathway analysis determines which pathways are overre-presented among genes that present significant variations. The difference from GO analysis is that pathway analysis includes interactions among a given set of genes. Several tools for pathway analysis have been published. In this study, we used a web-based analysis tool called REACTOME, which is a manually curated open-source open-data resource of human pathways and reactions [19]. REAC- TOME is a recent fast and sophisticated tool that has grown to include annota-tions for 7088 of the 20,774 protein-coding genes in the current Ensembl human genome assembly, 15,107 literature references, and 1421 small molecules orga-nized into 6744 reactions collected in 1481 pathways [19].
3. Simulation Study
data generating different normal distribution with 1.8 mean and 10 variance; another array data (B) was generated by ARCH model. The model was applied to real array (DES data, see the detail in Section 4) and the parameters (mu: the intercept, omega: the constant coefficient of the variance equation, alpha: the coefficients of the variance equation, skew: the skewness of the data, shape: the shape parameter of the conditional distribution setting as 3) for the model was estimated for ER+ and ER−, respectively. We used these parameters and random number to generate the simulation data. For the computational programs, we conducted normrnd of Matlab command to generate random variables by
nor-mal distributions for array data A, and conducted garchSim of the R package
fGARCH for array data B. We iterated 100 times to generate the two array data sets. To 100 data sets for A and B, we applied two-group comparison for the original simulation data and the ARCH residuals of them and identify 5% FDR significant parts.
4. Material
Due to the extensive usage of microarray technology, in recent years publicly available datasets have exploded [4], including the Gene Expression Omnibus (GEO, http://www.ncbi.nlm.nih.gov/geo/) [20] and Array Express
(https://www.ebi.ac.uk/arrayexpress/). In this study for breast cancer research, we
used five different expression datasets, collectively called the Affy947 expression dataset [12]. These datasets, which all measure the Human Genome HG U133A Affymetrix arrays, are normalized using the same protocol and are assessable from GEO with the following identifiers: GSE6532 for the Loi et al. dataset [21] (Loi), GSE3494 for the Miller et al. dataset [22] (Mil), GSE7390 for the Desmedt
et al. dataset [23] (Des), and GSE5327 for the Minn et al. dataset [24] (Min). The Chine et al. dataset [25] (Chin) is available from ArrayExpress. This pooled da-taset was preprocessed and normalized, as described in Zhao et al. [26]. Micro-array quality-quality-control assessment was carried out using the R AffyPLM package from the Bioconductor web site
(http://www.bioconductor.org[27]). The Relative Log Expression (RLE) and Normalized Unscaled Standard Errors (NUSE) tests were applied. Chip pseu-do-images were produced to assess artifacts on the arrays that did not pass the preceding quality control tests. The selected arrays were normalized by a three- step procedure using the RMA expression measure algorithm
(http://www.bioconductor.org [28]): RMA background correction convolution, the median centering of each gene separately across arrays for each dataset, and the quantile normalization of all arrays. Gene mean centering effectively re-moves many dataset specific biases, allowing for effective integration of multiple datasets [29]. 22,268 is the total number of probes for these microarray data.
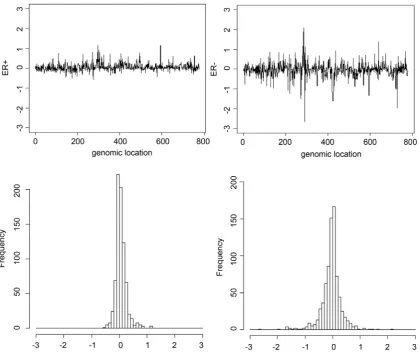
in the R codes in Zhao et al. [26]. As the response contrasting expression be-tween two groups, we used a hormone receptor called ER, which indicates whether a hormone drug works as well for treatment as a progesterone receptor and is critical to determine the prognosis and predictive factors. ERsare used for classi-fying breast tumors into ER-positive (ER+) and ER-negative (ER−) diseases. The two upper figures in Figure 2 present the mean of the microarray data by aver-aging all of the previously obtained samples [23]. The left and right plots cor-respond to a sample indicating ER+ and ER−. The data for ER− show more fluc-tuation than for ER+. The two lower figures illustrate histograms of the averaged data for ER+ and ER− and present sharper peakedness and heavier tails than the shape of an ordinary Gaussian distribution.
5. Results and Discussion
5.1. Simulation Data
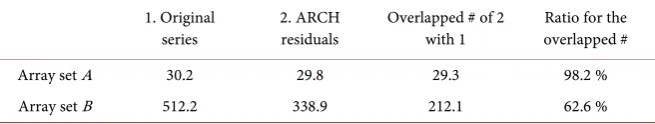
[image:8.595.113.534.348.701.2]For the simulation data and ARCH residuals, we summarized the average of the number of the identified 5% FDR significant parts and the number of the over-lapped parts in Table 1. In the case of the simulation data generated by normal
Figure 2. Upper figures: mean of expression levels for ER+ (left) and ER− (right) across all Des samples. Lower
Table 1. Summary of the average for the identified significant parts.
1. Original
series 2. ARCH residuals Overlapped # of 2 with 1 overlapped # Ratio for the
Array set A 30.2 29.8 29.3 98.2 %
Array set B 512.2 338.9 212.1 62.6 %
distribution, the significant number for original series and ARCH residuals in array sets A and B was not differ. The parts identified in A were mostly same as ones in B. On the other hand, in the simulation data generated by ARCH model, the ARCH residuals identified more significant parts from the data than the original series. The number of significant parts for ARCH residuals was about 30% less than the number of significant parts for the original series. The over-lapped number was less than the case A, however over 50% parts were covered.
5.2. Affy947 Expression Dataset
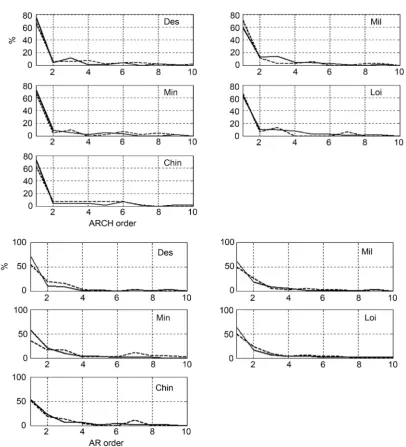
Based on the method explained in 3.2, the best fit AR and GARCH models were selected by AIC for each sample. The estimated orders of all the best fit models of all the studies are summarized in Supplementary Table 1. Figure 3 summa-rizes the ratio of the sample numbers for each selected order against the total number of samples. These figures suggest that the most often selected orders were one while ER+ samples tended to take more complicated models than for the ER− samples.
Figure 3. Selected model’s orders. Five upper panels indicate GARCH results. Five lower panels indicate AR results. Vertical and horizontal axes indicate percentage of selected order toward total sample numbers and model’s order. Solid and broken lines correspond to ER− and ER+ samples.
similar structure as the ARCH process and empirical ARCH residuals might be more effective to specify important genes from a list of long genes than AR resi-duals.
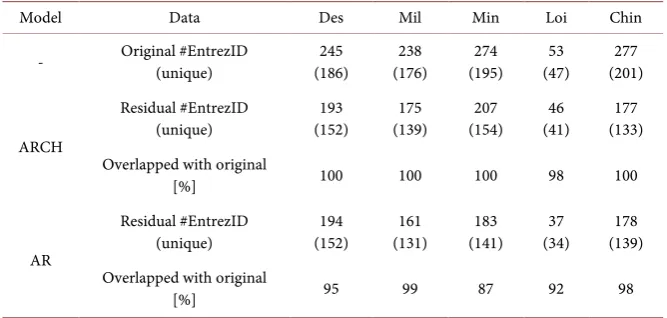
[image:10.595.360.539.75.216.2]Table 2. Summary for FDR 5% adjusted Entrez genes of five datasets. Values in paren-theses indicate number of unique genes to avoid duplicate and multiple genes from ob-tained gene list. Percentages for overlapped with original indicate ratios for overlapped significant genes for ARCH or AR residuals with significant genes in original data.
Model Data Des Mil Min Loi Chin
- Original #EntrezID (unique) (186) 245 (176) 238 (195) 274 (47) 53 (201) 277
ARCH
Residual #EntrezID
(unique) (152) 193 (139) 175 (154) 207 (41) 46 (133) 177 Overlapped with original
[%] 100 100 100 98 100
AR
Residual #EntrezID
(unique) (152) 194 (131) 161 (141) 183 (34) 37 (139) 178 Overlapped with original
[%] 95 99 87 92 98
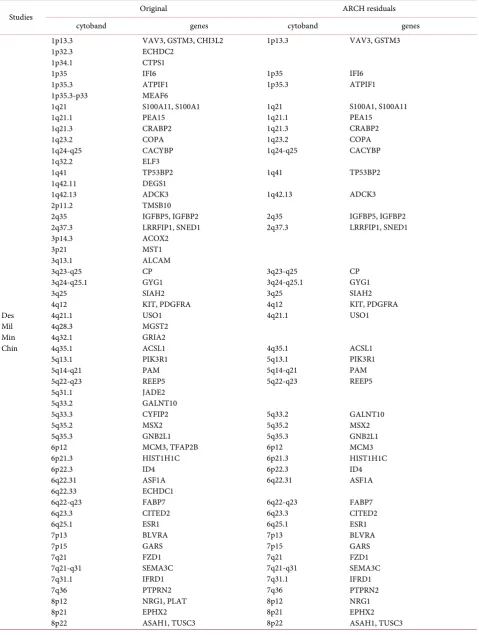
chromosome 1q region, ERBB2 in the chromosome 17q region, and ESR1 in the chromosome 6q region, even if the number of identified Entrez genes was less than the number of identified genes from the original data.
Next, we performed GO enrichment analysis using significant DE gene lists for the original data and ARCH’s residual analyses in all studies. To correctly find the enriched GO terms for the associated genes, a background list was pre-pared of all the probes included in the original microarray data. The Entrez genes in the background list were converted into 13,177 gene symbols without any duplication by SOURCE. As the input gene lists to GOrilla, the numbers of summarized unique genes are shown in the parentheses of Table 2. All the asso-ciated GO terms for the original and ARCH residuals in all the studies are sum-marized in Supplementary Table 3. Since the estimated gene symbols in Loi’s case were less than half of the amount taken in other studies, few associated GO terms were identified in the biological process and cellular component and no GO terms in the molecular function. Also, significant DE genes for the ARCH residuals contributed to finding additional associated GO terms that did not ap-pear in the GO terms for the original data, e.g., mammary gland epithelial cell proliferation for Des, a single-organism metabolic process for Des, an organoni-trogen compound metabolic process for Mil and Min, and a single-organism de-velopmental process for Min and Chin, all of which are related to meaningful bi-ological associations like cellular differentiation, proliferation, and metabolic path-ways in cancer cells [16]. Table 3 summarizes the common GO terms of the biological processes for Des, Mil, Min, and Chin and presented 13 terms for the original data. The terms for the ARCH residuals mostly overlapped with them except for Mil’s case. As shown in Supplementary Table 3, two terms in the molecular function and eight in the cellular components were commonly identi-fied by the original data. The GO terms for the ARCH residuals covered them, and more terms were shown in the molecular function.
Table 3. Identified differentially expressed genes (FDR 5%) and cytobands for ER status in original data and empirical ARCH residuals.
Studies Original ARCH residuals
cytoband genes cytoband genes
Des Mil Min Chin 1p13.3 1p32.3 1p34.1 1p35 1p35.3 1p35.3-p33 1q21 1q21.1 1q21.3 1q23.2 1q24-q25 1q32.2 1q41 1q42.11 1q42.13 2p11.2 2q35 2q37.3 3p14.3 3p21 3q13.1 3q23-q25 3q24-q25.1 3q25 4q12 4q21.1 4q28.3 4q32.1 4q35.1 5q13.1 5q14-q21 5q22-q23 5q31.1 5q33.2 5q33.3 5q35.2 5q35.3 6p12 6p21.3 6p22.3 6q22.31 6q22.33 6q22-q23 6q23.3 6q25.1 7p13 7p15 7q21 7q21-q31 7q31.1 7q36 8p12 8p21 8p22
Continued Des Mil Min Chin 8q21.1 8q22 8q22.1 8q24.1 8q24.12 9q33.3 9q34.1 9q34.11 10p15 10q24 11p12-p11 11p15 11q11-q12 11q12.3 11q13 11q14.1 12p13 12q12 12q13 12q13.12 12q14 12q14.1 12q24.21 13q12 13q21.1-q32 13q22.2 13q31.2-q32.3 13q33 14q11.2 15q24 15q24.2 15q26.3 16p12.2 16p13.3 16q13 16q22.1 16q24.3 17p11.2 17q11.2 17q11.2-q12 17q11-q12 17q12 17q21.2 17q21.31 17q24-q25 18p11.3 18q21.1 18q22-q23 18q23 19p13.3 19p13.3-p13.2 19q13.2 19q13.3 19q13.4 20p11.21 21q21.1 22q11.2 22q13.1 Xp21.3 PEX2 CA2 LAPTM4B SQLE TRPS1 RALGPS1 CRAT SPTAN1 GATA3
PDCD4, MYOF, PAPSS2 EXT2 RPL27A TCN1 PLA2G16 NUMA1 RSF1 PTMS, SCNN1A TWF1 STAT6, SLC11A2 FKBP11 GNS PPM1H MED13L FLT1 CLN5 LMO7 STK24 EFNB2 MMP14 CIB2 COMMD4 IGF1R POLR3E HCFC1R1 ARL2BP CDH1 PIEZO1 ALDH3A2, PEMT FAM222B, CCL18 LIG3 FLOT2 ERBB2 KRT17 ACBD4 CDC42EP4 RAB31 ACAA2 ZNF236 CYB5A KDM4B EPOR CYP2A6 CA11, ARHGAP35 PEG3 ENTPD6 BTG3 IGL POLR2F, H1F0 ZFX 8q22 8q22.1 8q24.12 9q34.1 10p15 10q24 11p12-p11 11p15 11q11-q12 11q12.3 11q13 11q14.1 12p13 12q12 12q13 12q13.12 12q14 12q14.1 12q24.21 13q12 13q21.1-q32 13q22.2 13q33 15q26.3 16p12.2 16p13.3 16q13 16q24.3 17p11.2 17q11.2 17q11.2-q12 17q11-q12 17q12 17q24-q25 18q21.1 18q22-q23 18q23 19p13.3 19q13.2 19q13.3 19q13.4 20p11.21 21q21.1 22q11.2 22q13.1 CA2 LAPTM4B TRPS1 CRAT GATA3
Continued Des Mil Min Chin
Xp22.1 SAT1
Xq26.3 VGLL1 Xq26.3 VGLL1
+Loi
1p13.3 CHI3L2
1q24-q25 CACYBP 1q24-q25 CACYBP
2q35 IGFBP5 2q35 IGFBP5
3p21 3p21
5q35.2 MSX2
7p13 BLVRA 7p13 BLVRA
10q24 PDCD4, MYOF 10q24 PDCD4, MYOF
17q11.2 CCL18
17q24-q25 17q24-q25 CDC42EP4
19p13.3-p13.2 EPOR 19p13.3-p13.2 EPOR
21q21.1 BTG3 BTG3
22q11.2 IGL 21q21.1 IGL
Xp22.1 SAT1 22q11.2
[image:14.595.59.537.83.299.2]lists, we applied pathway analysis to the significant DE genes for the original and ARCH residuals listed in Table 4. All the identified pathways with Entities FDR (<1.0) and associated genes are summarized in SupplementaryTable 4. In the pathway components shown in SupplementaryTable 3, ERBB2 signaling, EGFR, cell-cycle, immune system, metabolic pathway, AKT signaling and Wnt path-way are well- known important breast cancer-signaling pathpath-ways [31]. We took them to be representative of important pathways and counted the number of identified pathways related to these components in the case of the original and ARCH residuals. The number and associated gene symbols are summarized in Table 5. The representative pathways were mostly covered by the significant DE genes for the ARCH residuals. This result supports that the refined gene lists obtained by the ARCH residuals generally captured the differentiating breast tumors based on ER status and did not overlook any important biological in-formation by the limited DE gene lists for the ARCH residuals.
6. Conclusion
Table 4. Common associated biological processes among Des, Mil, Min, and Chin for original and ARCH residuals.
Associated GO terms Des Mil Min Chin
Orig Arch Orig Arch Orig Arch Orig Arch
Bio
lo
gic
al Pr
oc
es
s
epithelial cell proliferation + + + + + + + +
response to estrogen + + + + + + + +
epidermis development + + + + + +
regulation of phosphatidylinositol
3-kinase activity + + + + + + +
erythropoietin-mediated signaling pathway + + + + + + regulation of lipid kinase activity + + + + + + + + phosphatidylinositol 3-kinase signaling + + + + + + + +
positive regulation of
phosphatidylinositol 3-kinase activity + + + + + + + + phenylpropanoid catabolic process + + + + + + + +
mast cell differentiation + + + + + + + +
extracellular vesicle + + + + + + +
extracellular vesicular exosome + + + + + + +
extracellular region part + + + + + + +
Table 5. Identified important breast cancer-signaling pathways and associated gene
symbols obtained from original data and ARCH residuals.
Pathways Original ARCH residuals
Number Gene symbol Number Gene symbol
ERBB2 signaling 7 ERBB2, KIT, NRG1 6 ERBB2
EGFR pathways 11 PIK3R1, VAV3 FLT1, KIT, 10 ERBB2, FLT1, PIK3R1
Cell cycle 5 CDH1, MCM3 3 MCM3, NUMA1
Immune system 5 PIK3R1, STAT6 CDH1, KIT, 5 ERBB2, IFI6, STAT6
Metabolic disorder 1 SAT1 1 FZD1
PI3K/AKT signaling 5 KIT, PIK3R1 5 ERBB2, PIK3R1
Wnt pathway 5 FZD1 5 FZD1
analysis and presented additional important GO terms in biological processes. These results suggest that data processing using ARCH residuals array data could contribute to refining significant DE genes that follow the required gene signa-tures and provide prognostic accuracy and guide clinical decisions.
Acknowledgements
and Funding
[image:15.595.209.536.102.374.2] [image:15.595.208.539.416.600.2]Competing Interest
The authors declare no competing interests.
References
[1] Zhao, X., Rødland, E.A., Sørlie, T., Naume, B., Langerød, A., Frigessi, A., Kristen-sen, V.N., Børresen-Dale, A.L. and Lingjærde, O.C. (2011) Combining Gene Signa-tures Improves Prediction of Breast Cancer Survival. PLoS ONE, 6.
[2] Yang, Y.H., Xiao, Y. and Segal, M.R. (2005) Identifying Differentially Expressed Genes from Microarray Experiments via Statistics Synthesis. Bioinformatics, 21, 1084-1093. https://doi.org/10.1093/bioinformatics/bti108
[3] Tusher, V.G., Tibshirani, R. and Chu, G. (2001) Significance Analysis of Microar-rays Applied to the Ionizing Radiation Response. Proceedings of the National Acade-my of Sciences, 98, 5116-5121. https://doi.org/10.1073/pnas.091062498
[4] Campain, A. and Yang, Y.H. (2010) Comparison Study of Microarray Meta-Analysis Methods. BMC Bioinformatics, 11, 408. https://doi.org/10.1186/1471-2105-11-408
[5] Benjamini, Y. and Hockberg, Y. (1995) Controlling the False Discovery Rate: A Practical and Powerful Approach to Multiple Testing. Journal of the Royal Statistic-al Society B, 57, 289-300.
[6] Engle, R.F. (1982) Autoregressive Conditional Heteroskedasticity with Estimates of the Variance of UK Inflation. Econometrica, 50, 987-1008.
https://doi.org/10.2307/1912773
[7] Chandra, S.A. and Taniguchi, M. (2003) Asymptotics of Rank Order Statistics for ARCH Residual Empirical Processes. Stochastic Processes and Their Applications, 104, 301-324. https://doi.org/10.1016/S0304-4149(02)00239-9
[8] Ozaki, T. and Iino, M. (2001) An Innovation Approach to Non-Gaussian Time Se-ries Analysis. Journal of Applied Probability, 38A, 78-92.
https://doi.org/10.1017/S0021900200112690
[9] Stoffer, D.S., Tyler, D.E. and Wendt, D.A. (2000) The Spectral Envelope and Its Ap-plications. Statistical Science, 15, 224-253. https://doi.org/10.1214/ss/1009212816
[10] Koren, A., Tirosh I. and Barki, N. (2007) Autocorrelation Analysis Reveals Wide-spread Spatial Biases in Microarray Experiments. BMC Genomics, 8, 164.
https://doi.org/10.1186/1471-2164-8-164
[11] Lee, S. and Taniguchi, M. (2005) Asymptotic Theory for ARCH-SM Models: LAN
and Residual Empirical Processes. Statistica Sinica, 15, 215-234.
[12] Van Vliet, M.H., Reyal, F., Horlings, H.M., van de Vijver, M.J., Reinders, M.J.T. and Wessels, L.F.A. (2010) Pooling Breast Cancer Datasets Has a Synergetic Effect on Classification Performance and Improves Signature Stability. BMC Genomics, 9, 375. https://doi.org/10.1186/1471-2164-9-375
[13] Rezaul, K., Thumar, J.K., Lundgren, D.H., Eng, J.K., Claffey, K.P., Wilson, L. and Han, D.K. (2010) Differential Protein Expression Profiles in Estrogen Receptor-Positive and -Negative Breast Cancer Tissues Using Label-Free Quantitative Proteomics. Genes Cancer, 1, 251-271. https://doi.org/10.1177/1947601910365896
[14] Milhøj, A. (1985) The Moment Structure of ARCH Processes. Scandinavian Journal of Statistics, 12, 281-292.
[15] Akaike, H. (1974) A New Look at the Statistical Model Identification. IEEE Trans-actions on Automatic Control, 19, 716-723.
https://doi.org/10.1109/TAC.1974.1100705
Method for Evaluating the Functional Properties of Gene Sets. Scientific Reports, 4, 4191. https://doi.org/10.1038/srep04191
[17] Eden, E., Navon, R., Steinfeld, I., Lipson, D. and Yakhini, Z. (2009) GOrilla: A Tool for Discovery and Visualization of Enriched GO Terms in Ranked Gene Lists. BMC Bioinformatics, 10, 48. https://doi.org/10.1186/1471-2105-10-48
[18] Deihn, M., Sherlock, G., Binkley, G., Jin, H., Matese, J.C., Hernandez-Boussard, T., Rees, C.A., Cherry, J.M., Botstein, D., Brown, P.O. and Alizadeh, A.A. (2003) SOURCE: A Unified Genomic Resource of Functional Annotations, Ontologies, and Gene Exrpression Data. Nucleic Acids Research, 31, 219-223.
http://source-search.princeton.edu/cgi-bin/source/sourceSearch
https://doi.org/10.1093/nar/gkg014
[19] Joshi-Tope, G., Gillespie, M., Vastrik, I., D’Eustachio, P., Schmidt, E., de Bono, B., Jassal, B., Gopinah, G.R., Wu, G.R., Matthews, L., Lewis, S., Birney, E. and Stein, L. (2005) Reactome: A Knowledgebase of Biological Pathways. Nucleic Acids Re-search, 1, D428-D432.
[20] Edgar, R., Domrachev, M. and Lash, A.E. (2002) Gene Expression Omnibus: NCBI Gene Expression and Hybridization Array Data Repository. Nucleic Acids Research, 30, 207-210. https://doi.org/10.1093/nar/30.1.207
[21] Loi, S., Haibe-Kains, B., Desmedt, C., Lallemand, F., Tutt, A.M., Gillet, C., Ellis, P., Harris, A., Bergh, J., Foekens, J.A., Klijn, J.G., Larsimont, D., Buyse, M., Botempi, G., Delorenzi, M., Piccart, M.J. and Sotiriou, C. (2007) Definition of Clinically Dis-tinct Molecular Subtypes in Estrogen Receptor-Positive Breast Carcinomas through Genomic Grade. Journal of Clinical Oncology, 25, 1239-1246.
https://doi.org/10.1200/JCO.2006.07.1522
[22] MillerL, D., Smeds, J., George, J., Vega, V.B., Vergara, L., Ploner, A., Pawitan, Y., Hall, P., Klaar, S., Liu, E.T. and Bergh, J. (2005) An Expression Signature for p53 Status in Human Breast Cancer Predicts Mutation Status, Transcriptional Effects, and Patient Survival. Proceedings of the National Academy of Sciences of the Unit-ed States of America, 102, 13550-13555. https://doi.org/10.1073/pnas.0506230102
[23] Desmedt, C., Piette, F., Loi, S., Wang, Y., Lallemand, F., Haibe-Kains, B., Delorenzi, M., d’Assignies, M.S., Bergh, J., Lidereau, R., Ellis, P., Harris, A.L., Klijn, J.G., Foe-kens, J.A., Cardoso, F., Piccart, M.J., Buyse, M. and Sotiriou, C. (2007) Strong Time Dependence of the 76-Gene Prognostic Signature for Node-Negative Breast Cancer Patients in the TRANSBIG Multicenter Independent Validation Series. Clinical Cancer Research, 13, 3207-3214. https://doi.org/10.1158/1078-0432.CCR-06-2765
[24] Minn, A.J., Gupta, G.P., Siegel, P.M., Bos, P.D., Shu, W., Giri, D.D., Viale, A., Ol-shen, A.B., Gerald, W.L. and Massaqué, J. (2005) Genes That Mediate Breast Cancer Metastasis to Lung. Nature, 436, 518-524. https://doi.org/10.1038/nature03799
[25] Chin, K., DeVries, S., Fridlyand, J., Spellman, P.T., Roydasgupta, R., Kuo, W.L., Lapuk, A., Neve, R.M., Qian, Z., Ryder, T., Chen, F., Feiler, H., Tokuyasu, T., Kingsley, C., Dairkee, S., Meng, Z., Chew, K., Pinkel, D., Jain, A., Ljung, B.M., Es-seman, L., Albertson, D.G., Waldman, F.M. and Gray, J.W. (2006) Genomic and Transcriptional Aberrations Linked to Breast Cancer Pathophysiologies. Cancer Cell, 10, 529-541. https://doi.org/10.1016/j.ccr.2006.10.009
[26] Zhao, X., Rødland, E.A., Sørlie, T., Vollan, H.K.M., Russnes, H.G., Kristensen, V.N., Lingjærde, O.C. and Børresen-Dale, A.L. (2014) Systematic Assessment of Prognstic Gene Signatures for Breast Cancer Shows Distinct Influence of Time and ER Status. BMC Cancer, 14, 211. https://doi.org/10.1186/1471-2407-14-211
Gentle-man, R., Carey, V., Huber, W., Irizarry, R. and Dudoit, S., Eds., Bioinformatics and Computational Biology Solutions Using R and Bioconductor Statistics for Biology and Health, Springer, Berlin, 33-47. https://doi.org/10.1007/0-387-29362-0_3
[28] Irizarry, R.A., Bolstad, B.M., Collin, F., Cope, L.M., Hobbs, B. and Speed, T.P. (2003) Summaries of Affymetrix Gene Chip Probe Level Data. Nucleic Acids Re-search, 31, e15. https://doi.org/10.1093/nar/gng015
[29] Sims, A.H., Smethurst, G.J., Hey, Y., Okoniewski, M.J., Pepper, S.D., Howell, A., Miller, C.J. and Clarke, R.B. (2008) The Removal of Multiplicative, Systematic Bias Allows Integration of Breast Cancer Gene Expression Datasets—Improving Meta- Analysis and Prediction of Prognosis. BMC Medical Genomics, 1, 42.
https://doi.org/10.1186/1755-8794-1-42
[30] Perou, C.M., Sørlie, T., Eisen, M.B., van de Rijn, M., Jeffrey, S.S., Rees, C.A., Pollack, J.R., Ross, D.T., Johnsen, H., Akslen, L.A., Fluge, O., Pergamenschikov, A., Wil-liams, C., Zhu, S.X., Lønning, P.E., Børresen-Dale, A.L., Brown, P.O. and Botstein, D. (2000) Molecular Portraits of Human Breast Tumours. Nature, 406, 747-752.
https://doi.org/10.1038/35021093
[31] Teschendorff, A.E., Journée, M., Absil, P.A., Sepulchre, R. and Caldas, C. (2007) Elucidating the Altered Transcriptional Programs in Breast Cancer Using Indepen-dent Component Analysis. PLoS Computational Biology, 3, e161.
https://doi.org/10.1371/journal.pcbi.0030161
Supplementary (see
https://www.dropbox.com/sh/sotz8jufje73eg6/AACKHD-tX
qB02h_rxlvVlXqsa?dl=0
)
Supplementary Table 1. Estimated order of all best fit models for each sample. Supplementary Table 2. Significant DE Entrez genes and gene symbols identi-fied by original data and ARCH residuals.
Submit or recommend next manuscript to SCIRP and we will provide best service for you:
Accepting pre-submission inquiries through Email, Facebook, LinkedIn, Twitter, etc. A wide selection of journals (inclusive of 9 subjects, more than 200 journals)
Providing 24-hour high-quality service User-friendly online submission system Fair and swift peer-review system
Efficient typesetting and proofreading procedure
Display of the result of downloads and visits, as well as the number of cited articles Maximum dissemination of your research work
Submit your manuscript at: http://papersubmission.scirp.org/