Design and Realization of Signal Processing Platform of
Multi-Parameter Wearable Medical Devices
Xin Tan, Binfeng Xu, Qiancheng Liu
Guangdong Food and Drug Vocational College, Guangzhou, China. Email: [email protected]
Received January 8th, 2013; revised February 10th, 2013; accepted February 18th, 2013
Copyright © 2013 Xin Tan etal. This is an open access article distributed under the Creative Commons Attribution License, which permits unrestricted use, distribution, and reproduction in any medium, provided the original work is properly cited.
ABSTRACT
This paper presents a design of new type of multi-parameter wearable medical devices signal processing platform. The signal processing algorithm has a QRS-wave detection algorithm based on LADT, wavelet transformation and threshold detection with TMS320VC5509 DSP system. The DSP can greatly increase the speed of QRS-wave detection, and the results can be practical used for multi-parameter wearable device detection of abnormal ECG.
Keywords: Multi-Parameter Wearable Medical Devices; DSP; LADT; Wavelet Transform; ECG Detection Algorithm
1. Introduction
The multi-parameter wearable medical devices have physiological signal detection and processing modules, signal feature extraction and data transmission basic function modules which can implement a non-invasive detection and diagnosis on the human body. It generally has the characteristics of removable operation, easy to use, support long time of continuous work, the intellec- tualized display diagnostic results, abnormal physiologi- cal condition alarms and wireless data transmission, etc. [1].
The multi-parameter devices may be simultaneously monitoring electrocardiogram (ECG), respiration, body temperature, blood pressure, blood oxygen and other parameters. In order to achieve the purpose of demon- stration, this paper focuses on the implementation proc- ess of the multi-parameter central monitoring. In the ECG signal analysis process, the QRS-wave detection is the most important issue. Not only the QRS-wave is the most important basis for diagnose the arrhythmia, but also only analyze other details information of ECG after the QRS-wave is determined [2-8]. The linear approxi- mation distance thresholding (LADT) algorithm was ori- ginally developed by Udupa and Murthy for preprocess- ing in syntax-directed ECG rhythm analysis. The LADT algorithm has shown more efficient performance than other piecewise linear approximation algorithms in re- spect to compression ratio and the quality of recon- structed ECG. Therefore, LADT widely used in ECG
signal processing, especially QRS wave detection [7]. During the process of ECG signal analysis process with LADT algorithm, due to the LADT algorithm is a compute-intensive algorithm that require long time for processing, so how to improve the processing speed of LADT algorithm is the key link during practical applica- tion. The drawback of use software (such as C++, Java) to implement the LADT algorithm is slower on the PC; this way can be used for algorithm simulation, so the general-purpose computer system with special acceler- ated processor were a feasible solution. By contrast, gen- eral-purpose programmable DSP chips have greater de- velopment flexibility which can easier to adapt to a vari- ety of digital signal processing environment for sophisti- cated digital signal processing algorithms. With the de- velopment of digital signal processing and very large- scale integration (VLSI) technology, single-chip digital signal processors become more powerful, price getting lower and lower, which are increasingly being applied to people in all areas of life. This paper describes the struc- ture of a multi-parameter monitoring module based on DSP chip solutions of hardware architecture and software components.
processing applications an essential for processing digital data representing analog signals in real time. The DSP’s high-speed arithmetic and logical hardware is programmed to rapidly execute algorithms modeling the filter trans- formation. As DSP chips cost performance and develop means of continuously improve, it has been in the com- munications and information systems, signal and infor- mation processing, automatic control, radar, military, aerospace, medical, household appliances, such as a wide range of applications in many areas. Therefore, this paper using DSP chips to form signal processing platform to meet design requirements.
2. ECG Algorithm
2.1. Fast Realization of the LADT Algorithm
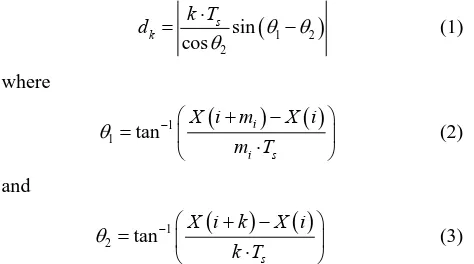
LADT algorithm first appears in Reference [7], was originally used for pretreatment of syntactic analysis, which is a method of data compression that is a fitting curve with the line, the fitting principle as shown in Fi- gure 1.
Let X i i
, 1, 2,,N be the ECG signal amplitudes,σ be the admissible distance error, and m0 be the first trial
distance. Define a distance function, dk, as follows.
Let X i k
be the kth sample following an initialsample X i . For a fixed integer, mi, the values of the
function dk are:
1 2
2 sin cos
s k
k T
d
(1)
where
1 1 tan
i
i s
X i m X i
m T
(2)
and
1 2 tan
s
X i k X i
k T
(3)
The value dk of the distance function corresponds to
the distance of the kth sample from the line joining the
ith and the (i + mi)th samples as shown in Figure 1.
1) Set mim0 and calculate dk; k1, 2,,mi1;
Let dmax max
d kk, 1, 2,,mi1
(4) If dmax then the line joining the ith and (i + mi)thsamples constitutes a line segment. Let i be the new value of i and repeat step 1, if , else stop.
m i N
2) If dmax , find km, the value of k at which dk is
maximum. Repeat step 1) with km as the new value of mi.
The LADT algorithm is superior because it uses the distance error (rather than amplitude error) between the original sample point and the approximate segment as the criterion, which makes the approximation more reason- able that is consistent with the human eye in the habit of watching wave [10]. The only problem is that the com- putation is too time-consuming, especially after the fail- ure of the initial fitting, the calculation must be repeated that is difficult to achieve real-time. Therefore, the author uses a table look-up method complete fast realization of the LADT calculation [11].
In Figure 1(a) simplified as shown in Figure 1(b)
shows, let us consider (Figure 1(b)) three samples taken at instants n, n k , and m, with n n , with amplitudes
k rn
A n , A n k
and A m
, respectively. Define an amplitude error by Figure 1(b):
a A n k A n A m A n k m n (5)
t A n m A n m n k A m A n (6)
1 22 2
d a t a t (7)
We thus have decided to use the a/t relationship:
a t A m A n m n (8)
Let us consider one threshold value dmax
d dmax
.According to Equation (7), the relationship of the func-tion dmax,a and amax are:
2
1 2max 1 max
a d a t a (9)
[image:2.595.62.542.372.736.2](a) (b)
[image:2.595.56.293.422.554.2]According to Equation (8), there is an admissible value of a , (i.e., amax ) corresponding to each value of a t
(i.e., the slope of the line segment) in the threshold table. At each approximation, we can obtain the value of amax
by looking into the table according to the a t value of the current segment. We then obtain the amplitude dif- ference between each original sample value at instant and the approximating linear segment, and check if the condition
k n k m
max
a a is met. It is obviously faster to obtain amax by looking in the table than by
calculating by division once, addition once, square root once, and multiplication once. The data compressed by the fast realization of the LADT algorithm is a chain structure model [11].
Selection of thresholds will affect the LADT compres- sion effect in directly. Obviously the larger of the thresh- old, the greater of the distortion, but can improve the compression ratio. Selection of initial step will affect the compression of time, which cannot be ignored for real time system.
ECG analysis system, detection of QRS complex wave is a very important task. The current QRS detection method is usually too complex, compute-intensive and difficult to achieve. Current wavelet transform in bio- medical engineering has been widely used, but all of the ECG data are greater, which results in calculated meas- ure, poor real-time and cannot meet needs.
Based on this reason, the system uses the fast realiza- tion of the LADT algorithm combined with the wavelet transform to process the ECG signal.
2.2. Basic Principle of Wavelet Transform [12,13]
The template is used to format your paper and style the text. All margins, column widths, line spaces, and text fonts are prescribed; please do not alter them. You may note peculiarities. For example, the head margin in this template measures proportionately more than is custom- ary. This measurement and others are deliberate, using specifications that anticipate your paper as one part of the entire proceedings, and not as an independent document. Please do not revise any of the current designations.
The algorithm uses a continuous Wavelet transform, let , ( be the square integrable real number space), the Fourier transform
t L R2
L R2
ˆ
to meet admissible conditions:
2d R C
(10)
t is called a basic wavelet or mother wavelet function. We can get wavelet basis function after scaling and displacement.
,
1
, , ; 0
a b
t b
t a b
a a
R a
(11)
where a is the scale factor, b is the displacement factor. Continuous Wavelet transform (CWT) is expanded
f t which in arbitrary space of under the wavelet basis function [14], its expression is:
2
L R
1 2
,
, ,
f a b R
t b
W a b f a f t t
a
d (12)The continuous wavelet inverse transform is:
2
1 1 , f R R t b d d
f t W a b
C a a
a b (13)According to the admissible condition in mother wave- let function of Equation (10), the function that can be used as mother wavelet function must satisfy the function
t
ˆ
is zero at the origin, namely:
ˆ 0 t td
0
(14)The stability condition is:
2ˆ 2 j
A B
(15)where A, B are constants, and 0 A B .
2.3. Design of R-Wave Detection Algorithm for ECG Signal
The design of R-wave detection algorithm for ECG sig- nal is divided into three parts: First, use the fast realiza- tion of the LADT algorithm to compress the data of original ECG, retain the necessary feature points while highlighting the R-wave eigenvalue.
Second, according to the characteristic of wavelet transform for signal Singularity (breakpoints, Spike, and so on) has a high sensitivity, the wavelet transform coef- ficients can be obtained from wavelet transform. At this point, due to the inherent nature of the wavelet, most of these coefficients should be close to zero, only the peak signal will be relatively large coefficient values.
Finally, a detection window defined by threshold method, this window actually represents the local area of the analysis signal, a time window in which to find local maxima to determine and locate the R-wave, which can excluded wavelet transform coefficients maximum point result from the pulse peaks and the signal breakpoint.
The algorithm uses a first-order Daubechies wavelet; Daubechies wavelet is a wavelet function which is con- structed by Inrid Daubechies who is a world-renowned scholar. Generally written as dbN , and N is the order of
no symmetry, i.e. nonlinear phase. dbN is no explicit
expression except for N1.
Principle of analysis by wavelet transform, the high frequency noise of ECG signal should fall primarily on the small scales of 1 and 2; low frequency components and noise (P-wave, T-wave, etc.) fall mainly on the lar- ger scales 4 and 5; In the 3rd scale, QRS-wave with the largest amplitude of wavelet transform, so use this scale Wavelet transform to detect QRS complex. However, according to different signal source of ECG using the same scale decomposition of the signal may be different, so for different ECG signal waveform to be adjusted at any time of the decomposition scale to meet practical needs.
Access to the waveform data of the QRS complex which is decomposed the ECG signal in the decomposi- tion scale, the next task is to locate the data in the wave- form of the R-wave. As the eigenvalue of R-wave is good reflected by LADT algorithm, the R-wave peak which treated by LADT algorithm is much higher than the original R-wave peak of the waveform that can offset part of the baseline drift interference, which will be very suitable to detect maximum. Therefore, the system de- fines a detection window defined by threshold method, this window actually represents the local area of the analysis signal, a time window in which to find local maxima to determine and locate the R-wave. This algo- rithm will set the size of the window with calculating the mean distance between the two R-wave peak, so exclude R-wave peak duration which is too long or too short, so that can have more accurate test results. But the practical application of this method will still produce error, espe- cially in the case of arrhythmia. However, this method can more likely to exclude some obvious errors caused by the baseline drift compared with rely on wavelet trans- form combined with threshold method to local R-wave, that can improve the accuracy.
3. Hardware Platforms and Algorithm
Realization
3.1. Hardware Platforms
In this paper, use TI Corporation’s TMS320VC5509 fixed-point DSP processor to accurately and quickly im- plement LADT algorithm of QRS wave detection, which have clock frequency of 144 MHz, one or two of instruc- tions executed in each clock cycle, two multipliers, two adders, and two internal write bus. TMS320VC5509 is a high-speed, low-power DSP chips, it makes the algo- rithm response faster, and has high precision, to provide a guarantee to achieve the algorithm [15].
The software development processes of DSP processor are basically identical with the general computer pro- gramming processes.
1) The algorithm program was written with assembly language and c language or mixed programming in as- sembly language and C language, and then they will be compiled by compiler to generate object files (*. obj) after converted to DSP assembly language.
2) The target file will be send to the linker to get the executable code files (*. out).
3) Download the executable code to debugger and run the on-line debugging, checking the results are correct. If correct, continue, otherwise modified.
4) Practice executable code file for transcoding (HEX), which wrote to the EEPROM or FLASH via a dedicated programmer. Then the program runs from the emulator. If test results are correct, end, otherwise return.
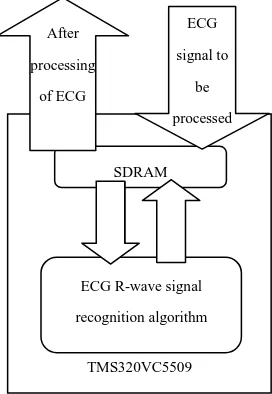
In order to achieve wearable multi-parameter moni- toring device of signal processing platform data commu- nication with the central server, this paper uses GPRS wireless communication module with the Internet as a transmission medium for data transmission. The bidirec- tional communication between wearable monitoring de- vice and monitoring center can be achieved by this method, the system block diagram shown in Figure 2.
The ECG module debugging process in three stages: 1) Debug hardware. The DSP board ensures that all devices are working properly, which is the basis for software debugging.
2) Debug software in TMS320VC5509. With a modu- lar approach to the preparation of the corresponding subroutines of each function and debug each module, then assembled through the interface of these modules to achieve the function of the system.
3) Debug GPRS communication module. Ensure that the correct data transceiver, and on this basis, gradually adding new features.
TMS320VC5509 SDRAM
ECG R-wave signal recognition algorithm After
processing of ECG
ECG signal to
[image:4.595.356.492.508.705.2]be processed
After debugging, writing object codes to
TMS320VC5509 flash by JTAG, for the entire system offline operation.
3.2. The Realization of ECG Detection Algorithm
In order to achieve this algorithm in the TMS320VC5509 DSP, use C language as a programming language with calling TI Corporation’s supplied library functions of the corresponding mathematical algorithms to achieve.
Wavelet function is included in IMGLIB library which supplied by TI Corporation, where one dimensional wa- velet pyramid decomposition and the one dimensional wavelet pyramid reconstruction defined as follows:
//Onedimensionalwaveletpyramiddecomposition
voidIMG_wave_decom_one_dim(short*in_data, short
*wksp, int*wavename, intlength, intlevel)
//Onedimensionalwaveletpyramidreconstruction
voidIMG_wave_recon_one_dim(short*in_data, short
*wksp, int*wavename, intlength, intlevel);
Add library file 55ximagex.lib to the projects which have been built before using these two functions.
In CCS by setting the corresponding BIOS, it can set the external resources of TMS320VC5509 DSP chip to meet the design requirements. The TMS320VC5509 data line, address line, control line can operate in 4 modes, respectively: data EMIF, full EMIF, non-multiplexed EHPI, and multiplexed EHPI.
The system chose DSP development board whose work in Full EMIF mode. In the BIOS settings as follows:
First, Right-click the chip support library > chip-
global CLS device configuration > chip configuration. Second, click properties, select full EMIF in parallel
portmode to complete configuration.
4. Experimental Results
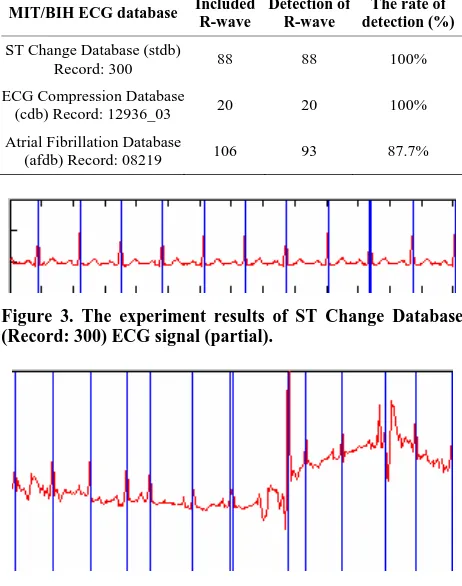
The system used the ECG signal processing detect the QRS-wave of 3 groups of ECG signals. In the experi- ment, detection of a total of 214 QRS-wave, each group of ECG signal has different length of time; all signals come from the MIT/BIH ECG database. The experiment results of the ECG detection algorithm as shown in Ta-ble 1.
In the 3 groups of ECG signals, the ST Change Data- base (Record: 300) and ECG Compression Experiment Database (Record: 12936_03) of MIT/BIH ECG data- base signal does not have the obvious pathology charac- teristic, the quality of signal is better. The signal has not more noise as well as baseline drift. We can see that this algorithm has achieved 100% rate of detection to this kind of regular ECG signal, as shown in Figure 3. The Atrial Fibrillation Database (Record: 08219) of MIT/BIH ECG database signal is pathological electrocardiogram, it
not only has noise interference but more serious baseline drift, this algorithm had only achieved 87% about recog- nition rate, there is room for improvement. However, the ECG signal can be through the design of front-end hard- ware electric circuit to carry out the pretreatment. There- fore, this kind of low quality of ECG signal only can appear in the extreme situation, as shown in Figure 4.
Experiments show: The signal processing platforms use the ECG detection algorithm that make a high correct rate of detection in this system, the DSP to achieve rapid, and note that the system has real-time monitor and analysis of ECG signal.
5. Conclusion
The system has met the qualification of the design speci- fication, but also has potential for further expansion. In terms of software, because of its modular design, we can easily add new function modules, such as autocorrelation processing, and other parameters detection module; In terms of hardware, we can use PLD or FPGA chip in- stead of SSI (Small Scale Integration) to program the logic interface of TMS320VC5509 and peripheral chip, which can reduce chip count and improve system reli- ability.
Table 1. The experiment results of R-wave signal processing algorithm.
MIT/BIH ECG database Included R-wave
Detection of R-wave
The rate of detection (%)
ST Change Database (stdb)
Record: 300 88 88 100%
ECG Compression Database
(cdb) Record: 12936_03 20 20 100% Atrial Fibrillation Database
(afdb) Record: 08219 106 93 87.7%
[image:5.595.307.538.423.716.2]Figure 3. The experiment results of ST Change Database (Record: 300) ECG signal (partial).
REFERENCES
[1] S.-D. Bao and Y.-T. Zhang, “Telemedicine: Wearable Biomedical Devices,” China Medical Device Information, Vol. 10, No. 5, 2004, pp. 1-3.
[2] S. M. S. Jalaleddine, C. G. Hutchens and R. D. Strattan, “ECG Compress Techniques,” IEEE Transaction on Bio-
medical Engineering, Vol. 37, 1990, pp. 232-243. [3] Q. I. Jin and M. O. Zhiwen, “On the Zero Equivalent
Condition of Roughness of Knowledge in Rough Set Theory,” Chinese Journal of Engineering Mathematics, Vol. 18, No. 3, 2001, pp. 139-142.
[4] L. Gang, Y. Wenyu and L. Ling. “An Artificial-Intel- ligence Approach to ECG Analysis,” Engineering in Me-
dicine and Biology Magazine, IEEE, Vol. 19, No. 2, 2000, pp. 95-100. doi:10.1109/51.827412
[5] D. Hu and Z. W. Mo, “Rough-Fuzzy Neural Network and Its Application,” Pattern Recognition and Artificial Intel-
ligence, Vol. 14, No. 3, 2001, pp. 327-331.
[6] L. Gang, F. Jing and L. Ling, “Fast Realization of the LADT ECG Data Compression Method,” Engineering in
Medicine and Biology Magazine, IEEE, Vol. 13, No. 2, 1994, pp. 255-258. doi:10.1109/51.281685
[7] J. K. Udupa and I. S. N. Murthy, “Syntactic Approach to ECG Rhythm Analysis,” IEEE Transactions on Biome-
dical Engineering, Vol. 37, No. 7, 1980, pp. 370-375. [8] P. S. Hamilton, “Compression of the Ambulatory ECG by
Average Beat Subtraction and Residual Differencing,”
IEEE Transaction on Biomedical Engineering, Vol. 38, No. 3, 1991, pp. 253-259.
[9] Y. Zhang and T.-Q. Chen, “Hardware Programming Lan- guage: TMS320C5000 Family of DSP-Based,” Xidian University Press, Xi’an, 2003.
[10] G. Li, J. Feng, L. Lin, et al. “Fast Realization of the LADT ECG Data Compression Method,” IEEE
Engi-neering in Medicine and Biology Magazine, Vol. 13, No. 2, 1994, pp. 255-258. doi:10.1109/51.281685
[11] G. Li, W. Y. Ye and F. He, “A New Algorithm for ECG Analysis Based On LADT-BP Neural Network,” Chinese
Journal of Biomedical Engineering, Vol. 20, No. 2, 2001, pp. 127-131.
[12] C.-H. Hu, J.-B. Zhang and J. Xia, “System Analysis and Design Based on MATLAB (Wavelet Analysis),” Xidian University Press, Xi’an, 1999.
[13] Fei-Si Technology R & D Center, “Wavelet Analysis Theory and MATLAB7 Implementation,” Publishing House of Electronics Industry, Beijing, 2006.
[14] R. T. Edwards and G. Cauwenberghs, “A VLSI Imple- mentation of the Continuous Wavelet Transform,” IEEE
International Symposium on Circuits and Systems, 12-15 May 1996, pp. 368-371.