Potential of Landsat spectral indices
in regard to the detection of forest health changes
due to drought effects
Martin Hais
1*, Kateřina Neudertová Hellebrandová
2, Vít Šrámek
21Department of Ecosystem Biology, Faculty of Science, University of South Bohemia, České Budějovice, Czech Republic
2Department of Forest Ecology, Forestry and Game Management Research Institute, Strnady, Czech Republic
*Corresponding author: [email protected]
Citation: Hais M., Neudertová Hellebrandová K., Šrámek V. (2019): Potential of Landsat spectral indices in regard to the de-tection of forest health changes due to drought effects. J. For. Sci., 65: 70–78.
Abstract: Because of climatic variability that has been increasing in last decades a higher drought risk seriously in-fluences the forest vitality from regional to global scale. Despite there are of many studies that describe the spectral response of forest stands to the water stress, there is still a lack of information concerning the full understanding of forest reaction to the water deficiency over a longer time period. We hypothesize that the various severity and/or fre-quency of drought periods will result in different spectral responses of forest stands. The forest response was detected using two spectral vegetation indices (normalized difference moisture index – NDMI, wetness) which are widely used for the detection of forest health changes. These indices were calculated on the basis of Landsat (TM, ETM+ and OLI) imagery which includes 105 scenes from the 2005–2016 period. The area of our interest includes 300 forest stands (dominated with Norway spruce) in the Czech Republic, Moravia. These stands were identified as damaged by drought that occurred during the 2012–2017 period. To document the climatic water deficiency, two climatic indices were calculated (AWBPE, standardized precipitation evapotranspiration index). Despite high correlation of both spectral indices, the NDMI has high sensitivity to the drought events. However, both indices significantly decreased in reaction to the drought events. In case of the 2012 drought event the decrease was one year delayed, probably due to the lower severity of drought effect. The both groups of spectral and climatic indices bring valuable information in regard to the description and understanding of drought effect on the spruce forest stands.
Keywords: meteorologiacal modeling; remote sensing; Norway spruce; spectral trajectories; forest disturbances
Drought has become a very important factor that influences ecosystem vitality especially in the con-text of recent climate change. Although temperate forest stands represent relatively stable ecosystems, the increase in climate variability over last decades (Hansen et al. 2010) makes them vulnerable dur-ing dry periods, especially durdur-ing growdur-ing season. Drought influences the forest primarily due to physiological water stress and/or secondarily as a
driver of disturbance agents (Aakala et al. 2011; Norman et al. 2016). Drought-induced tree mor-tality results from an interaction between several mechanisms. A common mechanism for trees with isohydric regulation of water status (e.g. Norway spruce) results from avoidance of drought-induced hydraulic failure via stomatal closure, resulting in carbon starvation (McDowell et al. 2008). How-ever, drought kills trees much faster in comparison
to carbon lack (Hartmann et al. 2013). Although anisohydric plants are relatively drought-tolerant, they are predisposed to hydraulic failure because they operate with narrower hydraulic safety mar-gins during drought. Higher temperatures than exacerbate carbon starvation and hydraulic failure (McDowell et al. 2008).
In general the water deficit can be measured us-ing the precipitation and temperature measure-ment or as a forest health change, which is often expressed in meteorological and remote sensing indices, respectively. Most studies related to the drought analysis and monitoring systems have been conducted using either (i) the Palmer drought severity index (Palmer 1965), based on a soil water balance equation or (ii) the standardised precipi-tation index – SPI (McKee et al. 1993), based on a precipitation probabilistic approach (Vincente-Serrano et al. 2010). Vicente-(Vincente-Serrano et al. (2010) suggested standardized precipitation evapo-transpiration index (SPEI) which is mathematically similar to SPI, but it uses the cumulative water bal-ance instead of precipitation sums.
The forest health conditions are detected using re-mote sensing imagery from spectral indices, which are primarily based on differences and/or ratios be-tween multi-spectral bands (Lambert et al. 1995). While the first studies of forest health change used changes in red and near-infrared (NIR) bands (e.g. normalized difference vegetation index – NDVI), indices based on NIR and short-wave infrared (SWIR) bands have become the standard due to their greater sensitivity to the forest canopy defoli-ation. One of the widely used approaches in regard to the detection of forest change is the tasselled cap (TC) linear transformation which is composed of three components: brightness, greenness and wet-ness (Kauth, Thomas 1976; Crist, Cicone 1984). Among these three components, wetness is often used to identify forest health status, combining all Landsat TM, ETM+ or OLI spectral bands with the exception of the thermal band with the high-est weight of the 5th SWIR channel (Skakun et al.
2003). Similarly to the wetness TC component, the normalized difference moisture index (NDMI) as a measure of canopy water content can be used to detect drought effect in forest stands (Assal et al. 2016). Sandholt et al. (2002) presented the tem-perature-vegetation dryness index using the spatial relationship between the surface temperature and NDVI. Zhang et al. (2017) summarized remote
sensing and meteorological indices and compared their sensitivity to drought detection. Since the re-mote sensing indices describe the consequences of water deficiency to ecosystems health (in con-trast to the meteorological indices that reflect ac-tual situation of water supply), their reaction to the drought may be delayed (Nicolai-Shaw et al. 2017). Despite the delay the spectral vegetation in-dices reflect the real severity of climatic influence to the forest ecosystem.
Landsat represents one of the most used remote sensing satellite system for forest monitoring. The data record of this system started in 1972. That en-ables to detect relatively long-term changes (over more than 40 years). In comparison to other sen-sors (e.g. MODIS) the longer Landsat revisit time (16 days) is very useful for year-to-year change de-tection instead for the precise phenology descrip-tion. The 30 m spatial resolution of most spectral bands (with the exception of thermal imagery) it enables forest monitoring at the stand level from regional to global scale. Free access to the Landsat data archive by the US Geological Survey (USGS) in 2008 accelerated the use of this data for multi-temporal change detection (Wulder et al. 2012). The use of multi-temporal remote sensing imagery for forest health detection and for other ecological applications is summarized in the work of (Kenne-dy et al. 2014). The time-series remote sensing data have potential for better understanding of drought effect on forest vitality. In our study we hypothe-size that the various severity and/or frequency of drought periods will result in different spectral re-sponses of forest stands.
MATERIAL AND METHODS
the dominance of Norway spruce (Picea abies (Lin-naeus) H. Karsten). Recently the spruce forests in northern Moravia became heavily affected by pest, in particular by bark beetle (Ips typagraphus (Lin-naeus, 1758), Ips duplicatus (C.R. Sahlberg, 1836), Pityogenes chalcographus (Linnaeus, 1761)) a honey fungus (Armillaria sp.) (Lubojacký 2013).
Forest inventory data. The field data of forest stands in Moravia affected by drought were ob-tained from the forest inventory database which contains 420 affected stands in Moravia between the years 2012 and 2017. The database includes information about the drought-based forest dam-age based on field forest inventory, however, there is no information about its severity. The main cri-terion for forest to be classify as a drought dam-aged stand was canopy damage connected with absence of other biotic disturbances (e.g. insect, diseases) in significant part of the stand. From this database stands with Norway spruce dominance of more than 70% (classes C1 and D1) were selected. Finally, we assessed 300 spruce forest stands. For every stand we calculated centroids, as a represen-tative location excluding the edge effect in forests. We used these centroids for the subsequent data extraction (spectral and climatic indices).
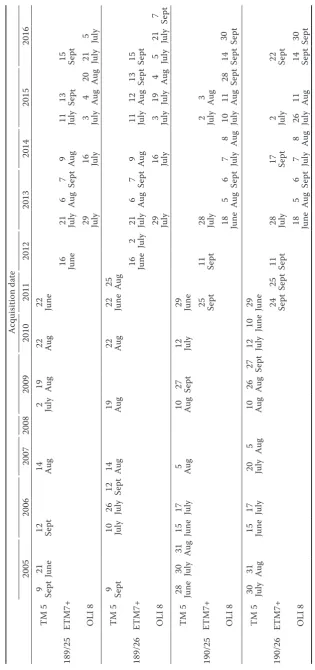
Satellite data. Landsat TM 5, ETM+ 7 and OLI 8 imagery include 105 scenes from the period of 2003–2016 (Table 1). The scenes were obtained from the USGS data archive in the Level-1 (L1T) products, which are suitable for pixel-level time se-ries analysis (https://earthexplorer.usgs.gov/). For the majority of years, multiple scenes were used (i) to increase the number of measurements and (ii) to cover areas with the absence of data caused
by clouds and their shadows. Only Landsat scenes for the year 2008 were missing in data archive and therefore this year was not included in analysis. To avoid phenological differences among the images, only data acquired during the summer season were used (predominantly July–September and in case of lack of these data the June scenes were added). The second reason for selection of summer–early autumn Landsat imagery was that the satellite data should reflect the potential effect of dry vegetation period. First the clouds and their shadows were masked-out using CF masks, which are offered together with Landsat imagery in the USGS data archive. Than the 189/25 UTM (34 north) scenes were transformed to the UTM (33 north) coordi-nate system to ensure their compatibility with all other Landsat imagery utilised (189/26, 190/25, 190/26). All images were radiometrically normal-ized using data normalization (Healey et al. 2005). In our study, we used the NDMI index and wet-ness component of the TC transformation, which proved to be the most appropriate multi-spectral vegetation indices in regard to the description of the forest structure health (Bonneau et al. 1999; Skakun et al. 2003; Wulder et al. 2004). The NDMI was calculated as a normalized ratio (Jin, Sader 2005), as Eq. 1:
NIR SWIR
NDMINIR SWIR
(1)
The wetness index is a TC linear transforma-tion which is based on general formula (Kauth, Thomas 1976; Crist, Cicone 1984), as Eq. 2:
Wetness x1 TM1x2 TM2 x3 TM3 x4 TM4 (2)x5 TM5 x7 TM7
where:
TM1–TM7 – Landsat satellite bands,
x1–x7 – coefficients for specific Landsat types (for detail see Table 2).
Means were calculated from the resulting index values for specific years, thereby levelling the data variability during year.
Climatic indices. Both AWBPE and SPEI (2005 to 2016) indices were obtained from the Czech Hy-drometeorological Institute (www.chmi.cz).
[image:3.595.68.290.97.252.2]The calculation of AWBPE is based on the pre-cipitation balance and the values of the actual evapo-transpiration of spruce stands. Selected algorithms of the AVISO (Agrometeorological Computing and Information System) model have been utilised Fig. 1. The area of study located in the eastern part of the
Czech Republic, Moravia (AWBPE – actual water balance of precipitation and actual evapotranspiration)
Ta
ble 1. A li
st of L
and
sa
t imager
y (105 sa
te llit e s cene s) summar ize d ac cor danc e w ith t he ac qui sition d at
e and t
he p
at
h and r
ow n umb ers A cqui sition d at e 2005 2006 2007 2008 2009 2010 2011 2012 2013 2014 2015 2016 189/25 TM 5
9 Sept 21 June 12 Sept 14 Aug 2 July 19 Aug 22 Aug 22 June
ET
M7+
16 June 21 July 6 Aug 7 Sept 9 Aug 11 July 13 Sept 15 Sept
OL
I 8
29 July 16 July 3 July 4 Aug 20 Aug 21 July 5 July
189/26
TM
5
9 Sept 10 July 26 July 12 Sept 14 Aug 19 Aug 22 Aug 22 June 25 Aug
ET
M7+
16 June 2 July 21 July 6 Aug
7
Se
pt
9 Aug 11 July 12 Aug 13 Sept 15 Sept
OL
I 8
29 July 16 July 3 July 19 July 4 Aug 5 July 21 July 7 Sept
190/25
TM
5
28 June 30 July 31 Aug 15 June 17 July 5 Aug 10 Aug 27 Sept 12 July 29 June
ET
M7+
25 Sept 11 Sept 28 July 2 July 3 Aug
OL
I 8
18 June 5 Aug
6
Se
pt
7 July 8 Aug 10 July 11 Aug 28 Sept 14 Sept 30 Sept
190/26
TM
5
30 July 31 Aug 15 June 17 July 20 July 5 Aug 10 Aug 26 Aug 27 Sept 12 July 10 June 29 June
ET
M7+
24 Sept 25 Sept 11 Sept 28 July 17 Sept 2 July 22 Sept
OL
I 8
18 June 5 Aug
6
Se
pt
[image:4.595.75.391.91.763.2]for the evaluation of the actual evapotranspiration (Štěpánek et al. 2018). For each day of the growing season (April 1–September 30) daily water balance is calculated for a set of automated climate stations (in mm per day) based on the total precipitation and modelled evapotranspiration.
Evapotranspiration is modelled on the basis of the average daily air temperature (°C), average daily water vapour pressure (hPa) (calculated depending on the temperature and relative humidity), the duration of the daylight (h), an average daily wind speed (m·s–1)
and daily total precipitation (mm).
The daily values of the water balance are counted for growing season and subsequently interpolated using the ClidataDEM interpolation method (linear regres-sion with altitude dependence with correction in accor-dance with the data measured at individual stations).
The standardization of the difference of the total precipitation and the potential evapotranspiration of the grassland over a given period was employed for the calculation of the SPEI index using the statisti-cal probability distribution. A detailed algorithm for the calculation of the SPEI index was published by Vicente-Serrano et al. (2010).
The FAO Penman-Monteith method in Allen’s adaptation (Allen et al. 2005) was chosen for the calculation of potential evapotranspiration. The cal-culation was implemented for grassland, for mixed forest stands and for coniferous forest stands. The values for deciduous forest stands are almost iden-tical to the values for grassland during the vegeta-tion period. Coefficients for the calculavegeta-tion of forest cover were validated with the results of experimen-tal measurements from the 2005–2015 period from the Czech Republic and Germany.
Data processing and statistical models. The val-ues of the spectral and climatic indices referred to above were extracted into the centroid layer repre-senting individual forest stands. In this manner the resulting database includes index values for all years (2005–2007 and 2009–2016). Due to a low number of drought-affected stands in several years, we
se-lected only years 2012, 2014 and 2015 for statistical comparison, which contains measured pixels (cases) 1060, 1005 and 2663, respectively. The main statistical model is based on the ANOVA between index values in the year of forest damage and index values in the years prior to the damage.
RESULTS AND DISCUSSION
Remote sensing and spectral vegetation indices
The forest stand vitality change due to drought is often assessed using the MODIS remote sens-ing data with high temporal resolution which enables the description of the changes over the year (Hlásny et al. 2015). However, the MO-DIS data have a relatively coarse spatial resolu-tion (250, 500 and 1,000 m based on spectral band) which could lead to inconsistent results in case of small areas of forest stands and/or at the forest edge. We used Landsat data in our study because of their higher spatial resolution (30 m). Already early Landsat-based studies described po-tential of this data to detect leaf water stress using vegetation indices (Rock et al. 1985; Cohen 1995).
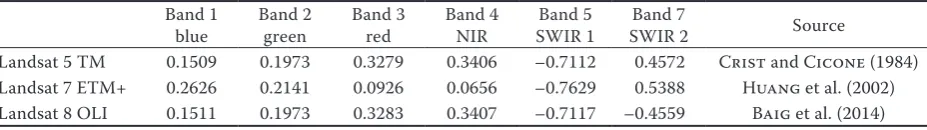
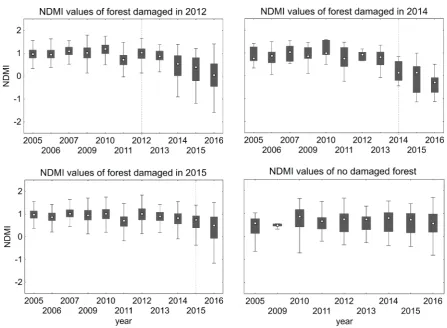
[image:5.595.65.529.113.178.2]The NDMI and wetness spectral indices used in our study are highly correlated (R = 0.85) for forest stands and show similar trends in spectral trajectories. However, they differ in sensitivity to drought events in selected years. Because the NDMI has a lower year-on-year variability, which may be caused by other environmental influences (e.g. phenology, data noise) the values changed due to drought events are more obvious in spectral tra-jectories. Therefore, we only present here the time-series graphs for the NDMI indices (Fig. 2). When comparing the NDMI values in the year of drought event with previous years, the differences are only significant for drought-event-years of 2014 and 2015 (Table 3). The NDMI values for the year 2012 Table 2. Landsat coefficients for the wetness index calculation from Landsat imagery
Band 1
blue Band 2 green Band 3 red Band 4 NIR SWIR 1Band 5 SWIR 2Band 7 Source
Landsat 5 TM 0.1509 0.1973 0.3279 0.3406 –0.7112 0.4572 Crist and Cicone (1984)
Landsat 7 ETM+ 0.2626 0.2141 0.0926 0.0656 –0.7629 0.5388 Huang et al. (2002)
Landsat 8 OLI 0.1511 0.1973 0.3283 0.3407 –0.7117 –0.4559 Baig et al. (2014)
showed inconsistent results, while the subsequent years, i.e. 2013, 2014, 2015 and 2016 show clearly a decrease in values. This can be therefore considered as a delayed signal change due to the lower severity of forest stress caused by drought effect. This cor-responds with relatively high SPEI values in 2012, but simultaneously low values of AWBPE. That means the low absolute precipitation (AWBPE) does not increase drought-stress if the relative pre-cipitation (SPEI) are close to long-term mean. Sim-ilarly, the NDMI values are decreasing after both drought-event-years 2014 and 2015, which dem-onstrates the continuing forest decline, associated probably with other stress agents (e.g. bark beetle infestation). In comparison to damaged forest by drought effect, we present here also the NDMI val-ues of non-affected forest, which results in similar NDMI values over time. Only the values of years 2006 and 2007 were excluded due to atmospheric influence. In concordance to our results, Assal et al. (2016) reported the NDMI decreasing in the dry periods in semi-arid forest.
Table 3. Statistical comparison of remote sensing and meteorological indices in the year of forest damage with previous years
Index Year F-value P-value
NDMI
2012
0.099 0.755
Wetness 24.85 > 0.001*
AWBPE 6.74 0.014
SPEI 24.85 > 0.001
NDMI
2014
16.27 > 0.001
Wetness 12.15 > 0.001
AWBPE 2.407 0.124
SPEI 0.564 0.455
NDMI
2015
116 > 0.001
Wetness 17.64 > 0.001
AWBPE 803.7 > 0.001
SPEI 3,875 > 0.001
[image:6.595.64.292.516.694.2]NDMI – normalized difference moisture index, AWBPE – actual water balance of precipitation and actual evapotranspiration, SPEI – standardized precipitation evapotranspiration index; significant P-values of the ANOVA test in bold; *increased values of drought-damaged forest
Fig. 2. Normalized difference moisture index (NDMI) values for forest stands affected by drought in individual years. The chart below on the right shows the non-affected forests (for the sake of comparison)
Climatic indices
The same way as spectral indices, both AWBPE and SPEI indices values were compared in the drought-event-years with values of previous years (Fig. 3). The results of the ANOVA test with a post-hoc test show the significant lower index values for drought-years of 2012 and 2015; however, the year 2014 does not show any significant difference to previous years. The explanation may be the lower drought effect of this year in comparison to 2012 and/or 2015. On the other hand, the significant dif-ference of the both indices during drought events in 2015 may be caused by the highest decreasing of precipitation between 2005–2016.
Drought in forest
When comparing both spectral and climatic in-dices referred to above, the regression is relatively low (R2 < 0.1). This is probably caused by different
nature of both index groups. The climatic indices reflect mainly the precipitation sum, thereby de-scribing the preconditions for drought-based for-est stress. Nevertheless, the increasing water stress does not cause the same response in the entire forest area. Assal et al. (2016) described that the drought causes a certain pattern in forest areas that are re-sistant, persistent or vulnerable to severe drought. The main drivers for this pattern are topography, geology and distance to the watercourses (Assal et al. 2016; Vidal-Macua et al. 2017). In contrast to climatic indices the spectral indices are reflect-ing the actual and/or the previous forest condition. Therefore the spectral indices are resulting from
more complex factors as previous drought events, pest infestations, diseases and forest management (e.g. thinning). Therefore it is not possible to disen-tangle drought effects from those caused by various other disturbance agents (Norman et al. 2016). In fact the different nature of spectral and climatic in-dices brings opportunity for improved description of the drought influence on the forest ecosystems.
CONCLUSIONS
[image:7.595.92.508.93.243.2]Both spectral vegetation indices, NDMI and wet-ness, are decreasing during the years (2014 and 2015) of drought periods. The decreasing of these indices was not significant in 2012, however, the subsequent years showed the decreasing trend. The delay of the tree response to the dry period in 2012 may be caused by a lower severity of drought ef-fect because of relatively high values of SPEI index, which reflects difference to long-term precipita-tion. Similarly, both climatic indices reflected the drought events, with the exception of the year 2014, when the differences of both indices values compared with previous years were not significant. The indices of previous years have probably already contained the drought events. Both climatic and spectral indices are relatively low-correlated which is caused by different nature of both indices group. While the climatic indices reflect mostly the pre-cipitation, the spectral indices represent integral values that describe the forest vitality. However, both climatic and spectral indices are bringing valuable information in regard to the description of drought events and their consequences for forest vitality change.
References
Aakala T., Kuuluvainen T., Wallenius T., Kauhanen H. (2011): Tree mortality episodes in the intact Piceaabies-dominated taiga in the Arkhangelsk region of northern European Rus-sia. Journal of Vegetation Science, 22: 322–333.
Allen R.G., Clemmens A.J., Burt C.M., Solomon K., O’Halloran T. (2005): Prediction accuracy for projectwide piration using crop coefficients and reference evapotrans-piration. Journal of Irrigation and Drainage Engineering, 131: 24–36.
Assal T.J., Anderson P.J., Sibold J. (2016): Spatial and temporal trends of drought effects in a heterogeneous semi-arid forest ecosystem. Forest Ecology and Management, 365: 137–151. Baig M.H.A., Zhang L., Shuai T., Tong Q. (2014): Derivation
of a tasselled cap transformation based on Landsat 8 at-satellite reflectance. Remote Sensing Letters, 5: 423–431. Bonneau L.R., Shields K.S., Civco D.L. (1999): Using satel-lite images to classify and analyze the health of hemlock forests infested by the hemlock woolly adelgid. Biological Invasions, 1: 255–267.
Cohen W.B. (1995): Response of vegetation indices to changes in three measures of leaf water stress. Photogrammetric Engineering and Remote Sensing, 57: 195–202.
Crist E.P., Cicone R.C. (1984): Application of the tasseled cap concept to simulated thematic mapper data. Photogram-metric Engineering and Remote Sensing, 50: 343–352. Hansen J., Ruedy R., Sato M., Lo K. (2010): Global surface
temperature change. Reviews of Geophysics, 48: RG4004. doi: 10.1029/2010RG000345
Hartmann H., Ziegler W., Kolle O., Trumbore S. (2013): Thirst beats hunger – declining hydration during drought prevents carbon starvation in Norway spruce saplings. New Phytologist, 200: 340–349.
Healey S.P., Cohen W.B., Yang Z., Krankina O.N. (2005): Comparison of tasseled cap based Landsat data structures for use in forest disturbance detection. Remote Sensing of Environment, 97: 301–310.
Hlásny T., Barka I., Sitková Z., Bucha T., Konôpka M., Lukáč M. (2015): MODIS-based vegetation index has sufficient sensitivity to indicate stand-level intra-seasonal climatic stress in oak and beech forests. Annals of Forest Science, 72: 109–125.
Huang C., Yang W.L., Homer C., Zylstra G. (2002): Deriva-tion of a tasselled cap transformaDeriva-tion based on Landsat 7 at-satellite reflectance. International Journal of Remote Sensing, 23: 1741–1748.
Jin S., Sader S.A. (2005): Comparison of time series tasseled cap wetness and the normalized difference moisture index in detecting forest disturbances. Remote Sensing of Envi-ronment, 94: 364–372.
Kauth R.J., Thomas G.S. (1976): The tasseled cap – a graphic description of the spectral-temporal development of agri-cultural crops as seen in Landsat. In: Swain P. H.: Proceed-ings of the Symposium on Machine Processing of Remotely Sensed Data, West Lafayette, June 29–July 1, 1976: 41–51. Kennedy R.E., Andréfouët S., Cohen W.B., Gómez C., Griffiths
P., Hais M., Healey S.P., Helmer E.H., Hostert P., Lyons M.B., Meigs G.W., Pflugmacher D., Phinn S.R., Powell S.L., Scarth P., Sen S., Schroeder T.A., Schneider A., Sonnenschein R., Vogelmann J.E., Wulder M.A., Zhu Z. (2014): Bringing an ecological view of change to Landsat-based remote sensing. Frontiers in Ecology and the Environment, 12: 339–346. Lambert N.J., Ardo J., Rock B.N., Vogelmann J.E. (1995):
Spectral characterization and regression-based classifi-cation of forest damage in Norway spruce stands in the Czech Republic using Landsat Thematic Mapper data. International Journal of Remote Sensing, 16: 1261–1287. Lubojacký J. (2013): Škodliví činitelé v lesích Moravsko-slezského kraje v letech 2002–2012. Lesnická práce, 92: 366–367.
McDowell N., Pockman W.T., Allen C.D., Breshears D.D., Cobb N., Kolb T., Plaut J., Sperry J., West A., Williams D.G., Yepez E.A. (2008): Mechanisms of plant survival and mortality during drought: Why do some plants survive while others succumb to drought? New Phytologist, 178: 719–739.
McKee T.B., Doesken N.J., Kleist J. (1993): The relationship of drought frequency and duration to time scales. In: 8th Conference on Applied Climatology, Boston, Jan 17–23, 1993: 179–184.
Nicolai-Shaw N., Zscheischler J., Hirschi M., Gudmundsson L., Seneviratne S.I. (2017): A drought event composite analysis using satellite remote-sensing based soil moisture. Remote Sensing of Environment, 203: 216–225.
Norman S.P., Koch F.H., Hargrove W.W. (2016): Review of broad-scale drought monitoring of forests: Toward an integrated data mining approach. Forest Ecology and Management, 380: 346–358.
Palmer W.C. (1965): Meteorological Droughts. Research Paper No. 45. Washington, D.C., U.S. Department of Com-merce, Weather Bureau: 58.
Rock B.N., Williams D.L., Vogelmann J.E. (1985): Field and airborne spectral characterization of suspected acid deposition damage in red spruce (Picearubens) from Ver-mont. In: Proceedings: Symposia on Machine Processing of Remotely Sensed Data, West Lafayette, June 25–27, 1985: 71–81.
Skakun R.S., Wulder M.A., Franklin S.E. (2003): Sensitivity of the thematic mapper enhanced wetness difference index to detect mountain pine beetle red-attack damage. Remote Sensing of Environment, 86: 433–443.
Štěpánek P., Trnka M., Chuchma F., Zahradníček P., Skalák P., Farda A., Fiala R., Hlavinka P., Balek J., Semerádová D., Možný M. (2018): Drought prediction system for Central Europe and its validation. Geosciences, 8: 104. doi: 10.3390/ geosciences8040104
Vicente-Serrano S.M., Beguería S., López-Moreno J.I. (2010): A Multi-scalar drought index sensitive to global warming: The standardized precipitation evapotranspiration index – SPEI. Journal of Climate, 23: 1696–1718.
Vidal-Macua J.J., Ninyerola M., Zabala A., Domingo-Mari-mon C., Pons X. (2017): Factors affecting forest dynamics in the Iberian Peninsula from 1987 to 2012. The role of
topography and drought. Forest Ecology and Management, 406: 290–306.
Wulder M.A., Skakun R.S., Kurz W.A., White J.C. (2004): Estimating time since forest harvest using segmented Landsat ETM+ imagery. Remote Sensing of Environment, 93: 179–187.
Wulder M.A., Masek J.G., Cohen W.B., Loveland T.R., Wood-cock C.E. (2012): Opening the archive: How free data has enabled the science and monitoring promise of Landsat. Remote Sensing of Environment, 122: 2–10.
Zhang L., Jiao W., Zhang H., Huang C., Tong Q. (2017): Study-ing drought phenomena in the Continental United States in 2011 and 2012 using various drought indices. Remote Sensing of Environment, 190: 96–106.