Adaptive Modulation and Adaptive Antenna Array Assisted Network
Performance of Multi-User Detection Aided UTRA-like FDD/CDMA
Systems
J.S. Blogh, L. Hanzo
Dept. of Electronics and Computer Science, Univ. of Southampton, SO17 1BJ, UK. Tel: +44-2380-593 125, Fax: +44-2380-593 045
Email:[email protected];http://www-mobile.ecs.soton.ac.uk
Abstract— The adaptive antenna array and adaptive modulation aided network performance of a Frequency Division Duplex (FDD) Code Division Multiple Access (CDMA) based system is investigated using system parameters similar to those of the Universal Mobile Telecommunication System (UMTS). A number of performance metrics, such as the call dropping probability, the average throughput as well as the required average transmit power are quantified. It is demonstrated that the employ-ment of adaptive modulation techniques in conjunction with adaptive antenna arrays resulted in significant network capacity gains in the scenarios investigated.
I. INTRODUCTION
Although the various third-generation (3G) system parame-ters [1] undergo perpetual evolution, it is beneficial to study the net-work performance of a typical advanced UTRA-like FDD CDMA system. Albeit the initial 3G systems are expected to refrain from employing the most powerful performance enhancement tech-niques available at the current state-of-the-art, in this contribu-tion we embark on quantifying their potential joint performance benefits. Specifically, in contrast to the previous literature [2]- [4], the novelty of this paper is that it jointly optimises the perfor-mance benefits of adaptive antennas [1], adaptive modulation [5] and multi-user detection [6], bridging the physical and network layer.
The outline of this contribution is as follows. Section II introduces the system parameters, leading to a discussion of the performance met-rics in Section III. The performance benefits of using adaptive modu-lation [5] in a pedestrian scenario are quantified in Section IV and we conclude our discussions in Section V.
II. SYSTEMPARAMETERS
The soft handover, the power control and spreading code allocation principles of the system studied were outlined in [1], hence here we refrain from detailing these issues. New call channel allocation requests were placed in a resource allocation queue for up to 5s. If during this period a call was not serviced, it was classed as blocked. The mobiles moved freely, in random directions, at a speed of 3 miles/hour (mph) within the simulation area, which consisted of 49 cells of an infinite around cellular system [1]. The employment of this wrapped-around mesh allowed us to avoid the ’desert-island-like’ edge effects associated with a reduced co-channel interference near the boundaries of a finite area. The cell-radius was 150 m. The inter-call periods were Poisson distributed, while the call duration was negative exponentially distributed, both obeying the mean values shown in Table I. For our initial investigations we have assumed that the basestations and mobiles form a synchronous network, both in the up- and the down-link.
Furthermore, the basestations are assumed to be equipped with the Minimum Mean Squared Error Block Decision Feedback Equaliser
(MMSE-BDFE) based Multi-User Detector (MUD) [6]. The
post-despreading SINRs required by this MUD for obtaining the target
The support of the European Union and that of the EPSRC, UK is gratefully acknowledged. VTC’2002 Fall, Vancouver, Canada
BERs were determined with the aid of physical-layer simulations us-ing an adaptive modulation assisted CDMA scheme [5], in conjunc-tion with1/2rate turbo coding [9] and MUD, when communicating over a COST 207 seven-path Bad Urban channel [5, 12]. Using this turbo-coded MUD-assisted transceiver and a spreading factor of 16, the post-despreading SINR required for maintaining the target BER of
1×10⁻³was 8.0 dB. The BER corresponding to low-quality access
was stipulated to be5×10−3. This BER was exceeded for SINRs be-low 7.0dB. Furthermore, a be-low-quality outage was declared, when the BER of1×10−2was exceeded, namely for SINRs below 6.6 dB. These values can be seen along with the other system parameters in Table I.
III. PERFORMANCEMETRICS
There are several performance metrics that can be used for quantify-ing the performance or quality of service provided by a mobile cellular network. The following performance metrics have been widely used in the literature and were also advocated by Chuang [11]:
• New call blocking probability,PB.
• Call dropping or forced termination probability, PF T. A call is dropped when the lower of the uplink and downlink SINRs dips con-secutively below the outage SINR, where the BER exceeds 1% a given number of times.
• Probability of a low quality access,Plow, quantifies the chances of either the uplink or downlink signal quality being sufficiently poor, re-sulting in a low quality access, where the BER exceeds 0.5%. • Probability of outage, Pout, is defined as the probability that the SINR is below the value at which the call is deemed to be in outage. • Grade-Of-Service (GOS) was defined by Cheng and Chuang [11] as :
GOS = P{unsuccessful or low-quality call accesses}
= P{call is blocked}+P{call is admitted} ×
P{low signal quality and call is admitted}
= PB+ (1−PB)Plow. (1)
In order to determine the number of users that may be supported with adequate call quality by the network, we have defined a conservative and a lenient scenario which are formed from a combination of the performance metrics, as follows [13]:
• Conservative scenario:
PB≤3%,PF T ≤1%,Plow≤1%andGOS≤4%. • Lenient scenario:
PB≤5%,PF T ≤1%,Plow≤2%andGOS≤6%.
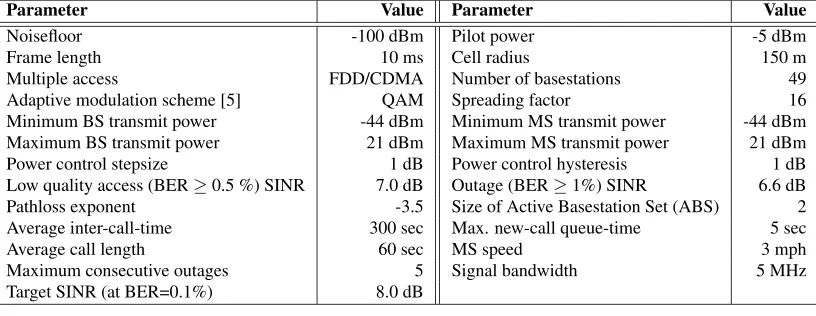
Parameter Value Parameter Value
Noisefloor -100 dBm Pilot power -5 dBm
Frame length 10 ms Cell radius 150 m
Multiple access FDD/CDMA Number of basestations 49
Adaptive modulation scheme [5] QAM Spreading factor 16
Minimum BS transmit power -44 dBm Minimum MS transmit power -44 dBm
Maximum BS transmit power 21 dBm Maximum MS transmit power 21 dBm
Power control stepsize 1 dB Power control hysteresis 1 dB
Low quality access (BER≥0.5 %) SINR 7.0 dB Outage (BER≥1%) SINR 6.6 dB
Pathloss exponent -3.5 Size of Active Basestation Set (ABS) 2
Average inter-call-time 300 sec Max. new-call queue-time 5 sec
Average call length 60 sec MS speed 3 mph
Maximum consecutive outages 5 Signal bandwidth 5 MHz
Target SINR (at BER=0.1%) 8.0 dB
TABLE I SIMULATION PARAMETERS.
UTRA is 3.84 Mchips/sec, this spreading factor corresponds to a chan-nel data rate of 3.84×10⁶/16 = 240 kbps. Applying1/2rate error cor-rection coding would result in an effective data throughput of 120 kbps, whereas utilising a2/3rate error correction code would provide a use-ful throughput of 160 kbps. Again, a cell radius of 150 m was assumed and a pedestrian walking velocity of 3 miles/hour was used, while the remaining system characteristics - including the power control scheme, the OVSF code allocation algorithm [1, 8] and the multi-user detec-tor [6] - were identical to those used in [10], which are also summarised in Table I.
IV. PERFORMANCE OFADAPTIVEARRAYS ANDADAPTIVE
MODULATION IN AHIGHDATARATEPEDESTRIAN
ENVIRONMENT
A. The Antenna Arrays
In our previous investigations employing AAAs at the base sta-tion [13] we observed quite significant performance gains as a direct result of the interference rejection capabilities of the AAAs invoked. Since the CDMA based network considered here has a frequency reuse of 1, the levels of co-channel interference are significantly higher than in [13], and hence the adaptive antennas may be able to null the in-terference more effectively. On the other hand, the high number of interference sources may limit the achievable interference rejection.
In order to render the simulations realistic, we used two multipath rays, in addition to the line-of-sight ray, each having a third of the direct-path’s power. The angle-of-arrival of each multipath ray was determined using the so-called Geometrically Based Single-Bounce El-liptical Model (GBSBEM) of [14,15] with parameters chosen such that the multipath rays had one-third of the received power of the direct ray. The Probability Density Function (PDF) of the angle-of-arrival distri-bution used in the simulations generated using the GBSBEM is shown in Figure 1. It was assumed that the multipath rays arrived with no time delay relative to the LOS path. However, in a practical system a space-time equalizer [16, 17] would be required to prevent the nulling of the delayed paths.
Network performance results were obtained using two and four el-ement adaptive antenna arrays, both in the absence of shadow fading, and in the presence of 0.5 Hz and 1.0 Hz frequency shadow fading exhibiting a standard deviation of 3 dB. The adaptive beamform-ing algorithm used was the Sample Matrix Inversion (SMI) algo-rithm [1]. Below the specific adaptive beamforming implementa-tion used for calculating the AAA weights in the CDMA based net-work studied here is briefly highlighted as follows [13].
Specifically, one of the eight possible 8-bit BPSK reference signals
-180 -120 -60 0 60 120 180 Angle-Of-Arrival (degrees)
0.0 0.01 0.02 0.03 0.04 0.05
Probability
Density
[image:2.595.97.505.25.183.2]Function
Fig. 1. Probability density function of angle-of-arrival of the multipath rays, centred about the angle-of-arrival of the line-of-sight path.
was used for identifying the desired user, and the remaining interfer-ing users were assigned the other seven 8-bit reference signals. The received signal’s autocorrelation matrix was then calculated, and from the knowledge of the desired user’s reference signal, the receiver’s op-timal antenna array weights were determined with the aid of the SMI algorithm [1]. Since this implementation of the algorithm only calcu-lated the basestation receiver’s antenna array weights, i.e. the antenna arrays weights used by the base station in the uplink, these weights may not be suitable for use in the downlink, when independent up/downlink shadow fading is experienced. Hence, investigations were conducted in two specific scenarios, namely where the uplink and downlink AAA weights were identical, as well as when they were separately deter-mined for the uplink and downlink. The corresponding uplink beam-forming scenario is portrayed for the sake of illustration in Figure 2, while an appropriately modified, but similar scenario is valid for the downlink, which is not shown here for reasons of space economy.
Interference paths
Basestation
Mobile station Mobile station
Multipath LOS
Multipath
LOS
Multipath
[image:3.595.67.271.27.369.2]Basestation Beam pattern
Fig. 2. The multipath environments of the uplink showing the multipath components of the desired signals, the line-of-sight interference and the associated base station antenna array beam patterns.
scenarios was summarised in Table II [1].In the next section we will show the benefits of employing adaptive modulation [5].
B. Employing Adaptive Modulation
In this section we apply Adaptive Quadrature Amplitude Modulation (AQAM) techniques [5]. There are two main objectives, when em-ploying AQAM, namely counteracting the effects of time-variant channel quality fluctuations as well as the effects of the time-variant interference load imposed by the time-variant number of variable-rate users supported.1 The various experimental conditions
inves-tigated were identical to those used for generating the results of Ta-ble II, except for the application of AQAM [5]. Since in TaTa-ble II an increased network capacity was achieved due to using independent up-and down-link beamforming, this procedure was invoked in these sim-ulations. AQAM involves the selection of the appropriate modulation mode in order to maximise the achievable data throughput over a chan-nel, whilst minimising the Bit Error Ratio (BER). More explicitly, the philosophy behind AQAM is the most appropriate selection of a mod-ulation mode according to the instantaneous radio channel quality ex-perienced [5, 19]. Therefore, if the SINR of the channel is high, then a high-order modulation mode may be employed, thus exploiting the temporal fluctuation of the radio channel’s quality. Similarly, if the channel is of low quality, exhibiting a low SINR, a high-order mod-ulation mode would result in an unacceptably high BER or FER, and hence a more robust, but lower throughput modulation mode would
1Unless otherwise stated, for the sake of simplicity we will refer to time-variant channel quality
fluctua-tions, regardless, whether these were imposed by fading effects or by co-channel interference fluctuations.
Y
N 16-QAM Mode?
Thus, in BPSK mode
4-QAM to 16-QAM thres.Any BS TX power <
Y -15dB
Switch to 16-QAM Downlink Start
Y
N SINR < 4-QAM Target
SINR?
Switch to BPSK Y
N
SINR < 16-QAM LQOutage SINR? Switch to 4-QAM
max. BS TX power-15dBAny BS TX power > Y Switch to 4-QAM
Any BS TX power > max. BS TX power-15dB
Y Y
N 4-QAM Mode?
SINR > BPSK Target SINR?
Y
BPSK to 4-QAM thres.Any BS TX power <
Y -15dB
[image:3.595.328.535.35.276.2]Switch to 4-QAM
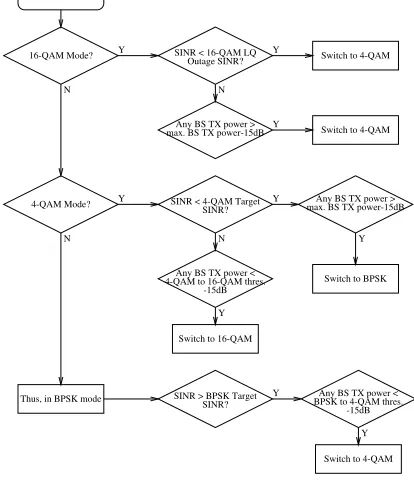
Fig. 3. The AQAM mode switching algorithm used in the downlink of the CDMA based cellular network.
be employed. Therefore, AQAM combats the effects of time-variant channel quality, while also attempting to maximise the achieved data throughput, and maintaining a given BER or FER. In the investigations conducted, the modulation modes of the up and downlink were deter-mined independently, thus taking advantage of the lower levels of co-channel interference on the uplink, or of the potentially higher transmit power of the base stations.
The particular implementation of the AQAM mode switching proce-dure used in these investigations is illustrated in Figure 3 [1]. This fig-ure describes the algorithm in the context of the downlink, but the same implementation was used also in the uplink. For a detailed discussion of the inner working of the algorithm the interested reader is referred to [1]. Table III shows the BPSK, 4-QAM and 16-QAM reconfiguration SINR thresholds used in the simulations. The BPSK SINR thresholds were 4 dB lower, than those necessary when using 4-QAM, while the 16-QAM SINR thresholds were 5.5 dB higher [12]. In other words, in moving from the BPSK modulation mode to the 4-QAM modula-tion mode, the target SINR, low quality outage SINR and outage SINR all increased by 4 dB. When switching to the 16-QAM mode from the 4-QAM mode, the SINR thresholds were increased by 5.5 dB. How-ever, it was necessary to set the BPSK to 4-QAM and the 4-QAM to 16-QAM mode switching thresholds to a value 7 dB higher than the SINR required for maintaining the target BER/FER, in order to prevent excessive outages due to sudden dramatic channel-induced variations in the SINR levels.
Performance results were obtained both with and without beamform-ing in a log-normal shadow fadbeamform-ing environment, at maximum fadbeamform-ing frequencies of 0.5 Hz and 1.0 Hz, and a standard deviation of 3 dB. Again, a pedestrian velocity of 3 mph, a cell radius of 150 m and a spreading factor of 16 were used, as in our previous investigations.
Conservative scenario,PF T=1%,Plow=1%
Shadowing Beamforming: independent Users Traffic (Erlangs Power (dBm)
up/down-link /km2/MHz) MS BS
No No - 256 1.42 3.1 2.7
No 2 elements - 325 1.87 3.75 0.55
No 4 elements - 480 2.75 4.55 1.85
0.5 Hz, 3 dB No - ≈150 0.87 -1.2 -1.7
0.5 Hz, 3 dB 2 elements No 203 1.16 0.1 -1.1
0.5 Hz, 3 dB 4 elements No 349 2.0 2.0 0.65
0.5 Hz, 3 dB 2 elements Yes 233 1.35 0.2 -0.8
0.5 Hz, 3 dB 4 elements Yes ≈375 2.2 2.15 0.85
1.0 Hz, 3 dB No - 144 0.82 -1.1 -1.6
1.0 Hz, 3 dB 2 elements No 201 1.12 -0.3 -1.1
1.0 Hz, 3 dB 4 elements No 333 1.88 1.6 0.5
1.0 Hz, 3 dB 2 elements Yes 225 1.31 0.1 -0.9
[image:4.595.122.480.25.218.2]1.0 Hz, 3 dB 4 elements Yes 365 2.05 1.65 0.6
TABLE II
Maximum mean carried traffic and maximum number of mobile users that can be supported by the network, whilst meeting the conservative quality constraints. The carried traffic is expressed in terms of normalised Erlangs (Erlang/km2/MHz) for the network described in Table I bothwith and without beamforming (as well as with and without independent
up/down-link beamforming), and also with and without shadow fading having a standard deviation of 3 dBfor SF=16.
0.8 1.0 1.2 1.4 1.6 1.8 2.0 2.2 2.4 2.6 2.8
Mean Carried Teletraffic (Erlangs/km2/MHz)
10-3
2 5
10-2
2
Forced
T
ermination
Probability
,
PFT
1% 4 element beamforming 2 element beamforming No beamforming
1Hz, 3dB shadowing 0.5Hz, 3dB shadowing
Fig. 4. Call dropping probability versus mean carried traffic of a CDMA based cellular network usingrelative receivedEc/Iobased soft handover thresholds bothwith and without beamforming in conjunction with AQAM as well as with shadowing hav-ing a standard deviation of 3 dBfor SF=16.
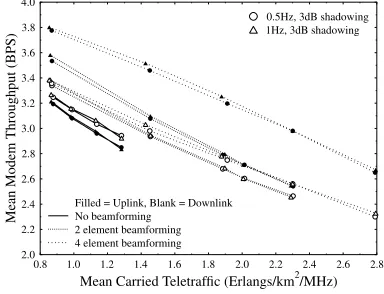
can be attributed to the pilot power interference encountered by the mo-biles in the downlink. This explanation can be confirmed by examin-ing Figure 6, which demonstrates that the mean modem throughput in the downlink, without AAAs, was lower than that in the uplink even in conjunction with an increased downlink transmission power. How-ever, the increase in the mean downlink transmission power resulted in a more substantial increase in the mean downlink modem throughput, especially with the advent of the four element antenna arrays, which ex-hibited an approximately 0.5 BPS throughput gain over the two element arrays for similarly high traffic loads which can be seen in Figure 6.
A summary of the maximum user capacities of the networks consid-ered in this section in conjunction with log-normal shadowing having a standard deviation of 3 dB, both with and without employing beam-forming using two and four element arrays is given in Table IV. The teletraffic carried, the mean mobile and base station transmission pow-ers required, and the mean up- and down-link modem data throughputs achieved are also shown in Table IV. For more performance results on the topic the interested reader might like to consult reference [1].
0.8 1.0 1.2 1.4 1.6 1.8 2.0 2.2 2.4 2.6 2.8
Mean Carried Teletraffic (Erlangs/km2/MHz)
0 1 2 3 4 5 6
Mean
T
ransmission
Power
(dBm)
1Hz, 3dB shadowing 0.5Hz, 3dB shadowing 4 element beamforming 2 element beamforming No beamforming
[image:4.595.343.529.296.445.2]Filled = Downlink, Blank = Uplink
Fig. 5. Mean transmission power versus mean carried traffic of a CDMA based cellu-lar network usingrelative receivedEc/Iobased soft handover thresholds bothwith and without beamforming in conjunction with AQAM as well as with shadowing having a standard deviation of 3 dBfor SF=16.
0.8 1.0 1.2 1.4 1.6 1.8 2.0 2.2 2.4 2.6 2.8
Mean Carried Teletraffic (Erlangs/km2/MHz)
2.0 2.2 2.4 2.6 2.8 3.0 3.2 3.4 3.6 3.8 4.0
Mean
Modem
Throughput
(BPS)
4 element beamforming 2 element beamforming No beamforming
Filled = Uplink, Blank = Downlink
1Hz, 3dB shadowing 0.5Hz, 3dB shadowing
[image:4.595.74.264.296.443.2] [image:4.595.337.529.517.664.2]Conservative scenario
Traffic (Erlangs Power (dBm) Throughput (BPS)
Shadowing Beamforming Users /km2/MHz) MS BS Uplink Downlink
0.5 Hz, 3 dB No 223 1.27 3.25 4.95 2.86 2.95
0.5 Hz, 3 dB 2 elements 366 2.11 3.55 4.7 2.56 2.66
0.5 Hz, 3 dB 4 elements 476 2.68 3.4 5.0 2.35 2.72
1.0 Hz, 3 dB No 218 1.24 3.3 4.95 2.87 2.96
1.0 Hz, 3 dB 2 elements 341 1.98 3.5 4.9 2.62 2.73
1.0 Hz, 3 dB 4 elements 460 2.59 3.5 4.95 2.4 2.8
TABLE IV
MAXIMUM MEAN CARRIED TRAFFIC AND MAXIMUM NUMBER OF MOBILE USERS THAT CAN BE SUPPORTED BY THE NETWORK,WHILST MEETING THE CONSERVATIVE QUALITY CONSTRAINTS. THE CARRIED TRAFFIC IS EXPRESSED IN TERMS OF NORMALISEDERLANGS(ERLANG/KM2/MHZ),FOR THE NETWORK DESCRIBED INTABLEIBOTHwith and without beamforming (using independent up/down-link beamforming), in conjunction with shadow fading having a standard deviation of 3 dB, whilst employing adaptive
modulation techniquesFORSF=16.
SINR Threshold BPSK 4-QAM 16-QAM
Outage SINR 2.6 dB 6.6 dB 12.1 dB
Low Quality Outage SINR 3.0 dB 7.0 dB 12.5 dB
Target SINR 4.0 dB 8.0 dB 13.5 dB
TABLE III
THE TARGETSINR,LOW QUALITY OUTAGESINRAND OUTAGESINRTHRESHOLDS USED FOR THEBPSK, 4-QAMAND16-QAMMODULATION MODES OF THE
ADAPTIVE MODEM.
V. SUMMARY ANDCONCLUSIONS
The impact of AAAs upon the IMT2000 / UTRA network capacity was considered in both non-shadowed and log-normal shadow faded propagation environments, which was further improved with the aid
of AQAM techniques. In conclusion, the employment of AQAM
increased both the average throughput and the robustness of the network, since a sudden channel quality reduction did not re-sult in dropping the call supported, it rather activated a lower-throughput, but more robust modulation mode.
REFERENCES
[1] J.S. Blogh, L. Hanzo: Third-Generation Systems and Intelligent Wireless Networking - Smart An-tennas and Adaptive Modulation, John Wiley, Jan. 2002, (For detailed contents and sample chapters please refer to http://www-mobile.ecs.soton.ac.uk)
[2] J. Laiho-Steffens, A. Wacker, and P. Aikio, “The Impact of the Radio Network Planning and Site Configuration on the WCDMA Network Capacity and Quality of Service,” inIEEE Proceedings of
Vehicular Technology Conference, (Tokyo, Japan), pp. 1006–1010, 2000.
[3] R. D. Kimmo Hiltunen, “WCDMA Downlink Capacity Estimation,” inIEEE Proceedings of
Vehic-ular Technology Conference, (Tokyo, Japan), pp. 992–996, 2000.
[4] K. Sipil¨a, Z.-C. Honkasalo, J. Laiho-Steffens, and A. Wacker, “Estimation of Capacity and Required Transmission Power of WCDMA Downlink Based on a Downlink Pole Equation,” inIEEE
Proceed-ings of Vehicular Technology Conference, (Tokyo, Japan), pp. 1002–1005, 2000.
[5] L. Hanzo, C.H. Wong, M.S. Yee: Adaptive wireless transceivers: Turbo-Coded, Turbo-Equalised and Space-Time Coded TDMA, CDMA and OFDM systems, John Wiley-IEEE Press, 2002 (For detailed contents and sample chapters please refer to http://www-mobile.ecs.soton.ac.uk) [6] S. Verd´u,Multiuser Detection, Cambridge University Press, 1998.
[7] L. Hanzo, P. Cherriman, J. Streit: Wireless Video Communications: Second to Third Generation and Beyond, IEEE Press, 2001 (For detailed contents and sample chapters please refer to http://www-mobile.ecs.soton.ac.uk)
[8] R. Steele and L. Hanzo,Mobile Radio Communications, IEEE Press - John Wiley, 2nd ed., 1999. (For detailed contents and sample chapters please refer to http://www-mobile.ecs.soton.ac.uk) [9] L. Hanzo, T.H. Liew, B.L. Yeap: Turbo Coding, Turbo Equalisation and Space-Time Coding, John
Wiley-IEEE Press, 2002
[10] J.S. Blogh, L. Hanzo: The Network Performance of Multi-rate FDD-mode UMTS, VTC 2001 Spring, Rhodes, Greece, 6-9 June, 2001, pp 2455-2459
[11] M. M. L. Cheng and J. C. I. Chuang, “Performance evaluation of distributed measurement-based dynamic channel assignment in local wireless communications,”IEEE JSAC, vol. 14, pp. 698–710, May 1996.
[12] P. J. Cherriman, E. L. Kuan, and L. Hanzo, “Burst-by-burst adaptive joint-detection CDMA/H.263 based video telephony,” inProceedings of the ACTS Mobile Communications Summit, Sorrento,
Italy, pp. 715–720, June 1999.
[13] J.S. Blogh, P.J. Cherriman, L. Hanzo: Dynamic Channel Allocation Techniques Using Adaptive Modulation and Adaptive Antennas, IEEE JSAC, February, 2001, Vol. 19, No. 2, pp 305-311 [14] J. Liberti and T. Rappaport, “A Geometrically Based Model for Line-Of-Sight Multipath Radio
Channels,” inVTC Proceedings, pp. 844–848, 1996.
[15] R. Ertel, P. Cardieri, K. Sowerby, T. Rappaport, and J. Reed, “Overview of Spatial Channel Models for Antenna Array Communications Systems,”IEEE Personal Communications, pp. 10–22, Febru-ary 1998.
[16] R. Kohno,Wireless Communications: TDMA versus CDMA, ch. 1. Spatial and Temporal Com-munication Theory using Software Antennas for Wireless ComCom-munications, pp. 293–321. Kluwer Academic Publishers, 1997.
[17] Y. Ogawa and T. Ohgane, “Adaptive Antennas for Future Mobile Radio,”IEICE Trans. Fundamen-tals, vol. E79-A, pp. 961–967, July 1996.
[18] R. Owen, P. Jones, S. Dehgan, and D. Lister, “Uplink WCDMA capacity and range as a function of inter-to-intra cell interference: theory and practice,” inIEEE Proceedings of Vehicular Technology
Conference, vol. 1, (Tokyo, Japan), pp. 298–303, 2000.