Phosphorus (P) is one of the most important nu-trients for crop production. And a major constitu-ent of the fertilizers required to sustain high-yield agriculture (Vance et al. 2003). In maize production of China, only 15–20% of the P applied which was taken up by plants in the growing season (Zhang et al. 2008) and the rest accumulated in the soil P pools, it becomes immobile and unavailable to plants due to adsorption, precipitation, or conversion to or-ganic forms (López-Bucio et al. 2000). Existing rock phosphate reserves could be exhausted in the next 50–100 years though P is mostly obtained from mined rock phosphate (Cordell et al. 2009). Therefore, it is
important to apply phosphate fertilizer in scientific approaches to improve maintaining the growth of maize and the sustainable development of agricul-ture in China. Situated in the semi-arid region of Northeast China, Jilin province is one of the most important grain production regions of China. The annual maize production directly affects the food security and crop trades of China (Xiong et al. 2007). Drought, infertile soil, and extensive management are the main limiting factors in this area of maize production. In the semi-arid area of Jilin province, the main soil type is light chernozem, which is too sandy and has little clay content.
Evaluation of fertigation technique for phosphorus application
of maize in the semi-arid region of Northeast China
Qian Li
1,2, Chen Xu
3, Caixia Yin
2, Lili Kong
2, Yubo Qin
2, Yunpeng Hou
2,
Hongjun Wang
2, Lanpo Zhao
1*
1Department of Resources and Environment, Jilin Agricultural University, Changchun, P.R. China 2Institute of Agricultural Resources and Environment Research, Jilin Academy of Agricultural
Sciences, Changchun, P.R. China
3Department of Agronomy, Jilin Agricultural University, Changchun, P.R. China
*Corresponding author: [email protected]
Citation: Li Q., Xu C., Yin C.X., Kong L.L., Qin Y.B., Hou Y.P., Wang H.J., Zhao L.P. (2019): Evaluation of fertigation technique for phosphorus application of maize in the semi-arid region of Northeast China. Plant Soil Environ., 65: 401–407.
Abstract: To determine the best phosphorus (P) fertilizer management strategy in chernozem soil in the semi-arid region of Northeast China, a field experiment under film mulched drip irrigation was conducted for two consecu-tive years. Five P application methods were tested, including no P fertilizer applied (P0); P fertilizer one-time basal application (P1); one fertigation one time (P2); fertigation twice (P3) and fertigation four times (P4). The shoot dry matter weight, phosphorus accumulation, yield and POlsen in soil were measured regularly during the maize growing season. The results demonstrated that P fertilizer application methods imposed significant effects on dry shoot matter, the apparent P loss, P fertilizer use efficiency and yield of maize (P < 0.05). The yield, P agrinomic efficiency and P recovery efficiency of P4 treatment were significantly higher than P1 treatment by 4.2, 39.7, and 66.4% across two year. In addition, P4 treatment significantly enhanced the shoot dry matter weight after V12 stage, post-silking P uptake and reduced the apparent P loss. In conclusion, P fertigation and a rational frequency (e.g., fertigation four times) enable to keep the maximum grain yield, the shoot dry matter, and recovery efficiency of P fertilizer (66.4%) though changing agronomic methods for efficient acquisition of P toward a sustainable and productive agricultural fertigation system.
Keywords: phosphorus management; fertigation frequency; maize production; soil P balance; irrigated agriculture
As a consequence, phosphorus in this type of soil is easy to fix. Individual farmers in this area have been used to regard phosphorus fertilizer as the basal fertilizer and flood irrigation once or twice in the growth season. Some large farms or cooperatives adopt drip irrigation to supplement water and fer-tilizer. Generally, nitrogen (N) fertigation has been practiced by large farms for many years. However, phosphate fertilizers are considered unsuitable for fertigation. Soluble P fertilizers are mostly used in drip irrigation system (Munir et al. 2004). Phosphorus fertigation is an effective means of controlling the time and rate of fertilizers and improving fertilizer use efficiency by reducing nutrient losses from leach-ing, and fixation in the soil to less available forms (Zafar et al. 2013). Achieving high maize yields re-quires adequate soil P concentration in the root zone (Bai et al. 2013), matching P supply with P uptake requirements of maize grain yield without excess or deficiency is important for crop yield and mitigation of environment risks (Li et al. 2011).
The study of P fertigation is mostly concentrated in P fertilizer rate or compared to traditional P fertilizer application methods (Latif et al. 1997, Muhmood 2014), however, little research has been done on P fertigation frequency, which was about economic crops, such as eggplant, tomato, bell pepper and so on (Silber et al. 2005, Zhang et al. 2010, Feleafel and Mirdad 2013). And the P fertigation frequency was very high, which was several times a week or even a day. Such high P frequency is not practical for field crops, and approaches should be employed to simplify the production process and to reduce the labor costs.
In the present study, we conducted a 2-year field experiment to investigate the effects of phosphorus fertigation P fertilizer efficiency and yield of maize. Our study aims were as follows: (i) to assess the
responses of maize yield, growth and phosphorus utilization efficiency to P fertigation; (ii) to explore the impact of P fertigation frequency on P uptake, remobilization, and apparent P loss; (iii) to determine the optimum frequency of fertilizer P for maize in the semi-arid region of Northeast China.
MATERIAL AND METHODS
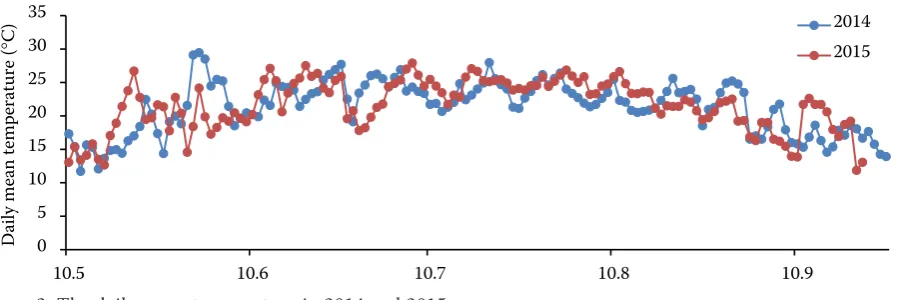
Site description. The two-year field experiments were both conducted in Qian’an Experimental Station (41°52'N, 124°04'E), located at 15 km north of Songyuan City, Jilin province in 2014–2015. Long-term mean temperatures in this area were 16.2–20.9°C. The total rainfall was 341.2 mm and 273.6 mm in 2014 and 2015, respectively (Figures 1 and 2). The soil type at the study site is Chernozem sandy loam. In before sowing. The chemical prop-erties of the 0–30 cm soil layers were analyzed as follows: pH 7.9, 10.45 g/kg organic carbon, 1.32 g/kg total nitrogen, 13.2 mg POlsen/kg, and 104 mg K/kg.
Experimental design. Experiments were conducted in 2014 and 2015 at identical sites. Five treatments were set out: P0 – no P fertilizer applied; P1 –
one-0 5 10 15 20 25 30 35 40
10.5 10.6 10.7 10.8 10.9
Pr
ic
ipit
at
io
n (
m
m
)
[image:2.595.307.531.96.246.2]2014 2015
Figure 1. The precipitation in 2014 and 2015
0 5 10 15 20 25 30 35
10.5 10.6 10.7 10.8 10.9
D
ail
y m
ea
n
te
m
pe
ra
tu
re
(
°
C
) 2014
2015
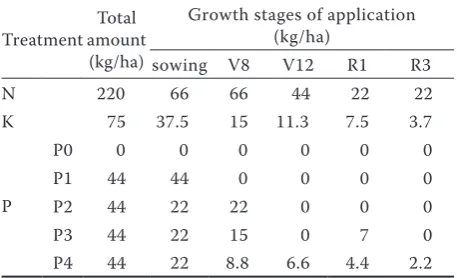
[image:2.595.75.528.600.750.2]time basal application; P2 – fertigation one-time; P3 – fertigations twice and P4 – fertigation four times. Nitrogen fertilizer, phosphorus fertilizer, and potash fertilizer were applied in the forms of urea, water-soluble monoammonium phosphate and water-soluble potassium sulfate. The specific applications of fertilizer in each treatment are sum-marized in Table 1.
A randomized complete block design using three replications for each treatment was employed with a plot area of 40 m2. The maize cultivar was Limin 33, and which sown on 10th May in 2014 and 13th May in 2015 in the identical density of 75 000 plants/ha. Weed growth on the plots was controlled with pre-emergence herbicides and cultivation.
Plants were seeded in broad-narrow ridges pat-tern, with broad and narrow rows’ spaces of 80 cm and 40 cm, respectively. The ridges were covered with the plastic film. Each plot was supplied with an independent unit of the gravity drip irrigation system, which was a drip line placed in the middle of each narrow row, and the emitter space was 30 cm. The total volume of water was supplied with drip irrigation. 20 mm irrigation water was applied be-fore sowing, and at growth stage R1 and R3, while 30 mm irrigation water was applied at growth stage V8 and V12.
Sampling and measurements
Yield, dry matter, and soil POlsen measurements. Plants were harvested at 138 days after sowing (DAS) in 2014, and at 134 DAS in 2015. Grain yield was measured from the center two rows in each plot according to the 15.5% water content. Harvest ear density was calculated from the ears. Grain number per ear and 100-grain weight were calculated from
10 randomly selected ears. At the V6, V8, V12, R1, R3 and R6 stages, two neighboring plants were taken for plant sample analysis. Plants at the R1 and R6 stages were separated into leaves, stalks, and grains. All samples were dried at 105°C for 1 h and then at 75°C for 72 h, prior to weighed the dry weight (DW). Plant total P content was also analyzed by ammonium molybdate vanadate method. Soil POlsen was analyzed in top soil (0–40 cm) for each plot at sowing and final harvest stage (Bao 2000).
Data analysis. Based on the measured shoot dry weight and nutrient content, the following parameters were calculated (Chen et al. 2016):
Harvest index (HI, %) = grain DW at maturity/total DW at maturity × 100 Phosphorus fertilizer recovery efficiency
(PRE, %) = [(UP – U0)/FP] × 100 Phosphorus agricultural efficiency
(PAE, kg/kg) = (YP – Y0)/FP Partial fertilizer productivity of phosphorus (PFPP, kg/kg) = Y/FP
P remobilization amount (kg/ha) = = vegetative P content at silking – – vegetative P content at maturity Contribution to grain P content by P remobilization (%) = (vegetative P content at silking – vegetative P content at maturity)/
grain P content at maturity
Post-silking P uptake (kg/ha) = total P uptake at maturity – total P uptake at silking
Contribution to grain by post-silking P uptake amount (%) = (total P uptake at maturity – total P uptake at silking)/grain P
content at maturity
Apparent P loss (kg/ha) = soil POlsen (start) + + P fertilizer – soil POlsen (end) – plant P take
Where: UP – maize phosphorus uptake in the P application treatments; U0 – no P treatment; YP – grain yield in the P application treatments; Y0 – no P application treatment; FP – P fertilizer application rate; DW – dry weight.
[image:3.595.63.292.615.754.2]Treatment effects were evaluated by two-way analysis of variance using the Statistical Analysis System, with year as the main plot and phosphorus fertilization methods as subplot (SAS Institute 1998). The means were compared using Fisher’s protected least significant difference (LSD) at a probability level of 0.05.
Table 1. Schedule of fertigation
Treatmentamount Total (kg/ha)
Growth stages of application (kg/ha)
sowing V8 V12 R1 R3 N 220 66 66 44 22 22 K 75 37.5 15 11.3 7.5 3.7
P
P0 0 0 0 0 0 0
P1 44 44 0 0 0 0
P2 44 22 22 0 0 0 P3 44 22 15 0 7 0 P4 44 22 8.8 6.6 4.4 2.2
(1)
(2)
(3)
(4)
(5)
(6)
(7)
(8)
RESULTS AND DISCUSSION
Maize yield and yield components. It was ob-served that phosphorus application methods had significantly impact on maize yield, 100-grain weight and grain number, which were greater in 2014 than in 2015 (Table 2), possibly because of the much
[image:4.595.65.531.112.313.2]higher accumulated temperature (Figure 1). With the increase of P fertigation frequency, the yield, 100-grain weight, and grain number of maize showed an increasing tendency. P4 treatment was signifi-cantly higher than P1 treatment by 4.2, 12.1, and 5.2%, respectively. No difference in harvest index was found among these P treatments. The P application Table 2. Maize yield, its component and harvest index
Treatment Yield (kg/ha) Grain number (No./ear) 100 grain weight (g) Harvest index (%)
Phosphorus
P0 10 822d 505c 25.5c 56.5a
P1 12 082c 528b 26.7b 56.5a
P2 12 225bc 540b 27.3ab 57.0a
P3 12 401ab 572a 27.9ab 57.0a
P4 12 583a 592a 28.1a 57.5a
Year
2014 12 356a 570a 27.9a 57.7a
2015 11 688b 525b 26.5b 56.0b
Source of variation
Year (Y) ** ** ** *
P application methods (P) ** ** ** ns
Y × P ns ns ns ns
Within different phosphorus (P) treatments, numbers followed by different letters indicate significant differences (P < 0.05). ns – not significant; *P < 0.05; **P < 0.01. P0 – no P fertilizer applied; P1 – one-time basal application; P2 – fertigation one-time; P3 – fertigations twice; P4 – fertigation four times
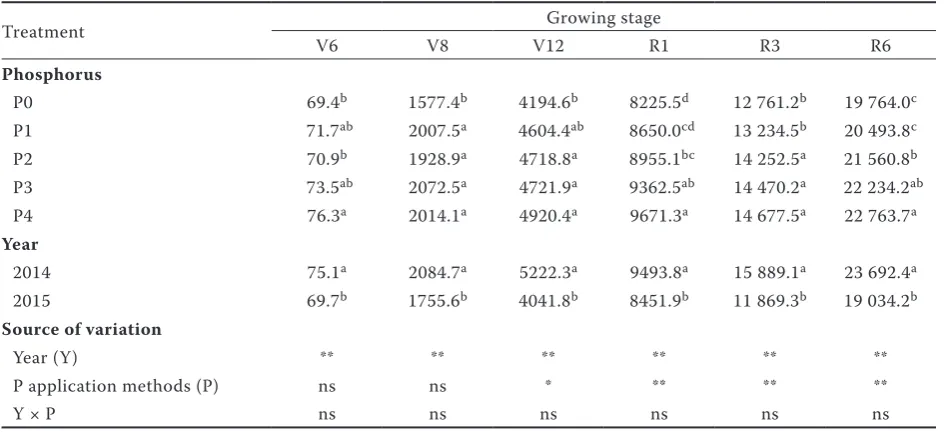
Table 3. Shoot dry matter accumulation (kg/ha)
Treatment Growing stage
V6 V8 V12 R1 R3 R6
Phosphorus
P0 69.4b 1577.4b 4194.6b 8225.5d 12 761.2b 19 764.0c
P1 71.7ab 2007.5a 4604.4ab 8650.0cd 13 234.5b 20 493.8c
P2 70.9b 1928.9a 4718.8a 8955.1bc 14 252.5a 21 560.8b
P3 73.5ab 2072.5a 4721.9a 9362.5ab 14 470.2a 22 234.2ab
P4 76.3a 2014.1a 4920.4a 9671.3a 14 677.5a 22 763.7a Year
2014 75.1a 2084.7a 5222.3a 9493.8a 15 889.1a 23 692.4a
2015 69.7b 1755.6b 4041.8b 8451.9b 11 869.3b 19 034.2b Source of variation
Year (Y) ** ** ** ** ** **
P application methods (P) ns ns * ** ** **
Y × P ns ns ns ns ns ns
[image:4.595.63.538.501.717.2]methods × year interaction was not significant for all these parameters.
P fertigation improved the growth and yield of maize. Similar results were reported by Wanget al. (2017) and Zafar et al. (2013) that maize and wheat yield of phosphorus fertigation treatment in more than one split gave a higher yield than that obtained from a single application. It was because of that P fertigation allows placement and amount of P ferti-lizer directly into the plant root zone during critical times of nutrient demand (Earl and Jury 1977), this directed application of P can result in more efficient
plant use of the fertilizer than when P is band-applied (Mikkelsen 1989).
[image:5.595.64.532.127.357.2]Maize shoot dry matter weight. The ANOVA results indicated that the P fertigation imposed a significant effect on shoot dry matter weight (DW) after V12 stage (Table 3), which was similar to the previous results (Muhmood 2014). DM of P4 treat-ment at R1, R3, and R6 stages increased by 11.8, 10.9, and 11.1%. There was no significant difference between P3 and P4 treatments. The performance of maize shoot dry matter weight was consistent with the yield.
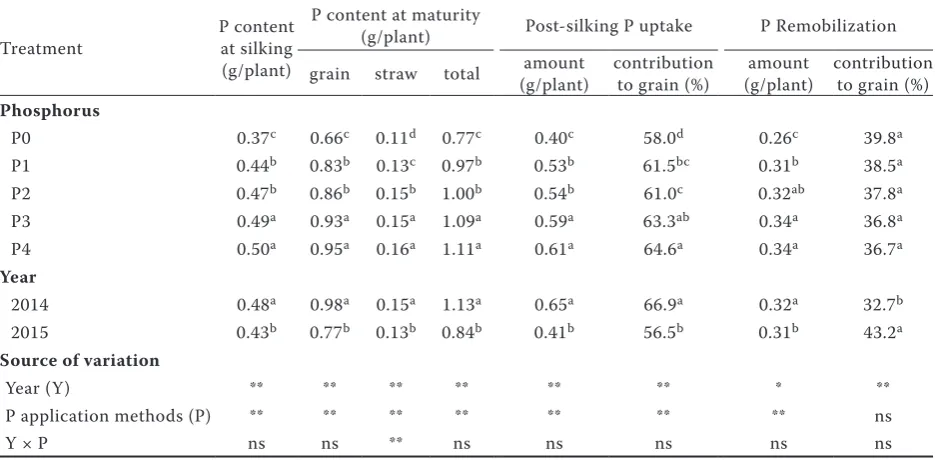
Table 4. Pre- and post-silking phosphorus (P) uptake, P remobilization and P remobilization efficiency of maize grown in 2 years
Treatment P content at silking (g/plant)
P content at maturity
(g/plant) Post-silking P uptake P Remobilization grain straw total (g/plant)amount contribution to grain (%) (g/plant)amount contribution to grain (%)
Phosphorus
P0 0.37c 0.66c 0.11d 0.77c 0.40c 58.0d 0.26c 39.8a
P1 0.44b 0.83b 0.13c 0.97b 0.53b 61.5bc 0.31b 38.5a
P2 0.47b 0.86b 0.15b 1.00b 0.54b 61.0c 0.32ab 37.8a
P3 0.49a 0.93a 0.15a 1.09a 0.59a 63.3ab 0.34a 36.8a
P4 0.50a 0.95a 0.16a 1.11a 0.61a 64.6a 0.34a 36.7a Year
2014 0.48a 0.98a 0.15a 1.13a 0.65a 66.9a 0.32a 32.7b
2015 0.43b 0.77b 0.13b 0.84b 0.41b 56.5b 0.31b 43.2a Source of variation
Year (Y) ** ** ** ** ** ** * **
P application methods (P) ** ** ** ** ** ** ** ns
Y × P ns ns ** ns ns ns ns ns
Within different P treatments, numbers followed by different letters indicate significant differences (P < 0.05). ns – not significant; *P < 0.05; **P < 0.01. P0 – no P fertilizer applied; P1 – one-time basal application; P2 – fertigation one-time; P3 – fertigations twice; P4 – fertigation four times
Table 5. Soil phosphorus (P) residue, total P input in two years and apparent P loss (kg/ha)
Treatment POlsen content in 0–40 cm soil Total P input Total P uptake Apparent P loss before sowing of 2014 at harvest of 2015
P0 55.8 15.7c 0 115.9c –75.8e
P1 55.8 18.7c 200 144.9b 92.2a
P2 55.8 22.7b 200 150.4b 82.7b
P3 55.8 19.3bc 200 163.0a 73.5c
P4 55.8 36.4a 200 166.7a 52.8d
[image:5.595.63.532.613.714.2]Pre- and post-silking P uptake, P remobilization, and its contribution to the grain. Phosphorus ap-plication methods significantly affected post-silking P uptake amount, P remobilization amount, and con-tribution to grain by post-silking P uptake (Table 4). Increasing fertigation frequency could increase the P accumulation after silking and P remobilization. The 57–66.8% of phosphorus in grain came from post-silking P uptake across the two years. This result was line with the previous findings of Bender et al. (2013) that optimal maize production is dependent on the season-long supply of P, and the majority of total uptake occurred post-silking by 56%. Therefore, the improved plant P accumulation was mainly be-cause of the increased post-silking P uptake, which was a consequence of high fertigation frequency and delayed P fertilizer application.
Apparent P loss. Phosphorus application methods affected apparent P loss and POlsen content at harvest 0–40 cm soil profile (Table 5). In detail, the appar-ent P loss of P4 treatmappar-ent was significantly lower than the others. However, the POlsen content was dramatically increased. P4 treatment could reduce apparent P loss remarkably, while its POlsen content at
harvest maintained at an appropriate level to balance soil fertility. The repeated application of mineral P fertilizer increases the soil available P concentration (Ziadi et al. 2013). All these processes led to fixation the delayed fixation when the fertilizer was applied through fertigation as plant absorbed this nutrient quickly and directly from the soil solution.
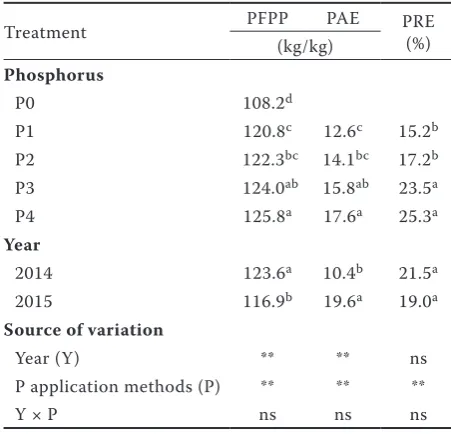
Phosphorus fertilizer recovery efficiency, phospho-rus agricultural efficiency, and phosphophospho-rus particle fertilizer productivity. The data present in Table 6 indicated that P application methods significantly affect the PFPP, PAE, and PRE. P2 to P4 fertigation treat-ments increased by 1.2–4.1, 18.9–39.7 and 13.2–66.4%, respectively, compared with P1 treatment. The PRE of P3 and P4 were 23.6% and 25.4% across two years, which were significantly higher than P1 treatment. The P application methods × year interaction was not significant for PFPP, PAE, and PRE.
Several studies have shown that P fertigation was particularly effective in increasing the efficiency of P fertilizer (Bar-Yosef et al. 1989, Ben-Gal and Dudley 2003, Wang et al. 2017). Yue et al. (2013) considered the P use efficiency of the one-time basal application was lower than fertigation treatments, which may be the direct cause of low utilization of fertilizer due to the unsynchronized of water and fertilizer. More frequent fertigation increases labile P, enhance P diffusion across the sectional area for diffusion increases, and tortuosity of the path is decreased.
In this study, compared with the farmer practice management – single basal application (P1), the yield of P fertigation four times (P4) increased by 4.12% and the PRE increased by 66.7% on average two years. On the other hand, P4 treatment also increased the shoot dry matter after V12 stage, P accumulation at mature and post-silking P uptake, reduced apparent P loss significantly. In conclusion, the P fertigation four times (elongation, bell, silking and milking stage) could be a useful, economical and environment-friendly technique to increase maize yield and P use efficiency in the field crop.
Acknowledgment
We are grateful to Dr. Jiagui Xie for valuable com-ments on experiment design and implementation.
REFERENCES
[image:6.595.62.288.474.691.2]Bai Z.H., Li H.G., Yang X.Y., Zhou B.K., Shi X.J., Wang B.R., Li D.C., Shen J.B., Chen Q., Qin W., Oenema O., Zhang F.S. (2013): The
Table 6. Partial fertilizer productivity of phosphorus (PFPP), phosphorus agricultural efficiency (PAE) and phosphorus fertilizer recovery efficiency (PRE)
Treatment PFPP PAE PRE (%) (kg/kg)
Phosphorus
P0 108.2d
P1 120.8c 12.6c 15.2b
P2 122.3bc 14.1bc 17.2b
P3 124.0ab 15.8ab 23.5a
P4 125.8a 17.6a 25.3a Year
2014 123.6a 10.4b 21.5a
2015 116.9b 19.6a 19.0a Source of variation
Year (Y) ** ** ns
P application methods (P) ** ** **
Y × P ns ns ns
critical soil P levels for crop yield, soil fertility and environmental safety indifferent soil types. Plant and Soil, 372: 27–37.
Bao S.D. (2000): Soil and Agricultural Chemistry Analysis. 3rd
Edi-tion. Beijing, China Agricultural Press, 264–271.
Bar-Yosef B., Sagiv B., Markovitch T. (1989): Sweet corn response to surface and subsurface trickle phosphorus fertigation. Agron-omy Journal, 81: 443–447.
Bender R.R., Haegele J.W., Ruffo M.L., Below F.E. (2013): Nutrient up-take, partitioning, and remobilization in modern, transgenic insect-protected maize hybrids. Agronomy Journal, 105: 161–170. Ben-Gal A., Dudley L.M. (2003): Phosphorus availability
un-der continuous point source irrigation. Soil Science Society of America Journal, 67: 1449–1456.
Cordell D., Drangert J.-O., White S. (2009): The story of phospho-rus: Global food security and food for thought. Global Environ-mental Change, 19: 292–305.
Earl K.D., Jury W.A. (1977): Water movement in bare and cropped soil under isolated trickle emitters: II. Analysis of cropped soil experi-ments1. Soil Science Society of America Journal, 41: 852–856. Feleafel M., Mirdad Z.M. (2013): Optimizing the nitrogen,
phos-phorus and potash fertigation rates and frequency for eggplant in arid regions. International Journal of Agriculture and Biology, 15: 737–742.
Chen Q.W., Mu X.H., Chen F.J., Yuan L.X., Mi G.H. (2016): Dynam-ic change of mineral nutrient content in different plant organs during the grain filling stage in maize grown under contrasting nitrogen supply. European Journal of Agronomy, 80: 137–153. Latif A., Alam S.M., Hamid A., Iqbal Z. (1997): Relative efficiency of
phosphorus applied through broadcast incorporation, top dressing and fertigation to crops. Pakistan Journal of Soil Science, 13: 15–18. Li H., Huang G., Meng Q., Ma L., Yuan L., Wang F., Zhang W., Cui
Z., Shen J., Chen X., Jiang R., Zhang F. (2011): Integrated soil and plant phosphorus management for crop and environment in China. A review. Plant and Soil, 349: 157–167.
López-Bucio J., de la Vega O.M., Guevara-García A., Herrera-Es-trella L. (2000): Enhanced phosphorus uptake in transgenic to-bacco plants that overproduce citrate. National Biotechnology, 18: 450–453.
Mikkelsen R. (1989): Phosphorus fertilization through drip irriga-tion. Journal of Production Agriculture, 3: 279.
Muhmood A. (2014): Fertigation helps in increasing phosphorus use efficiency of wheat (Triticum aestivum L.) compared to
con-ventional method. Pakistan Journal of Biological Sciences, 51: 587–593.
Munir J.M., Hammouri A., Ferdows A.E. (2004): Phosphorus fer-tigation and preplant conventional soil application of drip irri-gated summer squash. Journal of Agronomy, 3: 162–169. SAS Institute (1998): SAS User’s Guide: Statistics. Cary, SAS
In-stitute.
Silber A., Bruner M., Kenig E., Reshef G., Zohar H., Posalski I., Ye-hezkel H., Shmuel D., Cohen S., Dinar M., Matan E., Dinkin I., Cohen Y., Karni L., Aloni B., Assouline S. (2005): High fertigation frequency and phosphorus level: Effects on summer-grown bell pepper growth and blossom-end rot incidence. Plant and Soil, 270: 135–146.
Vance C.P., Uhde-Stone C., Allan D.L. (2003): Phosphorus acquisi-tion and use: Critical adaptaacquisi-tions by plants for securing a nonre-newable resource. New Phytologist, 157: 423–447.
Wang Z., Li J., Hao F., Li Y. (2017): Effects of phophorus fertigation and lateral depths on distribution of Olsen-P in soil and yield of maize under subsurface drip irrigation. In: Proceeding of the 2017 Spokane, Washington July 16-July 19.
Xiong W., Lin E., Ju H., Xu Y.L. (2007): Climate change and criti-cal thresholds in China’s food security. Climatic Change, 81: 205–221.
Yue H.L., Zhang S., Meng M.L., Wang L.L., Fan X.Q. (2013): Ef-fects of phosphorus application amount on production quality and phosphorus fertilizer use efficiency of coated drip irrigation potato. Journal of Inner Mongolia Agricultural University, 34: 40–45. (In Chinese)
Zafar I., Yaqub M., Akram M. (2013): Phosphorus fertigation: A technique for enhancing P fertilizer efficiency and yield of wheat and maize. Pakistan Journal of Soil Science, 32: 146–151. Zhang T.Q., Tan C.S., Liu K., Drury C.F., Papadopoulos A.P.,
Warn-er J. (2010): Yield and economic assessments of fWarn-ertilizWarn-er nitro-gen and phosphorus for processing tomato with drip fertigation. Agronomy Journal, 102: 774–780.
Zhang W.F., Ma W.Q., Ji Y.X., Fan M.S., Oenema O., Zhang F.S. (2008): Efficiency, economics, and environmental implications of phosphorus resource use and the fertilizer industry in China. Nutrient Cycling in Agroecosystems, 80: 131–144.
Ziadi N., Whalen J.K., Messiga A.J., Morel C. (2013): Chapter two – Assessment and modeling of soil available phosphorus in sus-tainable cropping systems. Advances in Agronomy, 122: 85–126.