Published in: Acta Materialia, Vol. 47, (14), pp. 3841-3853
MICROSTRUCURE AND STRENGTHENING OF
AL-LI-CU-MG ALLOYS AND MMCS:
I. ANALYSIS AND MODELLING OF MICROSTRUCTURAL CHANGES
M.J. Starink, P. Wang, I. Sinclair and P.J. Gregson
Dept. of Engineering Materials, University of Southampton, Southampton S017 1BJ, UK Keywords: precipitation, DSC, Al-Li-Cu-Mg, MMC, GPB zones
Abstract
A complete and detailed analysis of the microstructural development during ageing in an 8090 (Al-2.3Li-1.2Cu-1Mg-0.1Zr) alloy, an 8090/20wt%SiCp MMC, an Al-1.5Li-Cu-Mg MMC and an Al-Cu-Mg MMC (all with similar Cu and Mg contents) has been performed. Volume fractions of all precipitates relevant for precipitation strengthening of the alloys (δ' phase, S' phase and GPB zones) have been determined using a recently derived method based on differential scanning calorimetry (DSC). The volume fractions have subsequently been successfully fitted using a novel model for transformation kinetics. The sizes of these precipitates have been analysed using newly derived expressions consistent with the latter model. As a result of dislocation generation around misfitting SiC particles the volume fractions of both GPB zones and S' phase depend strongly on the presence of these particles. Also the amount of Li present in the alloys influences the volume fractions of the phases significantly. The sizes of S' are similar for the four alloys.
1. Introduction
1.1 Aims
In order to be able to apply strengthening models, reliable quantitative data on the microstructural parameters that determine the strengthening needs to be gathered. These microstructural parameters are: volume fractions of the precipitates, sizes of the precipitates, distribution of the precipitates, amounts of atoms in solid solution, grain and subgrain sizes and texture. In the present paper we will present a complete and detailed analysis of the microstructural development of 4 reinforced and unreinforced Al-Li-Cu-Mg type alloys during isothermal ageing. The microstructural development will be modelled using both recently derived kinetic models [6,7,8] and new developments of these models which are specially derived for the present paper. In a companion paper [5] the results of the microstructural analysis and modelling work presented in the present paper will be used to model the strength development for a wide range of aged conditions.
1.2 Precipitation in Al-Li-Cu-Mg alloys
In commercial Al-Li-Cu-Mg alloys, precipitation strengthening is the main strengthening mechanism, and the hardening of the 8090 alloys and the 8090 alloys with reduced Li content studied in the present paper is interpreted in terms of two precipitation sequences [9,10,11,12,13,14,15]. One precipitation sequence involves Li:
Li in Al-rich phase → δ' → δ
where δ' is an L12 ordered phase (Al3Li), fully coherent with the Al matrix and δ is the equilibrium Al-Li phase (AlLi, BCC structure), which forms mainly at grain boundaries [16]. In addition, L12 ordered precursor structures to δ' can form, probably via congruent ordering or spinodal decomposition [17,18]. The second precipitation sequence involves Cu and Mg and, on the basis of X-ray diffraction (XRD) [19], atom probe field ion microscopy (APFIM) and transmission electron microscopy (TEM) evidence [20,21,22], is represented as:
Cu,Mg in Al-rich phase → (co-)clusters → GPB zones → S' → S
where the cluster stage involves Mg-Mg, Cu-Cu as well as Cu-Mg clusters [21], GPB zones are Cu and Mg containing Guinier-Preston zones [23,24], S' and S are the orthorhombic Al2CuMg phase (see Ref. [25])*. In the literature on monolithic Al-Cu-Mg alloys some uncertainty and controversy concerning the nature of the zones/clusters exists. Mg-Mg, Cu-Cu as well as Cu-Mg clusters have been identified in an Al-Cu-Mg alloy [21] by APFIM. XRD data has been interpreted as indicating the formation of cylindrical structures with diameter about 1-2 nm and length in the order of 10 nm which were termed GPB1 zones [20], but Small Angle X-ray Scattering (SAXS) has been
* The precipitates which are generally indicated by S' are not a separate phase: they are a slightly strained
interpreted in terms of disk shaped structures with radius of about 1 nm which were termed GPB zones [24], and mottled appearance of underaged Al-Cu-Mg alloys in conjunction with the appearance of diffraction rings in the selected area diffraction pattern has been related to GPB2 zones [22]. (Other, often conflicting, literature data on these zones and clusters has been reviewed in Ref. [22].) However, no direct TEM observations of any of these zones have been reported. In the present work on Al-Cu-Mg and Al-Li-Cu-Mg alloys Cu-Mg containing (pre-)precipitates are analysed using TEM and DSC, and, as shown before [12,13], this yields no evidence for different cluster/zone precipitate stages. Thus we will refer to the Cu-Mg containing pre-precipitates/clusters as GPB zones. It is further noted that the distinct S'' phase, which has been detected by some authors [26,27], has not been confirmed by others [20,21,25].
In addition to the binary and ternary phases, in quaternary alloys, the icosahedral I phase (proposed composition Al6Cu(Li,Mg)3, see Ref. [28]), forms on grain boundaries [29]. In quaternary MMCs it forms on interfaces of ceramic reinforcing particles and matrix, giving rise to Li depletion of the Al-rich phase surrounding the ceramic particles, which results in the formation of precipitate free zones around these particles (PFZs) [12].
Table 1: Compositions of the matrix alloys (in weight percent).
Alloying addition Li Cu Mg Zr Al
8090 monolithic 2.34 1.25 1.04 0.11 remainder
Al-Cu-Mg-0Li MMC 0 1.2 0.76 0.1 remainder
Al-Cu-Mg-1.5Li MMC 1.49 1.22 0.75 0.1 remainder
8090 MMC 2.4 1.16 0.75 0.1 remainder
2. Experimental
The alloys were produced as sheet at the Structural Materials Centre, DERA Farnborough, UK via a powder metallurgical route (see Ref. 30). For the metal matrix composites (MMCs), SiC particles (average size 3 µm) were mixed with alloy powder to obtain a mixture with 20 wt% of SiC. For all alloys the powders were vacuum degassed for 24 hours at 545 °C. The degassed billets were consolidated by hot isostatic pressing (HIP) at 530 °C with a 104 MPa pressure. After removing the can material by machining, the billets were pre-heated and forged to a thickness of 25 mm. Finally the forged plates were rolled at 510°C to a sheet thickness of about 2.3 mm using reductions of 10-15 % per pass. The compositions of the matrix of the alloys are given in Table 1. Solution treatments of 0.5 hour at 530°C were employed and were terminated by a direct quench into water at room temperature. The samples to be used for quantitative analysis of the microstructure were transferred to an oven at 170°C ± 1.5 °C within 1.5 minutes after the quench. Ageing times ranged between 0.17 h (10 min) and 168 h (7 days). All thermal treatments were terminated by a quench into water at room temperature.
DSC experiments were performed on solution treated and solution treated and aged samples of all 4 alloys. For these experiments, disc shaped samples, with a thickness of about 0.8 mm and a diameter of 5 mm, were prepared prior to heat treatment by grinding and punching. The DSC experiments were started 5 min after completion of the heat treatment using a Shimadzu DSC-50. For further details of experiments and analysis methods see Refs. [4,12,31]. All curves are corrected for the difference between the heat capacity of the sample and reference, i.e. curves represent heat flows caused by reactions (see Ref. [12]).
For TEM, monolithic specimens were ground to about 300 µm prior to electropolishing in 20% nitric acid in methanol at -20 °C. Composite specimens were ground to 100 µm, dimpled to a remaining thickness of about 25 µm and subsequently ion-bean milled/polished using a GATAN PIPS. The foils were examined in a JEOL 2000FX Transmission Electron Microscope operated at 200 kV.
3 Transformation kinetics
In the modelling of the evolution of the volume fractions of the phases present in our alloys we will use a recently developed kinetic model [6,7,8] which is briefly reviewed in section 3.1. To be able to model the evolution of the sizes of the precipitates this model has been extended to predict the average dimensions of the precipitates. This new work is presented in detail in section 3.2.
3.1 Fraction transformed
It is assumed that, similar to the JMAK model (see e.g. Refs. [32,33]), the transformed volume, Vp, around a single nucleus grows according to:
[
]
Vp =A G t z( − ) m (1)
where m is a constant which is termed the growth exponent [7,34], G is the (average) growth rate, A is a constant and z is the time at which the nucleus is formed. For diffusion controlled precipitation reactions, the transformed volume is defined to be the volume of an imaginary fully depleted area around a precipitate (with the rest of the matrix undepleted). If all transformed volumes grow without impinging (the so-called extended volume approach), the total transformed volume is given by Vext(t). To obtain the fraction transformed, α, impingement is taken into account by using [6,7]:
α α
η
η
= −⎛ + ⎝
⎜ ⎞
⎠ ⎟
−
1 ext 1
i
i
(2)
on in the transformation (so-called ‘site saturation’). For both cases a single general expression can be derived [6,7]:
αext = [k(T)t]n (3)
with k(T) a temperature dependent factor determined by A, G and I, or (for the site saturation case) A, G and the density of nuclei, ρN. For constant nucleation rate n = m +1, whilst for zero nucleation rate n = m. We will take k(T) as:
k T k E
k T
o iso
B
( )= exp⎡− ⎣
⎢ ⎤
⎦
⎥ (4)
where Eiso denotes the effective activation energy for isothermal experiments, ko is a constant. 3.2 Precipitate sizes
Nuclei grow as a result of two processes: A) growth by transformation of the parent phase and B) growth by dissolution of other nuclei. Process A can be readily incorporated in the model described in the previous section, but process B, which depends on interfacial energy, can only be incorporated in this model by making additional assumptions. In this section both processes will be modelled.
In process A the total number of growing nuclei will be constant and the average volume of a single nucleus when no coarsening occurs is simply given by:
N nc N v ρ α
= (5)
where ρN is the density of growing nuclei. If the nuclei grow in 3 dimensions (i.e. for diffusion controlled reactions with m = 1.5) and retain their original shape, the size of the nucleus in a particular direction, l, grows according to:
( )
133 1 ⎟⎟ ⎠ ⎞ ⎜⎜ ⎝ ⎛ = = N nc nc N
nc v A A
l
ρ α
(6)
where Anc is a constant which depends on the aspect ratio of the nuclei.
max N
ext co N v
ρ α
= (7)
where max N
ρ is the maximum density of growing nuclei.
In practice the size of the nuclei will be intermediate between the two limiting cases described by Eqs. 5 and 7. In the present paper we will not analyse particle growth by dissolution of neighbouring particles in detail and for our present purpose it will be sufficient to simply assume that coarsening can be taken account of by describing the growth of nuclei by a linear combination of the equations above, i.e.:
co N co nc N co
N p v p v
v =(1− ) + (8)
where pco is a constant which will be termed the relative coarsening ratio.
If the nuclei grow in 3 dimensions and retain their original shape the size of the nucleus in any particular direction, l, grows according to:
( )
13N co v A
l = (9)
100 nm
[image:6.595.114.487.356.722.2]Table 2: Observed microstructural features.
s.d. = standard deviation of δ' size distribution, - = not observed/ not applicable
Al-Cu-Mg MMC Al-Cu-Mg-1.5Li MMC
8090 MMC monolithic 8090
ageing time (h) 1 8 168 1 8 168 1 8 168 1 8 168
δ' diameter (nm) - - - 4.1 11.2 27.7 6.2 11.1 20 s.d. (nm) - - - 1.0 2.4 6.0 1.3 2.7 6.1 S' radius* (nm) 2* 4.2 6.4 2.8** 4.2 10 - 2.1 6.3 3 4.5 6.5
length* (nm) 21 43 207 24 36 147 - 42 119 70 91 140
PFZ around SiC (nm) - - - - - - 5 58 122 - - -
* For heterogeneously nucleated S'.
** Calculated from the S’ length by assuming that the aspect ratio does not change between 1 and
8 h ageing.
This expression will be used in those cases where growth and transformation occur concurrently (e.g. S' formation). However, when transformation is completed and growth occurs by coarsening only (e.g. δ' formation) the classical LSW coarsening theory (see e.g. Ref. [35] and references therein) is applied:
t k r
r − o = co 3 3
(10) where r is the average radius of the precipitates, ro is the average initial radius of the precipitates
and kco is the rate constant for coarsening.
4 Results
4.1 Precipitates and their sizes
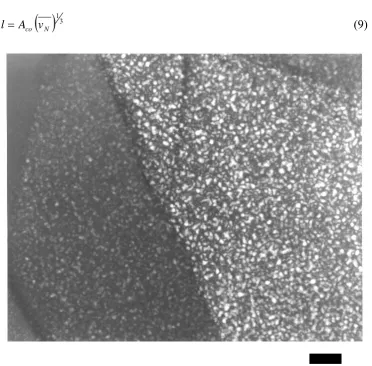
distribution of very fine rod-shaped structures with a diameter of about 1.5 nm, and length of about 30 nm was just resolvable [12], end-on views of these structures are shown in Fig. 4. The selected area diffraction (SAD) (Fig. 4a) shows streaks between the strong superlattice spots due to the L12 ordered δ' with fainter intensity maxima. The fainter intensity maxima are identified as being due S' (see e.g. SAD patterns of S' in Refs. [21,36]). Hence, the very fine rod-shaped structures are S' precipitates which have nucleated homogeneously, i.e. in a manner different from the coarser S' precipitates that decorate dislocations.
With the exception of the β' phase and the oxygen containing dispersoids all phases were observed to grow during exposure. The average sizes of the phases were determined from the TEM micrographs taking account of finite sample thickness and orientation of the phases with respect to the beam. Results are presented in Table 2.
200 nm
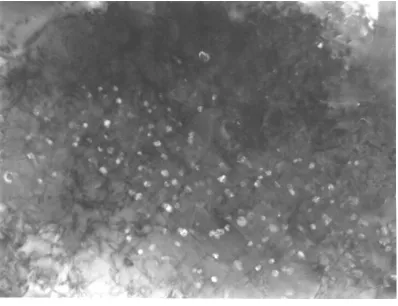
Fig. 2 TEM micrograph of β' precipitates in the Al-1.5Li-Cu-Mg MMC aged for 7 days at 170ºC. Note that the β' precipitates are clustered into a band of about 0.1 μm (Dark Field,
B=[013])
[image:8.595.100.499.278.584.2]100 nm
4.2 Volume fractions of precipitates measured using DSC
To obtain the volume fractions of the different phases present in the alloys we will employ a method which is based on the heat evolutions due to the precipitation of the phases as measured by DSC. The method is outlined in detail elsewhere [13] and a brief, generalised description is given below.
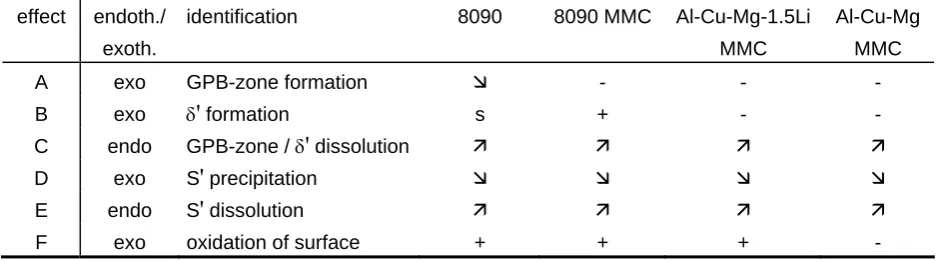
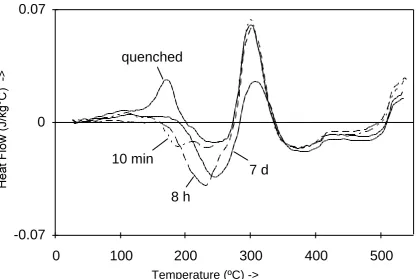
The DSC curves obtained at different heating rates for the quenched monolithic 8090 are presented in Fig. 5. The identification of the effects, as discussed previously [12], is summarised in Table 3. The magnitude of the effects varies between the alloys and depends on ageing time (see Fig. 6), the latter is a result of precipitation of the different phases during isothermal ageing. For instance, for all four alloys, the S' precipitation effect (effect D) decreases with ageing time, reflecting S' precipitation during ageing at 170ºC. These changes in magnitude of the precipitation effects are summarised in Table 3.
Table 3 Identification of the effects observed in DSC runs of 8090 alloys.
effect endoth./ exoth.
identification 8090 8090 MMC Al-Cu-Mg-1.5Li
MMC
Al-Cu-Mg MMC
A exo GPB-zone formation Ì - - -
B exo δ' formation s + - -
C endo GPB-zone / δ' dissolution Ê Ê Ê Ê
D exo S' precipitation Ì Ì Ì Ì
E endo S' dissolution Ê Ê Ê Ê
F exo oxidation of surface + + + -
Key: Ê effect present, and magnitude increases with ageing Ì effect present, and magnitude decreases with ageing
+ effect is present and about constant - effect is not present
s magnitude of effect is very small and strongly heating rate dependent
In order to calculate the heat due to the formation/dissolution of one specific precipitate overlap between effects has to be corrected for. Such correction methods have been outlined previously [13] and they will be used throughout this work. These overlap corrected values of the heat evolution of the phases/zones will be referred to as ΔQS',p (heat evolution due to S' precipitation), ΔQδ',d (heat
evolution due to δ' dissolution), ΔQGPB,d (heat evolution due to GPB-zone dissolution), etc. The amounts of GPB zones and δ' phase present can be obtained from:
x Q
H GPB
GPB d
GPB
= Δ Δ
,
[image:10.595.52.521.370.501.2]x Q H
d
′ ′
′
=
δ δ
δ
Δ Δ
,
(12)
where ΔHGPB and ΔHδ' are the heats of formation of GPB zones and δ' phase, respectively. Due to
overlap with the exothermic effect caused by the formation of Li containing oxides or nitrides on the surfaces of the DSC samples the S' dissolution effect can not be measured accurately. Hence, the amount of S' formed during ageing is derived from the heat effect due to S' precipitation (effect C) using:
x Q WQ Q t
H S
S p S p
S
′ ′ ′
′
= Δ −Δ
Δ
, ( ) , ( )
(13)
This expression is valid because a) TEM worked showed that in the WQ condition no S' is present (see previous section), and b) the end temperature of the S' precipitation is independent of isothermal ageing time (Fig. 6), which indicates that at the end of the S' precipitation effect in the DSC run (at 330ºC in Fig. 6) the amount of S' phase present in the DSC samples is independent of isothermal ageing time.
Using this method the amount of phases present in the 4 alloys is determined and data points are presented in Fig. 7†.
Fig. 4 (next page) Bright field TEM micrographs of the monolithic 8090 alloy aged for 7 days at 170ºC showing a) end-on views of the homogeneously nucleated rod-shaped S' precipitates as well as the larger (diameter about 20 mm) δ' precipitates, and b) end-on views of
homogeneously nucleated rod-shaped S' precipitates with δ' precipitates and coarse S' precipitates on a dislocation. B=[100]
† In the calculation it has been assumed that δ' is Al
3Li and S' is Al2CuMg. Little is known about the
50 nm
Temperature (°C) ->
-0.10 0.1
0 100 200 300 400 500 2 K/min
10 K/min
40 K/min
A
B
C
D
E
F
Fig. 5 DSC curves of the solution treated and quenched monolithic 8090 alloy at varying heating rates.
-0.07
0
0.07
0 100 200 300 400 500
quenched
10 min
8 h
7 d
Temperature (ºC) ->
[image:13.595.100.497.101.346.2] [image:13.595.92.509.427.706.2]5 Discussion
5.1 Identification of precipitates.
The results of the determinations of the volume fractions of strengthening precipitates will be used to analyse the strengthening of the four alloys, and, hence, it is important to analyse the accuracy of the presented results. The precipitation sequence in our alloys is analysed first and the identification of the DSC peaks is subsequently discussed.
Although a total of 5 different stages for precipitation of Cu and Mg in Al-Cu-Mg alloys with Cu:Mg ratios close to unity are given in the literature, only two have been detected in the present alloys. Consequently the present data can be interpreted using the precipitation sequence:
Cu,Mg in Al-rich phase → GPB zones → S'/S
The identifications of the various peaks and analysis methods used are consistent with the majority of published work on Al-Li-Cu-Mg and Al-Cu-Mg alloys (see e.g. Refs. [10,11,12,37,38,39]). The main reasons supporting our interpretation are the following:
i. TEM, HREM, small angle X-ray scattering (SAXS) and anomalous SAXS (ASAXS) experiments on 8090 and other Al-Cu-Mg-Li alloys have shown that at low temperature (<150ºC) δ’ phase and GPB zones are formed [23,24,40].
ii. Reduction of the Li content in the 8090 MMC causes effect B to disappear [12], hence effect B is due to δ’ phase formation, and, consequently, effect A is due to GPB formation.
iii.In Al-Cu-Mg alloys the GPB zone formation effect is drastically reduced as a result of the introduction of ceramic particles [39]. In 8090 alloys introduction of ceramic particles causes a similar change to effect A, further suggesting that effect A is due to GPB formation.
iv.In quenched monolithic 8090, considerable amounts of δ' phase with diameter of about 4 nm are present. During subsequent artificial ageing these δ' precipitates follow a t1/3 coarsening law [12]. This indicates that in the monolithic 8090 alloy, the δ' phase precipitates during the quench and/or at room temperature, whilst little additional δ’ phase precipitates during artificial ageing
and that δ' particle coarsening occurs. This indicates that the dominant exothermic effect observed in a DSC run on water quenched (WQ) 8090 in the temperature range 20-250ºC should be attributed to GPB-zone formation (which is hard to detect by TEM) rather than δ’ phase
formation (which is omni-present, and readily imaged using TEM, for all quenched and aged conditions of WQ 8090). In support of this interpretation it has been shown [41] that in DSC experiments on a WQ + artificially aged + reversion treated (at 285ºC) monolithic 8090 alloy, two exothermic peaks appear in the temperature range 20-250ºC. Again the first is interpreted to be due to GPB-zone formation whilst the second is due to δ' phase precipitation which occurs in this sample because δ’ phase has dissolved during the reversion treatment [42].
On the basis of TEM work on 8090 samples heated at 10ºC/min to 3 different temperatures (105, 130 and 180ºC) and subsequently held isothermally for 30 min, Chen et al. [14] proposed that peak A is due to δ’ formation and that peak B is due to GPB zone formation (i.e. the reverse of our
states achieved during continuous DSC heating to 105, 130 and 180ºC and it can be shown (using the simple model in Appendix 2 in Ref. [12]) that the states in these 3 samples correspond roughly with states obtained after DSC heating at 10K/min to 150ºC, 180ºC and 240ºC. The latter two samples correspond to a state in which both the GPB and δ' formation reactions have progressed significantly, and only the first sample (heated to 105ºC and held for 30 min) can have any relevance in discriminating between the two interpretations. The key findings of Chen et al. for this sample are: δ’, which is widespread in the as quenched condition, increases in size during holding at
105ºC, and no GPB zones can be detected with TEM after heating to 105ºC. It is noted that the former observation does not prove that significant δ’ precipitation occurs, as the observations can be
related to coarsening or partitioning of Li following congruent ordering (see Ref. [18]). Concerning the latter observation it is noted that work on Al-Cu-Mg by Ringer et al. [20] using APFIM and TEM indicates that GPB zones or clusters that form at the three treatments employed by Chen et al. [14] are not detectable by conventional TEM. In conclusion, it is thought that the TEM work of Chen et al. [14] is inconclusive as regards to the identification of peaks A and B. It is thought that our interpretation presented in Table 3 is essentially correct‡, although it should be noted that in ice-water quenched 8090 aged at temperatures below about 100ºC, δ’ formation probably involves
several stages, starting with congruent ordering [18].
It is further interesting to note that combination of data obtained by the present authors and co-workers [4,12,13,41,43,44] yields a detailed picture of how peaks A and B change in response to thermo-mechanical treatments. Compared to WQ samples, peak A is drastically reduced when 8090 is a) quenched at a slower rate (see also Ref. [14]), b) reinforced with ceramic particles, c) deformed by stretching or punching, d) artificially aged. Reversion treatment of artificially aged 8090 at 285ºC restores peak A [41]. Compared to WQ samples peak B is enhanced when 8090 is a) quenched at a slower rate, b) reinforced with ceramic particles, c) deformed by stretching or punching, d) solution treated at 505ºC instead of the standard 530ºC. As outlined above, all these observation are consistent with peak A being due to GPB zone formation and B being due to δ' phase formation.
5.2 Kinetics of the microstructure development.
In this section the kinetic models presented in section 3 will be used to model the evolution of the amounts and sizes of the phases in our alloys. In fitting the models to the data one has to take account of the interaction between GPB zones and S' phase which form by competing for the same elements. This was incorporated by making the following assumptions:
• for the monolithic 8090 alloy in which GPB zone dissolution occurs after a few days artificial ageing at 170°, the S' formation effectively occurs via dissolution of GPB zones.
• in the current MMCs and tempers, for which no GPB zone dissolution is detected, GPB zone formation effectively reduces the volume available for S' formation.
‡ Further, in contradiction of point iii, Chen et al. [14] claim that plastic deformation would enhance GPB
To apply the model for the transformation kinetics (section 3), the important parameters n, ηi and k have been determined as follows.
• In as quenched 8090 substantial amounts of small δ' precipitates are present. Hence subsequent precipitation will occur as 3 dimensional diffusion controlled growth of a fixed number of nuclei, and, hence, n = 1½ [32,34].
• For GPB zone formation in monolithic 8090 and Al-Cu-Mg alloys n equals 1.5 [45,46]. It is assumed that this value is appropriate for all of the present four alloys.
• The kinetics of S' formation in the MMCs is expected to be diffusion controlled with no significant nucleation of precipitates in the course of the transformation. Hence, it is expected that n equals 1½ [32,34]. In correspondence with this, the evolution of S' volume fractions and sizes could be fitted well with this value for n.
• In the monolithic 8090 alloy significant amounts of GPB zones form both before and during S' formation, thereby slowing down S' formation by competing for the Cu and Mg atoms. Hence, in the monolithic 8090 alloy, S' formation rates will depend on GPB zone formation and, in later stages, dissolution of GPB zones. As a result of these complicating factors n for S' formation in the monolithic alloy can not be predicted directly from transformation theory [32,34] and, hence, it was determined empirically, resulting in n = 0.5§.
• In earlier work on an Al-Cu-Mg alloy [46] it was determined that ηi for GPB zone formation equals about 0.6. This value is adopted for GPB zone formation in the present alloys. Earlier work has indicated that for highly elongated, plate shaped precipitates, like S', ηi equals about 0.5 whilst for more equi-axed precipitates, like δ’,ηi equals about 1 [7,8].
• For all 4 alloys pco for S' coarsening has been taken as 0.01. • Pre-exponential factors k are determined by data fitting.
The resulting model fits, as presented by the curves in Fig. 7, correspond satisfactorily to the data points derived from the DSC results. The model also proved to be useful in fitting the data on the sizes of the S' precipitates (curves in Fig. 8). The demonstrated satisfactory fit of the model for transformations kinetics (section 3) to the data for volume fractions of precipitates (Fig. 7 and Fig. 8) enhances the confidence that can be placed in both the model and the data derived from DSC. More thorough testing of the model for transformations kinetics through comparison with precipitation data for various Al-based alloys has been successfully completed and presented elsewhere [6,7,8,45,46,47].
Fig. 7 shows that the volume fraction of GPB zones formed during ageing decreases strongly when SiC is added to the 8090 alloy and decreases further with decreasing Li content of the MMCs. The former is due to the elimination of vacancies caused by the dislocations generated around misfitting SiC particles, as vacancies are necessary for formation of GPB zones [4]. This misfit of SiC with
§ This value for n may indicate that in the monolithic 8090 alloy the rate of S' formation and growth during
the rich matrix is due to the difference in coefficient of thermal expansion (CTE) between Al-rich matrix and ceramic reinforcement (see e.g. Ref. [1]). The data in Fig. 7 indicate that for all alloys the volume fraction of GPB zones has reached its maximum within about 10 h of ageing at 170°C. Hence, the decrease in volume fraction of GPB zones formed with decreasing Li content is related to the thermodynamics of the alloys and it is thought that Li reduces the solubility of Cu and/or Mg in the Al-rich phase in Al-Cu-Mg(-Li) alloys. The data in Fig. 7 indicate that in the monolithic alloy, in which GPB zone formation is completed within an hour ageing at 170°C, the GPB zones start to dissolve after a few days ageing, whilst in the MMCs, where GPB zone formation is slower, no GPB zone dissolution is detected within the ageing times employed.
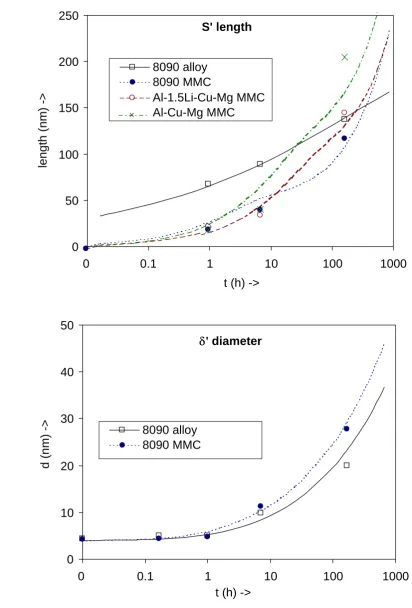
The volume fraction of S' depends strongly on the presence of reinforcing SiC particles and on the amount of Li present. The former is a result of the dislocations generated around misfitting SiC particles which act as nucleation sites for the S' precipitates. Similar to the GPB zones the decrease in volume fraction of S' formed with decreasing Li content is thought to be due to Li reducing the solubility of Cu and/or Mg. Whilst the volume fraction of S' precipitates depends strongly on SiC and Li content their average sizes are similar for the four alloys (Fig. 8). This indicates that the variations in volume fractions of S' precipitates observed for the four alloys are nearly exclusively due to the enhanced number of nucleation sites, with diffusion rates of the relevant precipitating elements (Cu, Mg) being largely identical for the four alloys.
From Fig. 7 it is observed that for the 8090 alloy and the 8090 MMC δ' formation is completed within an hour ageing at 170ºC. For the two other alloys the amount of Li is below the solvus and hence δ' formation does not occur. Fig. 7 further indicates that δ' formation is faster in the 8090 MMC as compared to the corresponding monolithic alloy. Interestingly, it has also been found that both in 8090, as well as in binary Al-Li alloys, the coarsening rate of δ' precipitates is enhanced as a result of the addition of ceramic particles [12,48]. It is known that stretching prior to artificial ageing enhances δ' coarsening [49], and hence, in the absence of any other microstructural feature that may explain these observations on coarsening and formation rates of δ' precipitates, it appears that enhanced Li diffusion along dislocations is responsible for these effects.
A final but important aspect of the present results is to provide the quantitative microstructure data for input to a comprehensive strength model detailed in the companion paper [5]. The good correlation of the model predictions for the strength of the four alloys based on the experimental data in this paper with measured strengths [5], may be considered a reasonable validation of the present volume fraction measurements.
List of symbols
7a
7b
GPB zones
0 0.002 0.004 0.006
0 0.1 1 10 100 1000
t (h) ->
vol fr
action
-> 8090 alloy
8090 MMC
Al-1.5Li-Cu-Mg MMC Al-Cu-Mg MMC
×
0 0.02 0.04 0.06 0.08 0.1 0.12 0.14
0 0.1 1 10 100 1000
t (h) ->
volum
e
fractio
n
->
7c
Fig. 7 Amounts of δ' phase, GPB zones and S' phase present in the four water quenched and aged alloys vs. ageing time at 170ºC. Data points from method using DSC; curves from model fit (section 3).
S' phase
0 0.002 0.004 0.006 0.008 0.01 0.012 0.014
0 0.1 1 10 100 1000
t (h) ->
vol fr
action
->
8090 alloy 8090 MMC
Al-1.5Li-Cu-Mg MMC Al-Cu-Mg MMC
[image:19.595.122.486.95.395.2]8a
8b
Fig. 8 Dimensions of δ' phase and S' phase present in the four water quenched and aged alloys vs. ageing time at 170ºC. Data points from method using DSC; curves from model fit (section 3).
0 10 20 30 40 50
0 0.1 1 10 100 1000
t (h) ->
d
(n
m) ->
8090 alloy 8090 MMC
δ' diameter
S' length
0 50 100 150 200 250
0 0.1 1 10 100 1000
t (h) ->
le
ngt
h (
n
m
)
->
8090 alloy 8090 MMC
[image:20.595.76.489.67.676.2]Conclusions
A quantitative study using DSC and TEM of the microstructural evolution during ageing in an 8090 alloy, an 8090 MMC, an Al-1.5Li-Cu-Mg MMC and Al-1.5Li-Cu-Mg MMC (all with similar Cu and Mg contents) has been performed. Volume fractions of precipitates present have been determined using a novel method based on heat evolution measured in the DSC. The analysis shows:
• The amount of GPB zones formed during ageing decreases strongly when SiC is added to the 8090 alloy and decreases further with decreasing Li content of the MMCs. The former is due to the elimination of vacancies caused by the dislocations generated around misfitting SiC particles, whilst the latter is most likely due to an increase in solubility of Cu and Mg with decreasing amount of Li dissolved in the Al-rich phase.
• The amount of S' phase present depends strongly on the amount of Li present and on the presence of reinforcing SiC particles. It is proposed that this is a result of the dislocations generated around misfitting SiC particles, which act as nucleation sites for the S' precipitates. • For the 8090 alloy and the 8090 MMC, δ' formation is completed within an hour at 170ºC. For
the two other alloys the amount of Li is below the solvus and hence δ' formation does not occur. • The volume fractions of all precipitates relevant for precipitation strengthening of the alloys have been determined and subsequently fitted by using a novel model for transformation kinetics. The sizes of these precipitates (as measured by TEM) have been fitted using newly derived expressions consistent with the latter model.
Acknowledgements
The authors are grateful to EPSRC and DERA for funding parts of this research and to Dr. A. Shakesheff of DERA Farnborough for supplying the alloys.
References
1 I. Sinclair and P.J. Gregson, Mater. Sci. Techn.,1997, 13, 709.
2 P.J. Whithers, W.M. Stobbs and O.B. Pedersen, Acta Metall., 1989, 37, 3061.
3 J.M. Papazian, Metall. Trans. A, 1988, 19, 2945.
4 M.J. Starink, A.J. Hobson and P.J. Gregson, Scr. Metall. Mater., 1996, 34, 1711.
5 M.J. Starink, P. Wang, I. Sinclair and P.J. Gregson, submitted for publication in Acta Mater.
6 M.J. Starink and A.-M. Zahra, Thermochim. Acta, 1997, 292, 159
7 M.J. Starink and A.-M. Zahra, Phil. Mag. A, 1998, 77, 187
8 M.J. Starink and A.-M. Zahra, Acta Mater., 1998, 46, 3381
9 H.M. Flower and P.J. Gregson, Acta Metall., 1985, 33, 527
10 E. Hunt, P.D. Pitcher and P.J. Gregson, Scr. Metall. Mater., 1990, 24, 937.
11 A. Luo, D.J. Lloyd, A. Gupta and W.V. Youdelis, Acta Metall. Mater., 1993, 41, 769. 12 M.J. Starink and P.J. Gregson, Mater. Sci. Eng. A, 1996, 211, 54.
13 M.J. Starink and P.J. Gregson, Scr. Metall. Mater., 1995, 33, 893.
15 A. Gaber and N. Afify, Appl. Phys. A, 1997, 65, 57.
16 K. Satya Prasad, A.K. Mukhopadhyay, A.A. Gokhale, D. Banerjee and D.B. Goel, Scr. Metall. Mater., 1994, 30, 1299.
17 B. Noble and A.J. Trowsdale, Phil. Mag. A, 1995, 10, 1345.
18 Y. Ohmori, S. Ito and K. Nakai, Metall. Mater. Trans. A, 1999, 30A, 741. 19 J.M. Silcock, J. Inst. Metals, 1960, 89, 203
20 S.P. Ringer, K. Hono, I.J. Polmear, T. Sakurai, Appl. Surf. Sci., 1996, 94/95, 253.
21 S.P. Ringer, S.K. Caraher and I.P. Polmear, Scr. Mater, 1998, 39, 1559 22 H.-C. Shih, N.J. Ho and J.C. Huang, Metall. Mater. Trans A, 1996, 27A, 2479 23 P. Gomiero, F. Livet, O. Lyon and J.P. Simon, Acta Metall. Mater., 1991, 39, 3007. 24 P. Gomiero, F. Livet , Y. Brechet and F. Louchet, Acta Metall. Mater., 1992, 40, 847. 25 A.K. Gupta, P. Gaunt and M.C. Chaturvedi, Phil. Mag. A., 1987, 55, 375.
26 A.-M. Zahra, C.Y. Zahra, C. Alfonso and A. Charai, Scr. Mater, 1998, 39, 1553
27 A.A. Alekseev, V.N. Anan’ev, L.B. Ber and E.Y. Kaputkin, Phys. Metals Metallogr., 1993, 75, 279. 28 P. Sainfort and B. Dubost, J. Physique, 1986, 47, Coll. C3, 330.
29 P.J. Gregson and S.A. Court, Scr. Metall. Mater., 1994, 30, 1359.
30 A.J. Shakesheff, unpublished work, 1993, Defence Evaluation and Research Agency, Farnborough, U.K.
31 M.J. Starink and A.M. Zahra, Thermochim. Acta, 1996, 288, 97.
32 J.W. Christian, in The Theory of Transformation in Metals and Alloys, 2nd ed., Part 1, Pergamon Press,
Oxford, U.K., 1975.
33 V. Sessa, M. Fanfoni and M. Tomellini, Phys. Rev. B, 1996, 54, 836.
34 M.J. Starink, J. Mater. Sci., 1997, 32, 4061
35 R. Poduri and L.-Q. Chen, Acta Mater., 1998, 46, 3915.
36 T. Christman and S. Suresh, Acta Metall., 1988, 7, 1691.
37 J.M. Badia, R. Servent and J.M. Antoranz, in Proc. International Conf. on Advanced Al and Mg Alloys,
Amsterdam, The Netherlands, June 1990, ed. T. Khan and G. Effenberg, ASM, 1990, p. 81.
38 A. Luo and W.V. Youdelis, Scr. Metall Mater., 1993, 28, 29.
39 S. Abis, E. Evangelista, P. Mengucci and G. Riontino, in Proc. 5th Al-Li Conf., Williamsburg, Virginia,
USA, March 1989, ed. T.H. Sanders and E.A. Starke, MCE Publications, Birmingham, U.K., p. 681.
40 S. Miyasato and G. Thomas, in Proc. 5th Al-Li Conf., Williamsburg, Virginia, USA, March 1989, ed.
T.H. Sanders and E.A. Starke, MCA Publications, Birmingham, UK, 1989, p. 633
41 M.J. Starink and P.J. Gregson, Mater. Sci. Forum, 1996, 217-222, 673.
42 V. Komisarov, M. Talianker and B. Cina, Mater. Sci. Eng. A, 1998, 242, 39.
43 A.J. Hobson, MPhil thesis, University of Southampton, 1999.
44 M.J. Starink, A.J. Hobson, I. Sinclair and P.J. Gregson, to be published
45 M.J. Starink and A.-M. Zahra, Thermochim. Acta, 1997, 298, 179.
46 M.J. Starink, C.Y. Zahra and A.-M. Zahra, J. Therm. Anal., 1998, 51, 933
47 M.J. Starink and A.-M. Zahra, Mater. Sci. Eng. A, 1998, 241, 277.
48 D.L. Sun, S.Q. Chen, J.F. Mao and D.Z. Yang, Mater. Chem. Phys., 1994, 36, 217.
49 W.S. Jung and J.K. Park, in Proc. 6th Al-Li Conf., Garmisch-Partenkirchen, Germany, October 1991,