Original Article
Inner hair cell ribbon synapse plasticity might be
molecular basis of temporary hearing
threshold shifts in mice
Haolin Wang1*, Ning Zhao2*, Kaisheng Yan1*, Xiuli Liu1, Yue Zhang3, Zhijun Hong1, Mingyu Wang1, Qing Yin1, Feifeng Wu1, Yu Lei1, Xiaoyan Li1, Lin Shi1, Ke Liu3
1Department of Otorhinolaryngology, The First Affiliated Hospital, Dalian Medical University, Dalian 116013,
China; 2Department of Otorhinolaryngology, The First Affiliated Hospital, China Medical University, Shenyang
110001, China; 3Department of Otolaryngology, Head & Neck Surgery, The Institute of Otolaryngology, Chinese
PLA General Hospital, 28 Fuxing Road, BeiJing, 100853, China. *Equal contributors.
Received May 1, 2015; Accepted June 22, 2015; Epub July 1, 2015; Published July 15, 2015
Abstract: Recent studies have reported that noise exposure at relatively low intensities can cause temporary thres- hold shifts (TTS) in hearing. However, the mechanism underlying the TTS is still on debate. Here, we report that an acoustic stimulation (100 dB SPL, white noise) induced TTS in mice, with the maximal ABR threshold elevations seen on the 4th day after noise exposure. On the other hand, there were no significant morphological changes in
the cochlea. Further, there were paralleled changes of pre-synaptic ribbons in both the number and postsynaptic density (PSDs) during this noise exposure. The numbers of presynaptic ribbon, postsynaptic density (PSDs), and colocalized puncta correlated with the shifts of ABR thresholds. Moreover, a complete recovery of ABR thresholds and synaptic puncta was seen on the 14th day after the noise stimulations. Thus, our study may indicate that noise
exposure can cause a decline in cochlear ribbon synapses and result in consequent hearing loss. The reduction of synaptic puncta appears reversible and may contribute to hearing restoration in mice after noise exposure.
Keyword: Noise exposure, hearing impairment, ribbon synapse plasticity, inner hair cell
Introduction
Noise induced hearing loss is one of the most common occupational diseases, which is caused by overexposure of sound [1]. Until decades ago, researches focused on noise induced permanent threshold shif (PTS) found noise exposure can adversely affect all three regions of the cochlea, the organ of Corti, the lateral wall and the spiral ganglion neurons (SGN) [2]. However, recent studies report that noise exposure at relatively low levels or inten-sities cause temporary hearing threshold shifts (TTS), which indicates the acute injury to cochlea is reversible [2]. Jeffery T’s study found decrease in compound action potentials (CAP) in noise induced TTS in human. CAP stands for a summation of multiple single neuron action potentials. They conjectured TTS may still cause massive damage to the synapses between cochlear inner hair cells (IHCs) and
type I spiral ganglion neurons (SGNs), followed by a slowly developing process of degenerative SGN death. As we all known, death of SGN is irreversible, so TTS caused by overstimulation of noise may be associated with synapses between IHCs and SGNs-synaptic ribbons. The afferent synapse between IHCs and SGNs are mainly of the typical ribbon type [3], which is capable of high-speed neurotransmitter release in response to graded changes of membrane potential and ongoing recycling of released neu-rotransmitters. Because of these properties, ribbon synapses are recognized to play a criti-cal role in the temporal signal processing in the cochlea [3]. Shi et al proved a relevance between hearing impairment and synaptic plas-ticity by using a guinea pig model [2].
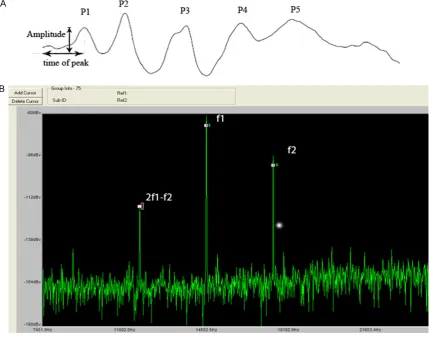
Figure 1. Illustrations of the methods to measure wave I of click and DPOAE. A. ABR wave I amplitude analysis includes three parts: time of peak (from beginning to Ip), SPL of click and amplitude of wave I (Ip-In). B. When we measured DPOAE, f1 and f2 connected to the earpiece. f2 was set at 4, 8, 16, and 32 kHz. The f2/f1 ratio was set at 1.2. The intensity of f2 = 55 dB, f1 = 65 dB. Amplitudes of 2f1-f2 were measured.
ribbon synapse numbers is responsible for the restoration of hearing after sound exposure, Here, we report that acoustic stimulation (100 dB SPL white noise) induced TTS in mice, with maximal ABR threshold elevations found on the 4th day after noise exposure. We utilized several experimental approaches, such as mouse mod-eling, auditory detection, whole mounts exami-nation and confocal microcopy, to try to answer these concerns.
Material and methods
Animals and grouping
The experiments were performed on adult (8 weeks old) C57 mice with normal hearing, which were obtained from the Chinese Academy of Medical Sciences Animal Center (Beijing, China). This study was carried out in strict accordance with the recommendations in the
Guide for the Care and Use of Laboratory Animals of the National Institutes of Health. The protocol was approved by the Committee of the Chinese PLA General Hospital. All sur-gery was performed under 10% chloral hydrate anesthesia, and all possible efforts were made to minimize suffering.
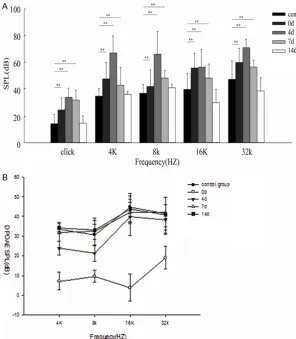
Figure 2. Temporary threshold shifts (TTS) and changes of DPOAEs caused by noise exposure. A. The ABR thresholds are elevated immediately following noise exposure, with maximum elevation of nearly 17 dB compared with before ex-posure on the 4th post-exposure day (P < 0.01). Thresholds on the 4th and 7th
post-exposure days are not significantly different (P > 0.05). Thresholds are sig-nificantly elevated at 4, 8, 16 and 32 kHz immediately after exposure, but only damatically at 4 and 8 kHz on the 4th post-operative day( P < 0.01). On the 7th
post-exposure day, thresholds elevation show significant improvement across frequencies compared with those on the 4th post-exposure day (P < 0.05). On
the 14th post-exposure day, thresholds at 4 and 8 kHz are not significantly
dif-ferent compared with before exposure (P > 0.05). B. In control group, DPOAEs in 4, 8, 16, 32KHZ were 33.5 ± 1.20, 30.7 ± 5.10, 44.6 ± 7.20, 41.5 ± 8.20. A severe reduction of DPOAEs at 0 day group in 4, 8, 16, 32KHZ was shown, 32.60 ± 4.40 , 31.2 ± 3.0, 41.5 ± 6.70, 42.3 ± 5.80, respectivly (p < 0.05, one-way ANOVA). However, DPOAEs of 16 and 32 KHZ returned to normal levels in 4 days group. They were 31.8 ± 4.60, 32.4 ± 6.80, 41.8 ± 5.40, 42.2 ± 7.5 at the 4 frquecies. On the 7th day after noise exposure, no loss of DPOAEs was detected
at each frequency.
in the 14 days group after noise exposure. The mice were sacrificed after auditory testing for morphological investigations.
Assessment of auditory function
Bilateral auditory brainstem response (ABR) audiograms were obtained before exposure,
Figure 3. Morphology of cochlear hair cells and noise exposure. Both OHCs and IHCs display a normal array of three rows of OHCs and one row of IHCs (A-E, Scale bar = 10 um). SEM showes no significant changes of the stereocilia of IHCs (F-J, Scale bar = 10 um) before and after the noise exposure.
from individual ears’ responses for increasing stimulus levels 20 dB above threshold to 90 dB (Figure 1A).
DPOAEs were measured using an ER-10B+ (Etymotic Research) microphone coupled with
two EC1 speakers. Stimuli of two primary tones f1 and f2 (f2/f1 = 1.2) were presented with f2 = 55 dB, f1 = 65 dB increment and swept from 8 to 32 kHz in 1/2 octave steps. Stimuli were generated and attenuated digitally (200 kHz sampling). The ear canal sound pressure was
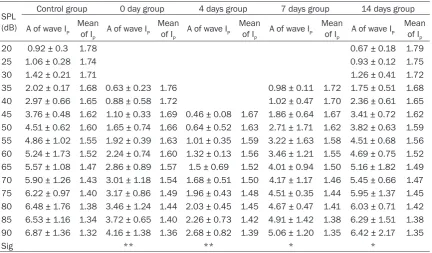
Table 1. Amplitudes of wave I in click of the 5 groups from hearing threshold to 90 dB SPL
SPL (dB)
Control group 0 day group 4 days group 7 days group 14 days group A of wave IP Mean of I
P
A of wave IP Mean of I
P
A of wave IP Mean of I
P
A of wave IP Mean of I
P
A of wave IP Mean of I
P
20 0.92 ± 0.3 1.78 0.67 ± 0.18 1.79
25 1.06 ± 0.28 1.74 0.93 ± 0.12 1.75 30 1.42 ± 0.21 1.71 1.26 ± 0.41 1.72 35 2.02 ± 0.17 1.68 0.63 ± 0.23 1.76 0.98 ± 0.11 1.72 1.75 ± 0.51 1.68 40 2.97 ± 0.66 1.65 0.88 ± 0.58 1.72 1.02 ± 0.47 1.70 2.36 ± 0.61 1.65 45 3.76 ± 0.48 1.62 1.10 ± 0.33 1.69 0.46 ± 0.08 1.67 1.86 ± 0.64 1.67 3.41 ± 0.72 1.62 50 4.51 ± 0.62 1.60 1.65 ± 0.74 1.66 0.64 ± 0.52 1.63 2.71 ± 1.71 1.62 3.82 ± 0.63 1.59 55 4.86 ± 1.02 1.55 1.92 ± 0.39 1.63 1.01 ± 0.35 1.59 3.22 ± 1.63 1.58 4.51 ± 0.68 1.56 60 5.24 ± 1.73 1.52 2.24 ± 0.74 1.60 1.32 ± 0.13 1.56 3.46 ± 1.21 1.55 4.69 ± 0.75 1.52 65 5.57 ± 1.08 1.47 2.86 ± 0.89 1.57 1.5 ± 0.69 1.52 4.01 ± 0.94 1.50 5.16 ± 1.82 1.49 70 5.90 ± 1.26 1.43 3.01 ± 1.18 1.54 1.68 ± 0.51 1.50 4.17 ± 1.17 1.46 5.45 ± 0.66 1.47 75 6.22 ± 0.97 1.40 3.17 ± 0.86 1.49 1.96 ± 0.43 1.48 4.51 ± 0.35 1.44 5.95 ± 1.37 1.45 80 6.48 ± 1.76 1.38 3.46 ± 1.24 1.44 2.03 ± 0.45 1.45 4.67 ± 0.47 1.41 6.03 ± 0.71 1.42 85 6.53 ± 1.16 1.34 3.72 ± 0.65 1.40 2.26 ± 0.73 1.42 4.91 ± 1.42 1.38 6.29 ± 1.51 1.38 90 6.87 ± 1.36 1.32 4.16 ± 1.38 1.36 2.68 ± 0.82 1.39 5.06 ± 1.20 1.35 6.42 ± 2.17 1.35
Sig ** ** * *
[image:4.629.100.533.369.622.2]Figure 4. Morphology of spiral ganglion cells (SGCs) and noise exposure. A. HE staining and light microscopy show no significant differences in the density of SGCs and innervations after noise exposure compared to before expo-sure. Arrow heads indicate SGCs and SGNs. Bar = 10 um. B. SGN counts in the 5 groups were 18.86 ± 1.88, 18.38 ± 1.86, 18.14 ± 1.53, 18.04 ± 2.22, 18.71 ± 1.90 respectively.Statistical analysis by the Mann-Whitney U test indicated that no significant difference exists among 5 groups (p > 0.05). Dashed lines showed means.
preamplified and digitized. Amplitudes of 2f1-f2 were measured based on the baseline (Figure 1B).
Noise exposure
40 awake mice in separate stainless steel wire cages (approximately 15 × 5 × 5 cm) were exposed to white noise for 2 h to induce thresh-old shifts.To achieve the maximum TTS noise exposure, the noise level was adjusted to 100 dB SPL, measured at the center of each parti-tion within the cage. The sound exposure cham-ber was fitted with a loudspeaker (YH25-19B, 25 W, 16 Ω, China) driven by a power producer (33220 A, China) fed from noise software. The noise sound files were created and equalized with audio editing software (Audition 3; Adobe System, Inc., San Jose, CA). Sound levels were calibrated with a sound level meter (model 1200; Quest Technologies, Oconomovoc, WI) at multiple locations within the sound chamber to ensure uniformity of the sound field. Sound lev-els were measured before and after exposure to ensure stability.
Cochlear tissue processing
At each evaluation time point (i.e. before noise exposure, immediately after exposure, and on post-exposure Days 4, 7 and 14), 5 mice were decapitated under deep anesthesia and the cochlea quickly removed from the skull and separated. The round and oval windows and the apex of the cochlea were opened for perfu-sion with 4% paraformaldehyde overnight. After fixation, the cochlea shell was decalcified with 10% EDTA for 4-6 hours, then the basal turn separated under a dissecting microscope in 0.01 mmol/L PBS solutions. The parietal gyrus of the basilar membrane was separated, and the vestibular membrane and the tectorial membrane were removed.
Immunohistology and confocal imaging
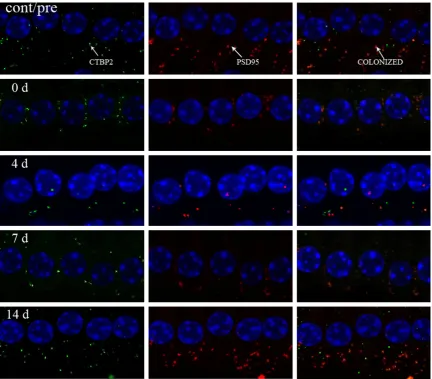
Figure 5. Change of RIBEYE/CtBP2 in confocal microscopy in control group (cont/pre), 0 day group (0 d), 4 day group (4 d), 7 day group (7 d), 14 day (14 d). The number of RIBEYE/CtBP2 shows a decrease instantly after noise expo-sure (p < 0.05). Maximal reduction of RIBEYE/CtBP2 staining appears on the 4th day after exposure as compared
with before exposure (p < 0.01). An increase of RIBEYE/CtBP2 spots is seen on the 7th post-exposure day compared
with the 4th day (p < 0.05), although still less than that before exposure (p < 0.05). No significant difference is seen
between the 14th post-exposure day and control (before exposure) (p > 0.05).
binding protein 2, C, end of combination of pro-tein) antibody (1:200, SANTA CRUZ) and rabbit anti-mouse PSD95 antibody (1:200, SANTA CRUZ), at 4°C for overnight. The incubated specimens were washed in 0.01 M PBS three times and incubated in donkey anti-goat 488 and donkey anti-rabbit 568 (fluorescein isothio-cyanate; SANTA CRUZ) (1:100) at room temper-ature for 60 min, and then washed three times again. A drop (approximately 40 μl) of DAPI (4, 6-diamidino-2-phenylindole; Santa Cruz) was added to the slide, on which the basement membrane was tiled under a dissecting micro-scope and covered with a coverslip. The speci-mens were imaged directly with fluorescent microscopy to examine the specificity of the primary antibody.
The laser scanning confocal microscope was a Olympus FV1000 configuration (Japan) with 180× oil immersion objective. The excitation wavelengths were 488 nm and 586 nm. Sequence scanning was performed on IHCs. The scanning interval for sequential scanning was set to 0.5 μm to ensure that each synapse was marked since the size of mature IHC ribbon synapses usually ranges from 150 nm to 200 nm.
Counting the number of cochlear ribbon syn-apse
and oval windows with both 2% paraformaldehyde and 2% glutaraldehyde in 0.1 M phosphate buffer (pH 7.4), and incubated in the same fixative overnight at 4°C. The cochleae were then rinsed with 0.1 M (PBS) and incubated in 1% osmium tetroxide over-night, followed by immer-sion in 5% ethylenediami-netetraacetic acid (EDTA) for 2-4 days. The decalci-fied cochleae were then dehydrated in ethanol and propylene oxide and em- bedded in Araldite 502 resin (Electron Microscopy Sciences, Fort Washingt- on, PA, USA). The cochleae were stained with toluidine blue and mounted in per-mount on microscope sli- des.
top to bottom using the 3Ds Max Software. The images were magnified in “zoomed top view” to identify IHC ribbon synapses. The green fluo-rescence spot (indicating a pre synaptic ribbon) that appeared in each image was first marked by a sphere, whose size was then adjusted to match the area of green fluorescence. Before marking green fluorescence in the next image, the previous marked image was opened for comparison. In the next image, if the green fluo-rescence appeared at the same location as on the previous image, it was skipped to avoid redundant labeling. Additionally, only two adja-cent images from serial scanning could overlap. After all the images were marked, the total number of marks was obtained using the layer manager of 3Ds Max [6]. After switching chan- nels, the red fluorescence spots indicating PSD95 were counted using the same method described for the green fluorescence.
Light microscopy
At each evaluation time point, 4 cochleae we- re harvested for light microscopic examina- tion. The mice were anesthetized and th- eir cochleae were isolated and dissected. The cochleae were perfused through the round
To count SGNs, we used the optical fraction-ators method to sample cell numbers in a defined fraction of the cochlear neural volume by optical dissection. Optical dissection was achieved using a 60x oil immersion lens to view along the Z-axis of sections having a thickness at least a few micrometers greater that the diameter of SGN cell bodies. The rationale for this requirement was that a few micrometers at the surface and bottom of the sections are needed to avoid the unevenness and artifacts at the surfaces of the sections. We cut a series of 50 μm cochlea sections for this approach. In order to count cells, a sampling grid was placed over the contour in a random fashion using Stereological Investigator software. Each box of the sampling grid contained an unbiased count-ing frame, representcount-ing a defined fraction of SGNs. The specific feature chosen for counting was the nucleolus of each cell.
Statistical analysis
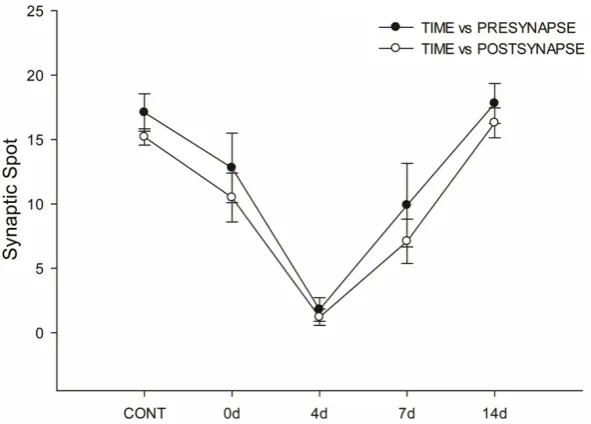
[image:7.629.99.395.79.291.2]Statistical analyses were performed using SPSS (IBM corporation, Somers, NY). All data were expressed as Mean ± SEM. Pre- and post-noise exposure ABR audiograms (specifically the SPL thresholds) at various evaluation time points were compared across frequencies and Figure 6. Parallel changes of synaptic ribbons and PSD95 in response to the
noise exposure. The curve representing synaptic ribbons (dark circle) shows a decrease instantly after noise exposure (on the day of exposure). Maximal re-duction of ribbon numbers is seen on the 4th post-exposure day, and recovery of
ribbon number is seen on the 7th day. Complete restoration of ribbon numbers
is seen on the 14th post-exposure day. The curve representing PSD95 (white
for individual frequencies, using a one-way ANOVA and Turkey’s post-hoc multiple compari-son test. For multiple group comparicompari-sons, sta-tistical significance of SGN counting was deter-mined using Mann-Whitney U test. Two-way ANOVA followed by Student’s t-test with Bonferroni correction was used to compare hair cell numbers among all the groups. Comparison of amplitudes of wave I peaks in different groups included the amplitudes, the latency of peak and SPL of click. For multiple comparison of the number of pre- and post synapses, one-way ANOVA was used. To determine whether pre-synaptic ribbons number changes correlate with alterations in PSDs, student’s t test was used to test the correlation. A P value of < 0.05 was considered statistically significant.
Results
Temporary threshold shifts (TTS)and DPOAE after noise exposure
The averaged ABR threshold for click from the control and the groups tested at different times after the noise are 15.00 ± 6.79, 20.83 ± 9.06, 32.50 ± 6.33, 9.58 ± 9.22 and 15.00 ± 5.34 in the control group, 0 day group, 4 days group, 7 days group and 14 days group respectively, with peak threshold elevation occurring on Day 4 by nearly 17 dB compared with that before exposure (or the control) (Figure 2A, P < 0.01). ABR threshold improvement was seen on post-exposure Day 7, although no statistically signifi-cant difference was shown between post-expo-sure Day 4 and Day 7 (Figure 2A, P > 0.05). Apparent recovery of ABR threshold was identi-fied on post-exposure Day 14, showing no sta-tistically significant difference from the control (Figure 2A, P > 0.05).
Additionally, the noise exposure caused signifi-cant ABR threshold elevation across all fre-quencies. On post-exposure Day 0 (instantly after exposure), statistically significant thresh-old changes were found at 4, 8, 16 and 32 kHz (Figure 2A), which increased dramatically at 4 and 8 kHz on post-exposure Day 4 (Figure 2A, P < 0.01), indicating increasing hearing impai- rment. On post-exposure Day 7, elevation of ABR thresholds across all frequencies showed a noticeable decrease compared with 4 day group (Figure 2B, P < 0.05). Correspondingly, significant restoration of ABR thresholds was also found on post-exposure Day 14, with
thresholds at 4, 8, 16 and 32 kHz showing no significant difference in comparison to before exposure (Figure 2A, P > 0.05), indicating te- mporary threshold shifts (TTSs) following 100 dB SPL white noise exposure.
A dominant component of hearing loss was a severe reduction of DPOAEs instantly after noise exposure, as shown in Figure 2B. However, DPOAEs began to return to normal levels 4 days after exposure in 16 kHz, 32 kHz (p < 0.05, one-way ANOVA). For the 7th noise exposure, no loss of DPOAEs was detected (p > 0.05).
Reduction of ABR wave 1 peak amplitude after TTS noise exposures
After 2 h 100 dB sound exposure, quantific- ation of wave I peak reduced quickly in click (Figure 3B, p < 0.05), accompanied with hea- ring threshold elevating, wave I peak amplitude appeared maximal reduction 4 days after noise (p < 0.01). Even though ABR thresholds com- pletely restored in the 14 days group, the ABR wave I peak didn’t return to normal (Table 1), suggesting auditory function didn’t fully re- covered.
Morphology of cochlear hair cells and spiral ganglion cells counting
According to Dapi stain, our study showed that cochlear hair cells (IHCs and OHCs) displayed a normal array of three rows of OHCs and one row of IHCs (Figure 3A-E). SEM observations found that there were no significant changes of IHC stereocilia in response to the sound exposure (Figure 3F-J), suggesting that the 100 dB SPL white noise stimulation of 2 hours was not suf-ficient to cause morphological changes of cochlear hair cells in these mice. By observing and counting numbers of SGN, the differences among the 5 groups didn’t reach statistical sig-nificance (p = 0.07, Figure 4A, 4B).
Change in the numbers of pre-synapse ribbons and PSDs
sure, and 12.60 ± 2.59, 2.77 ± 0.62, 10.56 ± 4.06 and 17.17 ± 1.34 per IHC on post-expo-sure Days 0, 4, 7 and 14, respectively (Figure 5). The number decreased after noise exposure (Figures 5, 6, p < 0.05), with the maximal reduc-tion occurring on Post-exposure Day 4 (Figures 5, 6, p < 0.01). Partial restoration of RIBEYE/ CtBP2 puncta was seen on post-exposure Day 7, although still less than before exposure (Figure 6, p < 0.05). Complete RIBEYE/CtBP2 number recovery was seen on post-exposure Day 14, showing no significant difference from the control (Figure 6, p > 0.05).
Also, we labeled the postsynaptic structures, using the antibody against Post-Synaptic Density protein (PSD95) [7, 8]. The number of PSD95 was 16.52 ± 2.02/IHC before exposure, and 13.67 ± 2.63, 2.78 ± 0.57, 10.26 ± 2.24, and 16.67 ± 1.58 per IHC on post-exposure Days 0, 4, 7 and 14, respectively (Figure 5). The maximal PSD95 number loss occurred on post-exposure Day 4 (Figures 5, 6, p < 0.05), sug-gesting significant effects on the number of postsynaptic receptors by the noise exposure. It also paralleled the elevation of ABR thresh-olds on post-exposure Day 4 (Figure 2A). The number of colocalized pre and postsynaptic puncta was 15.73 ± 0.95/IHC before exposure, and 10.27 ± 4.84, 2.2 ± 0.43, 9.98 ± 3.39, and 16.85 ± 0.56 per IHC on post-exposure Days 0, 4, 7 and 14, respectively (Figures 5, 6).
Discussion
The effect of overexposure to noise on hearing thresholds
The degree of hearing loss produced by acous-tic trauma is dependent on the loudness of the sound and the duration of the exposure. Temporary Threshold Shifts may be observed immediately following exposure, and if the sound is loud enough it may produce perma-nent elevations in thresholds resulting in per-manent threshold shifts (PTS) [9].
The hearing loss produced by our stimulus can be characterized by significant threshold shifts across all frequencies and all time points. Hearing loss was observed instantly after 2-hour-exposure, while the maximal threshold shift appeared in the 4th day , which indicated an acute hearing function damage. It seems contrary to most previous study [5, 10] which
indicated the maximal hearing loss appeared in 24 hours following noise exposure. However, in the studies mentioned above, they didn’t observe the 4th day hearing threshold. Our study consistent with Brown’s study [9] which showed persist hearing loss in 4 days after noise exposure. Day 7 suggests that some hearing function has recovered after the acous-tic trauma. We postulates ribbon synapses have time-delay reaction to acoustic trauma, it might be for self protection. The ribbon struc-ture is responsible for both quick responses to rapidly changing signals and long-lasting responses to continuous stimuli. Glutamate over releasing due to sound overexposure may produce a long lasting damage to ribbon syn-apses which causes proceeding hearing loss until the 4th day.
The initial threshold shifts may be a result of peripheral damage to the auditory system. It is known that IHC and OHC cannot regenerate in humans and most mammals [11]. Our study shows normal array and morphology of OHC and IHC, that’s why the acoustic trauma pro-duce TTS not PPS. By analyzing amplitude I wave of click, a dramatic I wave reduction seen clearly, which indicates the synapses between cochlear inner hair cells (IHCs) and type I spiral ganglion neurons (SGNs) injuries.
Changes of cochlear ribbon synapses might be molecular basis of temporary hearing thresh-old shifts in noise induced hearing loss
explored the effects of noise exposure on the temporal processing ability of the auditory sys-tem. Beside observing the ABR, we observed the damage and the repair of ribbon synapses at both pre- and post-synaptic sites in an attempt to provide insight into the plastic changes of ribbon synapses during noise exposure.
Previous studies show acute noise-induced excitability results in little or no terminal regen-eration or synaptogenesis, and cochlear thresh-olds can still recover despite a loss of 50% of the auditory nerve terminals [16-18]. In con- trast, our study found that ABR thresholds could undergo 100% recovery despite a loss of more than 80-90% synaptic stumps. The differ-ence is demonstrated in several ways. Firstly, our study use C57BL/6J mice as animal models because they are more sensitive to noise and are more likely to bite than the more docile lab-oratory strains such as BALB/c [19]. However, as seen in this report, ribbon loss in C57BL/6J mice is much more reversible when compared to that previously reported in BALB/c mice. It may due to the species used, the age of the animals, method of acoustic trauma, method of quantification and assessing ribbon synapses at differing time. Secondly, this is the first study that has investgated changes of ribbon synaps-es with no significant OHC or IHC loss, although DPOAEs showed transient change, but mor-phology of OHC and IHC were normal, suggest-ing ribbon synapse might be the primary target in noise induced hearing loss.
Except the loss and recovery of hair cell ribbons and post-synaptic densities (PSDs) occurring in parallel, previous study reported that the recov-ery was not complete, resulting in a permanent loss of less than 10% synapses [2]. A plastic interaction between ribbons and postsynaptic terminals may be involved in the reconstruction of synaptic contact between ribbons and PSDs, as shown by location changes in both struc-tures. Synapse restoration is associated with a breakdown in temporal processing, hence the deterioration in temporal processing originated from the cochlea. This deterioration develops with the recovery in hearing threshold and rib-bon synapse counts, suggesting that repaired synapses have deficits in temporal processing [2, 20].
However, our study seems to show that synap-tic repair is complete as indicated by lack of significant differences in both ABR thresholds and synapse numbers between the 14th day after noise exposure and before exposure. Very differently, previous studies proposed that this damage was largely irreparable in mice [5, 17, 20]. Possible reason may come from the large-scale degenerative SGN death that developed slowly after the initial damage in those studies [17]. Although the present study does not observe the SGN loss in longer time line, it at least confirm that synapses change prior to SGN. In guinea pigs, however, initial damage of a similar degree was found to be largely repair-able [5], suggesting a cross-species difference in the repair process in the ribbon synapses. In consist with our study, we analyzed click-evoked ABR wave I amplitude and found reduc-tion at 20 dB above hearing threshold in 14 day group compared with control, which indicated incomplete recovery of ribbon synapses function.
ing contributes to cochlear adaption to elevat-ed sound levels and protection from overstimu-lation. Their study shows acoustic overstimula-tion leads over release of ATP into the cochlear partition, which activate P2X2 receptors and reduces sound transduction and synaptic transmition. According to their study, loss of synapses is to some extent otoprotective against noise damage. That’s why recovery of hearing threshold was detected after synapses loss. We hypothesis the purinergic signal might be the mechanism of noise induced synapses loss.
In our study, we divide each basilar membrane into parietal gyrus, middle gyrus and basal gyrus. We find there is no difference of ribbon synapse loss among the gyri. We speculate it might because white noise which is a random signal with a constant power spectral density (Carter, 2009) makes influence to all frequen-cies. However, with the same synapses loss, it appears more dramatic hearing loss in 4, 8 KHZ. Whether it indicates different compensa-tion funccompensa-tion in different frequencies is not clear.
Because the chance of being exposed to low-level noise is widespread encounters in mod-ern society, the accumulations of such damage in cochlea can become one of the mechanisms for the reduced temporal resolution in aging subjects [25]. The deficits are considered a major obstacle in signal coding and the major reason for emerging problems in speech per-ception with aging [21, 23, 26-29].
Acknowledgements
This work was supported by grants from the National Natural Science Foundation of China (NSFC) (81503372) and the National Basic Research Program of China (973Program) (2012CB967900; 2012CB967901).
Disclosure of conflict of interest
None.
Address correspondence to: Lin Shi, Department of Otorhinolaryngology, The First Affiliated Hospital, Dalian Medical University, Dalian 116013, China. E-mail: [email protected]; Ke Liu, Department of Otolaryngology, Head & Neck Surgery, The Institute of Otolaryngology, Chinese PLA General Hospital, 28
Fuxing Road, BeiJing, 100853, China. E-mail: [email protected]
References
[1] Cui Y, Sun GW, Yamashita D, Kanzaki S, Matsunaga T, Fujii M, Kaga K, Ogawa K. Acoustic overstimulation-induced apoptosis in fibrocytes of the cochlear spiral limbus of mice. Eur Arch Otorhinolaryngol 2011; 268: 973-978.
[2] Shi L, Liu L, He T, Guo X, Yu Z, Yin S, Wang J. Ribbon synapse plasticity in the cochleae of Guinea pigs after noise-induced silent dam-age. PLoS one 2013; 8: e81566.
[3] Roux I, Safieddine S, Nouvian R, Grati M, Simmler MC, Bahloul A, Perfettini I, Le Gall M, Rostaing P, Hamard G, Triller A, Avan P, Moser T, Petit C. Otoferlin, defective in a human deaf-ness form, is essential for exocytosis at the au-ditory ribbon synapse. Cell 2006; 127: 277-289.
[4] Liu K, Jiang X, Shi C, Shi L, Yang B, Shi L, Xu Y, Yang W, Yang S. Cochlear inner hair cell ribbon synapse is the primary target of ototoxic ami-noglycoside stimuli. Mol Neurobiol 2013; 48: 647-654.
[5] Liu L, Wang H, Shi L, Almuklass A, He T, Aiken S, Bance M, Yin S, Wang J. Silent damage of noise on cochlear afferent innervation in guin-ea pigs and the impact on temporal process-ing. PLoS one 2012; 7: e49550.
[6] Liu K, Ji F, Xu Y, Wang X, Hou Z and Yang S. Myosin VIIa and otoferlin in cochlear inner hair cells have distinct response to ototoxic expo-sure. Acta Otolaryngol 2014; 134: 564-70. [7] Webster M and Webster DB. Spiral ganglion
neuron loss following organ of Corti loss: a quantitative study. Brain Res 1981; 212: 17-30.
[8] Grant L, Yi E, Goutman JD and Glowatzki E. Postsynaptic recordings at afferent dendrites contacting cochlear inner hair cells: monitor-ing multivesicular release at a ribbon synapse. J Vis Exp 2011.
[9] Browne CJ, Morley JW and Parsons CH. Tracking the expression of excitatory and in-hibitory neurotransmission-related proteins and neuroplasticity markers after noise in-duced hearing loss. PLoS one 2012; 7: e33272.
[10] Maeda Y, Fukushima K, Omichi R, Kariya S and Nishizaki K. Time courses of changes in phos-pho- and total- MAP kinases in the cochlea af-ter intense noise exposure. PLoS one 2013; 8: e58775.
[11] Edge AS and Chen ZY. Hair cell regeneration. Curr Opin Neurobiol 2008; 18: 377-382. [12] Neef A, Khimich D, Pirih P, Riedel D, Wolf F and
at the hair cell ribbon synapse. J Neurosci 2007; 27: 12933-12944.
[13] Sobkowicz HM, August BK and Slapnick SM. Synaptic arrangements between inner hair cells and tunnel fibers in the mouse cochlea. Synapse 2004; 52: 299-315.
[14] Kujawa SG and Liberman MC. Adding insult to injury: cochlear nerve degeneration after “tem-porary” noise-induced hearing loss. J Neurosci 2009; 29: 14077-14085.
[15] Melcher JR and Kiang NY. Generators of the brainstem auditory evoked potential in cat. III: Identified cell populations. Hear Res 1996; 93: 52-71.
[16] Weisz C, Glowatzki E and Fuchs P. The postsyn-aptic function of type II cochlear afferents. Nature 2009; 461: 1126-1129.
[17] Liberman LD, Wang H and Liberman MC. Opposing gradients of ribbon size and AMPA receptor expression underlie sensitivity differ-ences among cochlear-nerve/hair-cell synaps-es. J Neurosci 2011; 31: 801-808.
[18] Maison SF, Casanova E, Holstein GR, Bettler B and Liberman MC. Loss of GABAB receptors in cochlear neurons: threshold elevation sug-gests modulation of outer hair cell function by type II afferent fibers. J Assoc Res Otolaryngol 2009; 10: 50-63.
[19] Conner DA. Transgenic mouse colony manage-ment. Current protocols in molecular biology. Edited by Ausubel FM, et al. Chapter 23: Unit 23 10, 2005.
[20] Lin HW, Furman AC, Kujawa SG and Liberman MC. Primary neural degeneration in the Guinea pig cochlea after reversible noise-induced threshold shift. J Assoc Res Otolaryngol 2011; 12: 605-616.
[21] Puel JL, Pujol R, Tribillac F, Ladrech S and Eybalin M. Excitatory amino acid antagonists protect cochlear auditory neurons from excito-toxicity. J Comp Neurol 1985; 341: 241-256.
[22] Pujol R, Lenoir M, Robertson D, Eybalin M and Johnstone BM. Kainic acid selectively alters auditory dendrites connected with cochlear in-ner hair cells. Hear Res 1985; 18: 145-151. [23] Hakuba N, Koga K, Gyo K, Usami SI and Tanaka
K. Exacerbation of noise-induced hearing loss in mice lacking the glutamate transporter GLAST. J Neurosci 2013; 20: 8750-8753. [24] Housley GD, Morton-Jones R, Vlajkovic SM,
Telang RS, Paramananthasivam V, Tadros SF, Wong AC, Froud KE, Cederholm JM, Sivak- umaran Y, Snguanwongchai P, Khakh BS, Cockayne DA, Thorne PR, Ryan AF. ATP-gated ion channels mediate adaptation to elevated sound levels. Proc Natl Acad Sci U S A 2013; 110: 7494-7499.
[25] Parthasarathy A, Cunningham PA and Bartlett EL. Age-related differences in auditory pro-cessing as assessed by amplitude-modulation following responses in quiet and in noise. Front Aging Neurosci 2010; 2: 152.
[26] Walton JP. Timing is everything: temporal pro-cessing deficits in the aged auditory brain-stem. Hear Res 2010; 264: 63-69.
[27] Grose JH, Mamo SK and Hall JW 3rd. Age ef-fects in temporal envelope processing: speech unmasking and auditory steady state respons-es. Ear and Hear 2009; 30: 568-575.
[28] Gordon-Salant S. Hearing loss and aging: new research findings and clinical implications. J Rehabil Res Dev 2005; 42: 9-24.