Learning to select data for transfer learning with Bayesian Optimization
Sebastian Ruder♠♣ Barbara Plank♥
♥Center for Language and Cognition, University of Groningen, The Netherlands ♠Insight Research Centre, National University of Ireland, Galway
♣Aylien Ltd., Dublin, Ireland
[email protected],[email protected]
Abstract
Domain similarity measures can be used to gauge adaptability and select suitable data for transfer learning, but existing ap-proaches define ad hoc measures that are deemed suitable for respective tasks. In-spired by work on curriculum learning, we propose tolearn data selection measures using Bayesian Optimization and evaluate them across models, domains and tasks. Our learned measures outperform existing domain similarity measures significantly on three tasks: sentiment analysis, part-of-speech tagging, and parsing. We show the importance of complementing similar-ity with diverssimilar-ity, and that learned mea-sures are—to some degree—transferable across models, domains, and even tasks.
1 Introduction
Natural Language Processing (NLP) models suf-fer considerably when applied in the wild. The distribution of the test data is typically very dif-ferent from the data used during training, caus-ing a model’s performance to deteriorate substan-tially. Domain adaptation is a prominent approach to transfer learning that can help to bridge this gap; many approaches were suggested so far (Blitzer et al., 2007; Daumé III, 2007; Jiang and Zhai,
2007; Ma et al., 2014; Schnabel and Schütze,
2014). However, most work focused on one-to-one scenarios. Only recently research consid-ered using multiple sources. Such studies are rare and typically rely on specific model transfer ap-proaches (Mansour,2009;Wu and Huang,2016). Inspired by work on curriculum learning ( Ben-gio et al.,2009;Tsvetkov et al.,2016), we instead propose—to the best of our knowledge—the first model-agnostic data selection approach to
trans-fer learning. Contrary to curriculum learning that aims at speeding up learning (see §6), we aim at learning to selectthe most relevant data from mul-tiple sources using data metrics. While several measures have been proposed in the past (Moore and Lewis, 2010;Axelrod et al., 2011;Van Asch and Daelemans,2010;Plank and van Noord,2011;
Remus, 2012), prior work is limited in studying metrics mostly in isolation, using only the notion of similarity (Ben-David et al.,2007) and focus-ing on a sfocus-ingle task (see §6). Our hypothesis is that different tasks or even different domains de-mand different notions of similarity. In this paper we go beyond prior work by i) studying a range of similarity metrics, including diversity; and ii) test-ing the robustness of the learned weights across models (e.g., whether a more complex model can be approximated with a simpler surrogate), do-mains and tasks (to delimit the transferability of the learned weights).
The contributions of this work are threefold. First, we present the first model-independent ap-proach tolearna data selection measure for trans-fer learning. It outperforms baselines across three tasks and multiple domains and is compet-itive with state-of-the-art domain adaptation ap-proaches. Second, prior work on transfer learn-ing mostly focused on similarity. We demonstrate empirically that diversity is as important as— and complements—domain similarity for transfer learning. Finally, we show—for the first time— to what degree learned measures transfer across models, domains and tasks.
2 Background: Transfer learning
Transfer learning generally involves the concepts of a domain and a task (Pan and Yang,2010). A domain D consists of a feature space X and a marginal probability distribution P(X) over X,
where X = {x1,· · · , xn} ∈ X. For document classification with a bag-of-words,X is the space of all document vectors, xi is the i-th document vector, andXis a sample of documents.
Given a domainD={X, P(X)}, a taskT con-sists of a label spaceYand a conditional probabil-ity distribution P(Y|X) that is typically learned from training data consisting of pairs {xi, yi}, wherexi ∈Xandyi ∈Y.
Finally, given a source domain DS, a corre-sponding source task TS, as well as a target do-main DT and a target task TT, transfer learn-ing seeks to facilitate the learnlearn-ing of the target conditional probability distributionP(YT|XT) in
DT with the information gained fromDS andTS where DS 6= DT or TS 6= TT. We will focus on the scenario where DS 6= DT assuming that
TS =TT, commonly referred to as domain adap-tation. We investigate transfer across tasks in §5.3. Existing research in domain adaptation has gen-erally focused on the scenario of one-to-one adap-tation: Given a set of source domainsAand a set of target domains B, a model is evaluated based on its ability to adapt between all pairs(a, b)in the Cartesian productA×B wherea∈Aandb∈B (Remus,2012). However, adaptation between two dissimilar domains is often undesirable, as it may lead to negative transfer (Rosenstein et al.,2005). Only recently, many-to-one adaptation (Mansour,
2009; Wu and Huang, 2016) has received some attention, as it replicates the realistic scenario of multiple source domains where performance on the target domain is the foremost objective.
3 Data selection model
In order to select training data for adaptation for a task T, existing approaches rank the available ntraining examples X = {x1, x2,· · · , xn}ofk source domainsD = {D1,D2,· · ·,Dk} accord-ing to a domain similarity measureS and choose the top m samples for training their algorithm. While this has been shown to work empirically (Moore and Lewis, 2010; Axelrod et al., 2011;
Plank and van Noord,2011;Van Asch and Daele-mans, 2010; Remus, 2012), using a pre-existing metric leaves us unable to adapt to the characteris-tics of our taskT and target domainDT and fore-goes additional knowledge that may be gleaned from the interaction of different metrics. For this reason, we propose to learnthe following linear domain similarity measureS as a linear
combina-tion of feature values:
S=φ(X)·w| (1) whereφ(X) ∈ Rn×l are the similarity and di-versity features further described in §3.2for each training example, withlbeing the number of fea-tures, while w ∈ Rl are the weights learned by Bayesian Optimization.
We aim to learn weightswin order to optimize the objective functionJ of the respective taskT
on a small number of validation examples of the corresponding target domainDT.
3.1 Bayesian Optimization for data selection
As the learned measure S should be agnostic of the particular objective functionJ, we cannot use gradient-based methods for optimization. Similar toTsvetkov et al. (2016), we use Bayesian Opti-mization (Brochu et al.,2010), which has emerged as an efficient framework to optimize any func-tion. For instance, it has repeatedly found better settings of neural network hyperparameters than domain experts (Snoek et al.,2012).
Given a black-box function f : X → R, Bayesian Optimization aims to find an input xˆ ∈ arg minx∈Xf(x) that globally minimizesf. For this, it requires a priorp(f)over the function and an acquisition functionap(f) :X→ Rthat calcu-lates theutilityof any evaluation at anyx.
Bayesian Optimization then proceeds itera-tively. At iterationt, 1) it finds the most promising inputxt ∈ arg maxap(x) through numerical op-timization; 2) it then evaluates the surrogate func-tionyt∼f(xt) +N(0, σ2)on this input and adds the resulting data point(xt, yt)to the set of obser-vationsOt−1 = (xj, yj)j=1...t−1; 3) finally, it up-dates the prior p(f|Ot) and the acquisition func-tionap(f|Ot).
For data selection, the black-box function f looks as follows: 1) It takes as input a set of weightsw that should be evaluated; 2) the train-ing examples of all source domains are then scored and sorted according to Equation1; 3) the model for the respective task T is trained on the topn samples; 4) the model is evaluated on the valida-tion set according to the evaluavalida-tion measureJ and the value ofJ is returned.
Gaussian Processes (GP) are a popular choice for p(f) due to their descriptive power (
Ras-mussen, 2006). We use GP with Monte
(Moˇckus, 1974) as acquisition function as this combination has been shown to outperform com-parable approaches (Snoek et al.,2012).1
3.2 Features
Existing work on data selection for domain adap-tation selects data based on its similarity to the target domain. Several measures have been pro-posed in the literature (Van Asch and Daelemans,
2010;Plank and van Noord,2011;Remus,2012), but were so far only used in isolation.
Only selecting training instances with respect to the target domain also fails to account for in-stances that are richer and better suited for knowl-edge acquisition. For this reason, we consider—to our knowledge for the first time—whether intrin-sic qualities of the training data accounting for di-versityare of use for domain adaptation in NLP.
Similarity We use a range of similarity met-rics. Some metrics might be better suited for some tasks, while different measures might cap-ture complementary information. We thus use the following measures as features for learning a more effective domain similarity metric.
We define similarity features over probability distributions in accordance with existing literature (Plank and van Noord,2011). LetP be the rep-resentation of a source training example, whileQ is the corresponding target domain representation. Let furtherM = 1
2(P+Q), i.e. the average distri-bution betweenP andQ and letDKL(P||Q) = Pn
i=1pilogpqii, i.e., the KL divergence between
the two domains. We do not use DKL as a fea-ture as it is undefined for distributions where some eventqi ∈Qhas probability0, which is common for term distributions. Our features are:
• Jensen-Shannon divergence (Lin,1991): 1
2[DKL(P||M) + DKL(Q||M)]. Jensen-Shannon divergence is a smoothed, symmet-ric variant ofDKLthat has been successfully used for domain adaptation (Plank and van Noord,2011;Remus,2012).
• Rényi divergence (Rényi,1961): 1
α−1 log( Pn
i=1 p
α i
qα−1
i ). Rényi divergence
re-duces toDKL if α = 1. We setα = 0.99 followingVan Asch and Daelemans(2010).
1We also experimented with FABOLAS (Klein et al.,
2017), but found its ability to adjust the training set size dur-ing optimization to be inconclusive for our relatively small training sets.
• Bhattacharyya distance (Bhattacharya,
1943):ln(Pi√PiQi)
• Cosine similarity (Lee,2001): kPPk k·QQk. We can treat the distributions alternatively as vec-tors and consider geometrically motivated distance functions such as cosine similarity as well as the following.
• EuclideanpP distance (Lee, 2001): i(Pi−Qi)2.
• Variational dist. (Lee,2001):Pi|Pi−Qi|.
We consider three different representations for calculating the above domain similarity measures:
• Term distributions (Plank and van Noord,
2011): t ∈ R|V| where t
i is the probability of thei-th word in the vocabularyV.
• Topic distributions (Plank and van Noord,
2011): t ∈ Rn wheretiis the probability of thei-th topic as determined by an LDA model (Blei et al.,2003) trained on the data andnis the number of topics.
• Word embeddings (Mikolov et al., 2013): 1
n P
ivwi
q a
p(wi) where n is the number of
words with embeddings in the document,vwi
is the pre-trained embedding of thei-th word, p(wi) its probability, and a is a smoothing factor used to discount frequent probabilities. A similar weighted sum has recently been shown to outperform supervised approaches for other tasks (Arora et al., 2017). As em-beddings may be negative, we use them only with the latter three geometric features above.
Diversity For each training example, we calcu-late its diversity based on the words in the exam-ple. Let pi and pj be probabilities of the word typestiandtjin the training data andcos(vti, vtj)
the cosine similarity between their word embed-dings. We employ measures that have been used in the past for measuring diversity (Tsvetkov et al.,
2016):
• Number of word types:#types.
• Type-token ratio: #tokens#types .
• Entropy (Shannon,1948):−Pipiln(pi).
• Simpson’s index (Simpson,1949):−Pip2 i.
• Rényi entropy (Rényi,1961): 1
α−1 log( P
ipαi)
4 Experiments
4.1 Tasks, datasets, and models
We evaluate our approach on three tasks: senti-ment analysis, part-of speech (POS) tagging, and dependency parsing. We use thenexamples with the highest score as determined by the learned data selection measure for training our models.2 We
show statistics for all datasets in Table1.
Sentiment Analysis For sentiment analysis, we evaluate on the Amazon reviews dataset (Blitzer et al., 2006). We use tf-idf-weighted unigram and bigram features and a linear SVM classifier (Blitzer et al., 2007). We set the vocabulary size to 10,000 and the number of training examples n = 1600 to conform with existing approaches (Bollegala et al.,2011) and stratify the training set.
POS tagging For POS tagging and parsing, we evaluate on the coarse-grained POS data (12 uni-versal POS) of the SANCL 2012 shared task (Petrov and McDonald, 2012). Each domain— except for WSJ—contains around 2000-5000 la-beled sentences and more than 100,000 unlala-beled sentences. In the case of WSJ, we use its dev and test data as labeled samples and treat the remain-ing sections as unlabeled. We set n = 2000for POS tagging and parsing to retain enough exam-ples for the most-similar-domain baseline.
To evaluate the impact of model choice, we compare two models: a Structured Perceptron (in-house implementation with commonly used fea-tures pertaining to tags, words, case, prefixes, as well as prefixes and suffixes) trained for 5 itera-tions with a learning rate of 0.2; and a state-of-the-art Bi-LSTM tagger (Plank et al.,2016) with word and character embeddings as input. We perform early stopping on the validation set with patience of 2 and use otherwise default hyperparameters3
as provided by the authors.
Parsing For parsing, we evaluate the state-of-the-art Bi-LSTM parser byKiperwasser and Gold-berg (2016) with default hyperparameters.4 We
use the same domains as used for POS tagging, i.e., the dependency parsing data with gold POS as made available in the SANCL 2012 shared task.5
2All code is available at https://github.com/
sebastianruder/learn-to-select-data.
3https://github.com/bplank/bilstm-aux
4https://github.com/elikip/bist-parser
5We leave investigating the effect of the adapted taggers
on parsing for future work.
T Domain # labeled # unlabeled
Sentiment
Book 2000 4465
DVD 2000 3586
Electronics 2000 5681
Kitchen 2000 5945
POS/P
arsing
Answers 3489 27274
Emails 4900 1194173
Newsgroups 2391 1000000
Reviews 3813 1965350
Weblogs 2031 524834
[image:4.595.312.519.64.230.2]WSJ 2976 30060
Table 1: Number of labeled and unlabeled sen-tences for each domain in the Amazon Reviews dataset (Blitzer et al., 2006) (above) and the SANCL 2012 dataset (Petrov and McDonald,
2012) for POS tagging and parsing (below).
4.2 Training details
In practice, as feature values occupy different ranges, we have found it helpful to apply z -normalisation similar to Tsvetkov et al. (2016). We moreover constrain the weightswto[−1,1].
For each dataset, we treat each domain as target domain and all other domains as source domains. Similar toBousmalis et al.(2016), we chose to use a small number (100) target domain examples as validation set. We optimize each similarity mea-sure using Bayesian Optimization with 300 itera-tions according to the objective measureJof each task (accuracy for sentiment analysis and POS tag-ging; LAS for parsing) with respect to the valida-tion set of the corresponding target domain.
Unlabeled data is used in addition to calculate the representation of the target domain and to cal-culate the source domain representation for the most similar domain baseline. We train an LDA model (Blei et al.,2003) with 50 topics and 10 iter-ations for topic distribution-based representiter-ations and use GloVe embeddings (Pennington et al.,
2014) trained on 42B tokens of Common Crawl data6for word embedding-based representations.
For sentiment analysis, we conduct 10 runs of each feature set for every domain and report mean and variance. For POS tagging and parsing, we observe that variance is low and perform one run while retaining random seeds for reproducibility.
6https://nlp.stanford.edu/projects/
Target domains
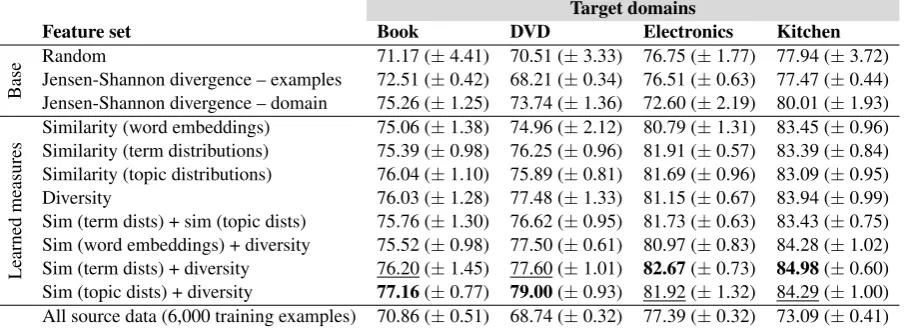
Feature set Book DVD Electronics Kitchen
Base
Random 71.17 (±4.41) 70.51 (±3.33) 76.75 (±1.77) 77.94 (±3.72)
Jensen-Shannon divergence – examples 72.51 (±0.42) 68.21 (±0.34) 76.51 (±0.63) 77.47 (±0.44)
Jensen-Shannon divergence – domain 75.26 (±1.25) 73.74 (±1.36) 72.60 (±2.19) 80.01 (±1.93)
Learned
measures
Similarity (word embeddings) 75.06 (±1.38) 74.96 (±2.12) 80.79 (±1.31) 83.45 (±0.96)
Similarity (term distributions) 75.39 (±0.98) 76.25 (±0.96) 81.91 (±0.57) 83.39 (±0.84)
Similarity (topic distributions) 76.04 (±1.10) 75.89 (±0.81) 81.69 (±0.96) 83.09 (±0.95)
Diversity 76.03 (±1.28) 77.48 (±1.33) 81.15 (±0.67) 83.94 (±0.99)
Sim (term dists) + sim (topic dists) 75.76 (±1.30) 76.62 (±0.95) 81.73 (±0.63) 83.43 (±0.75)
Sim (word embeddings) + diversity 75.52 (±0.98) 77.50 (±0.61) 80.97 (±0.83) 84.28 (±1.02)
Sim (term dists) + diversity 76.20 (±1.45) 77.60 (±1.01) 82.67(±0.73) 84.98(±0.60)
Sim (topic dists) + diversity 77.16(±0.77) 79.00(±0.93) 81.92 (±1.32) 84.29 (±1.00)
[image:5.595.73.527.64.228.2]All source data (6,000 training examples) 70.86 (±0.51) 68.74 (±0.32) 77.39 (±0.32) 73.09 (±0.41)
Table 2: Accuracy scores for data selection for sentiment analysis domain adaptation on the Amazon reviews dataset (Blitzer et al.,2006). Best: bold; second-best: underlined.
4.3 Baselines and features
We compare the learned measures to three balines: i) a random baseline that randomly se-lectsn training samples from all source domains (random); ii) the top n examples selected us-ing Jensen-Shannon divergence (JS – examples), which outperformed other measures in previous work (Plank and van Noord,2011;Remus,2012); iii) nexamples randomly selected from the most similar source domain determined by Jensen-Shannon divergence (JS – domain). We addi-tionally compare against training on all available source data (6,000 examples for sentiment analy-sis; 14,700-17,569 examples for POS tagging and parsing depending on the target domain).
We optimize data selection using Bayesian Op-timization with every feature set: similarity fea-tures respectively based on i) word embeddings, ii) term distributions, and iii) topic distributions; and iv) diversity features. In addition, we investigate how well different representations help each other by using similarity features with the two best-performing representations, term distributions and topic distributions. Finally, we explore whether di-versity and similarity-based features complement each other by in turn using each similarity-based feature set together with diversity features.
5 Results
Sentiment analysis We show results for senti-ment analysis in Table 2. First of all, the base-lines show that the sentiment review domains are clearly delimited. Adapting between two similar domains such as Book and DVD is more produc-tive than adaptation between dissimilar domains,
e.g. Books and Electronics, as shown in previ-ous work (Blitzer et al.,2007). This explains the strong performance of the most-similar-domain baseline. In contrast, selecting individual exam-ples based on a domain similarity measure per-forms only as good as chance. Thus, when do-mains are more clear-cut, selecting from the clos-est domain is a stronger baseline than selecting from the entire pool of source data.
If we learn a data selection measure using Bayesian Optimization, we are able to outper-form the baselines with almost all feature sets. Performance gains are considerable for all do-mains with individual feature sets (term simi-larity, word embeddings simisimi-larity, diversity and topic similarity), except for Books were improve-ments for some single feature sets are smaller. Term distributions and topic distributions are the best-performing representations for calculat-ing similarity, with term distributions perform-ing slightly better across all domains. Combin-ing term based and topic distribution-based features only provides marginal gains over the individual feature sets, demonstrating that most of the information is contained in the simi-larity features rather than the representations.
Trg domains→ Answers Emails Newsgroups Reviews Weblogs WSJ
Task→ POS Pars POS Pars POS Pars POS Pars POS Pars POS Pars
Feat↓Model→ P B BIST P B BIST P B BIST P B BIST P B BIST P B BIST
Base
Random 91.34 92.55 81.02 91.80 93.25 79.09 92.50 93.26 80.61 92.08 92.12 82.30 92.76 93.03 82.39 91.08 92.54 78.31
JS – examples 92.42 93.16 82.80 91.75 93.77 80.53 92.96 94.29 83.25 92.77 93.32 84.35 94.33 94.92 85.36 92.85 94.08 82.43
JS – domain 90.84 91.13 80.37 91.64 93.16 79.93 92.23 92.67 81.77 92.27 92.67 82.11 93.19 94.34 83.44 91.20 92.99 80.61
Learned
measures
W2v sim 92.53 93.22 82.74 92.94 94.14 81.18 93.41 94.09 81.62 93.51 93.30 82.98 94.41 94.83 84.30 93.02 94.66 81.57
Term sim 93.13 93.43 83.79 92.96 94.04 81.09 93.58 94.55 82.68 93.53 93.73 84.66 94.42 95.09 84.85 93.44 94.11 82.57
Topic sim 92.50 93.16 82.87 92.70 94.48 81.43 93.97 94.09 82.07 93.21 93.22 83.98 94.42 93.71 84.98 93.09 94.02 82.90
Diversity 92.33 92.58 83.01 93.08 93.56 80.93 94.37 93.97 83.98 93.33 93.05 83.92 94.62 94.94 85.84 93.33 93.44 82.80
Term+topic sim 92.80 93.69 82.87 92.70 92.28 81.13 93.57 93.76 82.97 93.56 93.61 84.65 94.41 94.23 84.43 93.07 94.68 82.43
W2v sim+div 92.76 92.38 82.34 93.51 94.19 80.77 93.96 94.10 84.26 93.45 93.39 84.47 94.36 94.95 85.53 93.32 93.20 82.32
Term sim+div 92.73 93.46 83.72 92.90 93.81 81.60 94.03 93.47 82.80 93.47 93.29 84.62 94.76 95.06 85.44 93.32 93.68 82.87
Topic sim+div 92.93 93.62 82.60 92.62 93.93 80.83 93.85 94.06 84.04 93.16 93.59 84.45 94.42 94.45 85.89 93.38 94.23 82.33
[image:6.595.78.524.61.182.2]All source data 94.30 95.16 86.34 94.34 95.90 85.57 95.40 95.90 87.18 94.90 95.03 87.51 95.53 95.79 88.23 94.19 95.64 85.20
Table 3: Results for data selection for part-of-speech tagging and parsing domain adaptation on the SANCL 2012 shared task dataset (Petrov and McDonald, 2012). POS: Part-of-speech tagging. Pars: Parsing. POS tagging models: Structured Perceptron (P); Bi-LSTM tagger (B) (Plank et al.,2016). Pars-ing model: Bi-LSTM parser (BIST) (Kiperwasser and Goldberg,2016). Evaluation metrics: Accuracy (POS tagging); Labeled Attachment Score (parsing). Best: bold; second-best: underlined.
conjunction with diversity features finally yield the best performance, outperforming the baselines by 2-6 points in absolute accuracy.
Finally, we compare data selection to training on all available source data (in this setup, 6,000 in-stances). The result complements the findings of the most-similar baseline: as domains are dissimi-lar, training on all available sources is detrimental.
0 50 100 150 200 250 300
92.0
92.5
93.0
93.5
94.0
Dev accuracy per # of iterations
Iteration Iteration
Accur
acy
word vec term sim diversity sim+div JS−−ex random
0 50 100 150 200 250 300
86
88
90
92
94
Dev accuracy: diversity
iters
Accur
acy
Iteration
Accur
acy
0 50 100 150 200 250 300
86
88
90
92
94
Dev accuracy: term similarity
Iteration
Accur
acy
0 50 100 150 200 250 300
86
88
90
92
94
Dev accuracy: word embedding similarity
Accur
acy
Iteration
Accur
acy
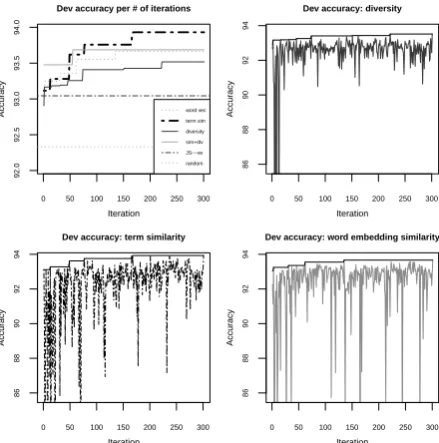
Figure 1: Dev accuracy curves of Bayes Optimiza-tion for POS tagging on the Reviews domain. Best dev acc for different feature sets (top-left). Best dev acc vs. exploration (top-right, bottom).
POS tagging Results for POS tagging are given in Table3. Using Bayesian Optimization, we are able to outperform the baselines with almost all feature sets, except for a few cases (e.g.,
diver-sity and word embeddings similarity, topic and term distributions). Overall term distribution-based similarity emerges as the most powerful in-dividual feature. Combining it with diversity does not prove as beneficial as in the sentiment analysis case, however, often yields the second-best results. Notice that for POS tagging/parsing, in con-trast to sentiment analysis, the most-similar do-main baseline is not effective, it often performs only as good as chance, or even hurts. In con-trast, the baseline that selects instances (JS – ex-amples) rather than a domain performs better. This makes sense as in SA topically closer domains ex-press sentiment in more similar ways, while for POS tagging having more varied training instances is intuitively more beneficial. In fact, when in-specting the domain distribution of our approach, we find that the best SA model chooses more in-stances from the closest domain, while for POS tagging instances are more balanced across mains. This suggests that the Web treebank do-mains are less clear-cut. In fact, training a model on all sources, which is considerably more and varied data (in this setup, 14-17.5k training in-stances) is beneficial. This is in line with find-ings in machine translation (Mirkin and Besacier,
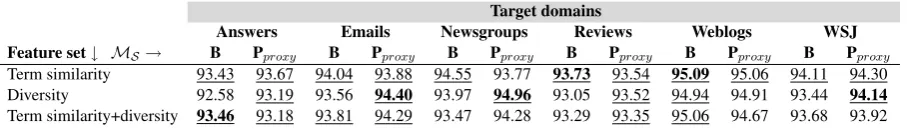
[image:6.595.73.293.401.623.2]Target domains
Answers Emails Newsgroups Reviews Weblogs WSJ
Feature set↓ MS→ B Pproxy B Pproxy B Pproxy B Pproxy B Pproxy B Pproxy
Term similarity 93.43 93.67 94.04 93.88 94.55 93.77 93.73 93.54 95.09 95.06 94.11 94.30 Diversity 92.58 93.19 93.56 94.40 93.97 94.96 93.05 93.52 94.94 94.91 93.44 94.14
[image:7.595.73.527.62.127.2]Term similarity+diversity 93.46 93.18 93.81 94.29 93.47 94.28 93.29 93.35 95.06 94.67 93.68 93.92
Table 4: Accuracy scores for cross-model transfer of learned data selection weights for part-of-speech tagging from Structured Perceptron (Pproxy) to Bi-LSTM tagger (B) (Plank et al.,2016) on the SANCL 2012 shared task dataset (Petrov and McDonald,2012). Data selection weights are learned using model
MS; Bi-LSTM tagger (B) is then trained using the learned weights. Better than baselines: underlined.
top-left graph displays the overall best dev accu-racy for different features. We observe again that term similarity is among the best feature sets and results in a larger explored space (more variance), in contrast to the diversity features whose devel-opment accuracy increases less and results in an overall less explored space. Exploration plots for other features/models looks similar.
Parsing The results for parsing are given in Ta-ble3. Diversity features are stronger than for POS tagging and outperform the baselines for all ex-cept the Reviews domain. Similarly to POS tag-ging, term distribution-based similarity as well as its combination with diversity features yield the best results across most domains.
5.1 Transfer across models
In addition, we are interested how well the met-ric learned for one target domain transfers to other settings. We first investigate its ability to trans-fer to another model. In practice, a metric can be learned using a model that is cheap to evaluate and serves as proxy for a state-of-the-art model, in a way similar to uptraining (Petrov et al., 2010). For this, we employ the data selection features learned using the Structured Perceptron model for POS tagging and use them to select data for the Bi-LSTM tagger. The results in Table4 indicate that cross-model transfer is indeed possible, with most transferred feature sets achieving similar re-sults or even outperforming features learned with the Bi-LSTM. In particular, transferred diversity significantly outperforms its in-model equivalent. This is encouraging, as it allows to learn a data selection metric using less complex models.
5.2 Transfer across domains
We explore whether data selection parameters learned for one target domain transfer to other tar-get domains. For each domain, we use the weights
Target domains
Feature DS B D E K
Sim B 75.39 75.22 80.74 80.41
Sim D 75.30 76.25 82.68 82.29 Sim E 74.55 76.65 81.91 82.23 Sim K 73.64 76.66 81.09 83.39
Div B 76.03 75.16 80.16 80.01
[image:7.595.307.524.207.403.2]Div D 75.68 77.48 65.74 72.48 Div E 74.69 76.60 81.15 81.97 Div K 75.03 76.23 80.71 83.94 Sim+div B 76.20 64.81 65.06 79.87 Sim+div D 74.17 77.60 83.26 85.19 Sim+div E 74.14 79.32 82.67 84.53 Sim+div K 75.54 76.11 78.72 84.98 SDAMS - 78.29 79.13 84.06 86.29
Table 5: Accuracy scores for cross-domain trans-fer of learned data selection weights on Amazon reviews (Blitzer et al.,2006). DS: target domain
used for learning metricS. B: Book. D: DVD. E: Electronics. K: Kitchen. Sim: term distribution-based similarity. Div: diversity. Best per feature set: bold. In-domain results: gray. SDAMS (Wu and Huang,2016) listed as comparison.
with the highest performance on the validation set and use them for data selection with the remaining domains as target domains. We conduct 10 runs for the best-performing feature sets for sentiment analysis and report the average accuracy scores in Table5(for POS tagging, see Table6).
The transfer of the weights learned with Bayesian Optimization is quite robust in most cases. Feature sets like Similarity or Diversity trained on Books outperform the strong JS – D
Target domains
Feature set DS Answers (A) Emails (E) Newsgroups (N) Reviews (R) Weblogs (W) WSJ
Term similarity A 93.13 91.60 93.94 93.63 94.26 92.42
Term similarity E 92.35 92.96 93.42 93.63 93.75 92.24
Term similarity N 92.48 92.28 93.58 93.35 93.95 93.00
Term similarity R 92.06 92.18 93.38 93.53 94.26 91.88
Term similarity W 92.69 92.12 93.65 93.12 94.42 92.63
Term similarity WSJ 92.50 92.51 93.53 93.00 94.29 93.44
Diversity A 92.33 92.14 93.46 92.00 94.01 92.56
Diversity E 92.11 93.08 93.81 92.67 94.16 93.13
Diversity N 92.67 92.22 94.37 92.44 94.05 92.96
Diversity R 92.65 92.72 93.67 93.33 94.18 93.28
Diversity W 92.19 92.31 93.31 92.20 94.62 92.04
Diversity WSJ 92.26 92.31 93.75 92.70 94.32 93.33
Term similarity+diversity A 92.73 92.63 93.16 92.58 93.88 92.23
Term similarity+diversity E 92.55 92.90 93.78 92.73 93.54 92.57
Term similarity+diversity N 92.47 92.27 94.03 92.63 94.30 93.14
Term similarity+diversity R 92.80 93.11 93.92 93.47 93.79 92.99
Term similarity+diversity W 92.61 92.45 93.44 93.52 94.76 93.26
[image:8.595.73.525.61.288.2]Term similarity+diversity WSJ 91.82 92.37 93.52 92.63 94.17 93.32
Table 6: Accuracy scores for cross-domain transfer of learned data selection weights for part-of-speech tagging with the Structured Perceptron model on the SANCL 2012 shared task dataset (Petrov and Mc-Donald,2012).DS: target domain used for learning metricS. Best: bold. In-domain results: gray.
Transferred similarity+diversity features mostly achieve higher performance than other feature sets, but the higher number of parameters runs the risk of overfitting to the domain as can be ob-served with two instances of negative transfer with sim+div features.
As a reference, we also list the performance of the state-of-the-art multi-domain adaptation ap-proach (Wu and Huang, 2016), which shows that task-independent data selection is in fact competi-tive with a task-specific, heuristic state-of-the-art domain adaptation approach. In fact our trans-ferred similarity+diversity feature (E->D) outper-forms the state-of-the-art (Wu and Huang, 2016) on DVD. This is encouraging as previous work (Remus,2012) has shown that data selection and domain adaptation can be complementary.
5.3 Transfer across tasks
We finally investigate whether data selection is task-specific or whether a metric learned on one task can be transferred to another one. For each feature set, we use the learned weights for each do-main in the source task (for sentiment analysis, we use the best weights on the validation set; for POS tagging, we use the Structured Perceptron model) and run experiments with them for all domains in the target task.7 We report the averaged accuracy
7E.g., for SA->POS, for each feature set, we obtain one
set of weights for each of 4 SA domains, which we use to
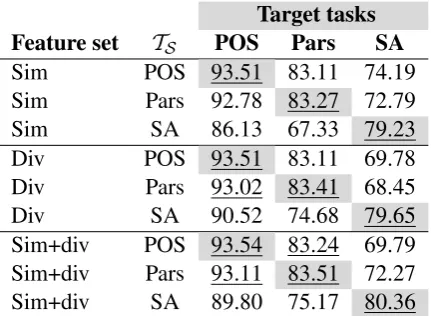
Target tasks
Feature set TS POS Pars SA
Sim POS 93.51 83.11 74.19
Sim Pars 92.78 83.27 72.79
Sim SA 86.13 67.33 79.23
Div POS 93.51 83.11 69.78
Div Pars 93.02 83.41 68.45
Div SA 90.52 74.68 79.65
Sim+div POS 93.54 83.24 69.79
Sim+div Pars 93.11 83.51 72.27
Sim+div SA 89.80 75.17 80.36
Table 7: Results of cross-task transfer of learned data selection weights. TS: task used for
learn-ing metricS. POS: Part-of-speech tagging. Pars: Parsing. SA: sentiment analysis. Accuracy scores for SA and POS; LAS Attachment Score for pars-ing. Models: Structured Perceptron (POS tag-ging); Bi-LSTM parser (Kiperwasser and Gold-berg, 2016) (Pars). Same features as in Table 5. In-task results: gray. Better than base: underlined.
scores for transfer across all tasks in Table7. Transfer is productive between related tasks, i.e. POS tagging and parsing results are similar to those obtained with data selection learned for the particular task. We observe large drops in perfor-mance for transfer between unrelated tasks, such
[image:8.595.308.524.352.510.2]as sentiment analysis and POS tagging, which is expected since these are very different tasks. Be-tween related tasks, the combination of similar-ity and diverssimilar-ity features achieves the most ro-bust transfer and outperforms the baselines in both cases. This suggests that even in the absence of target task data, we only require data of a related task to learn a successful data selection measure.
6 Related work
Most prior work on data selection for transfer learning focuses on phrase-based machine transla-tion. Typically language models are leveraged via perplexity or cross-entropy scoring to select tar-get data (Moore and Lewis,2010;Axelrod et al.,
2011; Duh et al., 2013; Mirkin and Besacier,
2014). A recent study investigates data selection for neural machine translation (van der Wees et al.,
2017). Perplexity was also used to select training data for dependency parsing (Søgaard,2011), but has been found to be less suitable for tasks such as sentiment analysis (Ruder et al.,2017). In general, there are fewer studies on data selection for other tasks, e.g., constituent parsing (McClosky et al.,
2010), dependency parsing (Plank and van Noord,
2011;Søgaard,2011) and sentiment analysis ( Re-mus, 2012). Work on predicting task accuracy is related, but can be seen as complementary (Ravi et al.,2008;Van Asch and Daelemans,2010).
Many domain similarity metrics have been pro-posed. Blitzer et al. (2007) show that proxy A
distance can be used to measure the adaptabil-ity between two domains in order to determine examples for annotation. Van Asch and Daele-mans (2010) find that Rényi divergence outper-forms other metrics in predicting POS tagging ac-curacy, whilePlank and van Noord(2011) observe that topic distribution-based representations with Jensen-Shannon divergence perform best for data selection for parsing.Remus(2012) apply Jensen-Shannon divergence to select training examples for sentiment analysis. Finally, Wu and Huang
(2016) propose a similarity metric based on a sen-timent graph. We test previously explored similar-ity metrics and complement them with diverssimilar-ity.
Very recently interest emerged in curriculum learning (Bengio et al., 2009). It is inspired by human active learning by providing easier exam-ples at initial learning stages (e.g., by curriculum strategies such as growing vocabulary size). Cur-riculum learning employs a range of data metrics,
but aims at altering the order in which the entire training data is selected, rather thanselectingdata. In contrast to us, curriculum learning is mostly aimed at speeding up the learning, while we focus on learning metrics for transfer learning. Other related work in this direction include using Re-inforcement Learning to learn what data to select during neural network training (Fan et al.,2017).
There is a long history of research in adaptive data selection, with early approaches grounded in information theory using a Bayesian learning framework (MacKay, 1992). It has also been studied extensively as active learning (El-Gamal,
1991). Curriculum learning is related to active learning (Settles, 2012), whose view is different: active learning aims at finding the most difficult instances to label, examples typically close to the decision boundary. Confidence-based measures are prominent, but as such are less widely appli-cable than our model-agnostic approach.
The approach most similar to ours is by
Tsvetkov et al. (2016) who use Bayesian Opti-mization to learn a curriculum for training word embeddings. Rather than ordering data (in their case, paragraphs), we use Bayesian Optimization for learning to select relevant training instances that are useful for transfer learning in order to pre-vent negative transfer (Rosenstein et al.,2005). To the best of our knowledge there is no prior work that uses this strategy for transfer learning.
7 Conclusion
We propose to use Bayesian Optimization to learn data selection measures for transfer learn-ing. Our results outperform existing domain sim-ilarity metrics on three tasks (sentiment analy-sis, POS tagging and parsing), and are competi-tive with a state-of-the-art domain adaptation ap-proach. More importantly, we present the first study on the transferability of such measures, showing promising results to port them across models, domains and related tasks.
Acknowledgments
References
Sanjeev Arora, Yingyu Liang, and Tengyu Ma. 2017. A Simple But Tough-to-Beat Baseline for Sentence
Embeddings. InICLR 2017.
Amittai Axelrod, Xiaodong He, and Jianfeng Gao.
2011. Domain adaptation via pseudo in-domain data
selection. InProceedings of the 2011 Conference on Empirical Methods in Natural Language
Process-ing. ACM.
Shai Ben-David, John Blitzer, Koby Crammer, and Fer-nando Pereira. 2007. Analysis of representations for
domain adaptation. Advances in Neural Information
Processing Systems, 19:137–144.
Y. Bengio, J. Louradour, R. Collobert, and J. Weston.
2009. Curriculum learning. In International
Con-ference on Machine Learning, ICML.
Anil Bhattacharya. 1943. On a measure of diver-gence between two statistical population defined
by their population distributions. Bulletin Calcutta
Mathematical Society 35.99-109 (1943): 28., 35(99-109):28.
David M. Blei, Andrew Y. Ng, and Michael I. Jordan.
2003. Latent Dirichlet Allocation. Journal of
Ma-chine Learning Research, 3(4-5):993–1022. John Blitzer, Mark Dredze, and Fernando Pereira.
2007. Biographies, bollywood, boom-boxes and
blenders: Domain adaptation for sentiment classi-fication. Annual Meeting-Association for Computa-tional Linguistics, 45(1):440.
John Blitzer, Ryan McDonald, and Fernando Pereira.
2006. Domain Adaptation with Structural
Corre-spondence Learning. Proceedings of the 2006 Con-ference on Empirical Methods in Natural Language Processing (EMNLP ’06), pages 120–128.
Danushka Bollegala, David Weir, and John Carroll. 2011. Using Multiple Sources to Construct a Sen-timent Sensitive Thesaurus for Cross-Domain
Senti-ment Classification. InProceedings of the 49th
An-nual Meeting of the Association for Computational Linguistics: Human Language Technologies-Volume
1, pages 132–141.
Konstantinos Bousmalis, George Trigeorgis, Nathan Silberman, Dilip Krishnan, and Dumitru Erhan.
2016.Domain Separation Networks.NIPS.
E Brochu, V M Cora, and N De Freitas. 2010. A
tu-torial on Bayesian optimization of expensive cost functions, with application to active user modeling and hierarchical reinforcement learning. InCoRR.
Hal Daumé III. 2007. Frustratingly Easy Domain
Adaptation.Association for Computational Linguis-tic (ACL), (June):256–263.
Kevin Duh, Graham Neubig, Katsuhito Sudoh, and
Ha-jime Tsukada. 2013. Adaptation Data Selection
us-ing Neural Language Models: Experiments in Ma-chine Translation.ACL-2013, (1):678–683.
M. A El-Gamal. 1991. The role of priors in active Bayesian learning in the sequential statistical
deci-sion framework. InMaximum Entropy and Bayesian
Methods, pages 33–38. Springer Netherlands. Yang Fan, Fei Tian, Tao Qin, Jiang Bian, and Tie-Yan
Liu. 2017. Learning What Data to Learn. In
Work-shop track - ICLR 2017.
Jing Jiang and ChengXiang Zhai. 2007. Instance
Weighting for Domain Adaptation in NLP. Pro-ceedings of the 45th Annual Meeting of the Associ-ation of ComputAssoci-ational Linguistics, (October):264– 271.
Eliyahu Kiperwasser and Yoav Goldberg. 2016.
Sim-ple and Accurate Dependency Parsing Using Bidi-rectional LSTM Feature Representations. Transac-tions of the Association for Computational
Linguis-tics, 4:313–327.
Aaron Klein, Stefan Falkner, and Frank Hutter. 2017.
Fast Bayesian Optimization of Machine Learning Hyperparameters on Large Datasets. InProceedings of the 20th International Conference on Artificial In-telligence and Statistics (AISTATS 2017).
Lillian Lee. 2001. On the Effectiveness of the Skew
Divergence for Statistical Language Analysis.
AIS-TATS (Artificial Intelligence and Statistics), pages 65–72.
J Lin. 1991. Divergence Measures Based on the
Shan-non Entropy. IEEE Transactions on Information
theory, 37(1):145–151.
Ji Ma, Yue Zhang, and Jingbo Zhu. 2014.Tagging The
Web: Building A Robust Web Tagger with Neural Network. Proceedings of the 52nd Annual Meet-ing of the Association for Computational LMeet-inguistics (Volume 1: Long Papers), pages 144–154.
David J. C. MacKay. 1992. Information-Based
Ob-jective Functions for Active Data Selection. Neural Computation, 4(4):590–604.
Yishay Mansour. 2009. Domain Adaptation with
Mul-tiple Sources. Neural Information Processing Sys-tems Conference (NIPS 2009).
David McClosky, Eugene Charniak, and Mark John-son. 2010. Automatic domain adaptation for
pars-ing. InHuman Language Technologies: The 2010
Annual Conference of the North American Chap-ter of the Association for Computational Linguistics, pages 28–36. Association for Computational Lin-guistics.
Tomas Mikolov, Kai Chen, Greg Corrado, and Jeffrey
Dean. 2013. Distributed Representations of Words
and Phrases and their Compositionality.NIPS. Shachar Mirkin and Laurent Besacier. 2014. Data
se-lection for compact adapted smt models. InEleventh
Jonas Moˇckus. 1974. On bayesian methods for
seek-ing the extremum. InOptimization Techniques IFIP
Technical Conference Novosibirsk.
Robert C Moore and William D Lewis. 2010. Intel-ligent Selection of Language Model Training Data.
ACL-2010: 48th Annual Meeting of the Association for Computational Linguistics, (July):220–224. Sinno Jialin Pan and Qiang Yang. 2010. A survey on
transfer learning. IEEE Transactions on Knowledge
and Data Engineering, 22(10):1345–1359.
Jeffrey Pennington, Richard Socher, and
Christo-pher D. Manning. 2014. Glove: Global Vectors for
Word Representation.Proceedings of the 2014 Con-ference on Empirical Methods in Natural Language Processing, pages 1532–1543.
Slav Petrov, Pi-Chuan Chang, Michael Ringgaard, and Hiyan Alshawi. 2010. Uptraining for accurate
de-terministic question parsing. InProceedings of the
2010 Conference on Empirical Methods in Natural Language Processing, pages 705–713. Association for Computational Linguistics.
Slav Petrov and Ryan McDonald. 2012. Overview of
the 2012 shared task on parsing the web. Notes of the First Workshop on Syntactic Analysis of Non-Canonical Language (SANCL), 59.
Barbara Plank and Gertjan van Noord. 2011. Effective
Measures of Domain Similarity for Parsing.
Pro-ceedings of the 49th Annual Meeting of the Associ-ation for ComputAssoci-ational Linguistics: Human Lan-guage Technologies, 1:1566–1576.
Barbara Plank, Anders Søgaard, and Yoav Goldberg.
2016. Multilingual Part-of-Speech Tagging with
Bidirectional Long Short-Term Memory Models and Auxiliary Loss. InProceedings of the 54th Annual Meeting of the Association for Computational Lin-guistics.
C. Radhakrishna Rao. 1982. Diversity and
dissimi-larity coefficients: a unified approach. Theoretical
population biology, 21(1):24–43.
Carl Edward Rasmussen. 2006. Gaussian processes
for machine learning. MIT Press.
Sujith Ravi, Kevin Knight, and Radu Soricut. 2008.
Automatic prediction of parser accuracy. In
Pro-ceedings of the Conference on Empirical Methods in Natural Language Processing, pages 887–896. As-sociation for Computational Linguistics.
Robert Remus. 2012. Domain adaptation using Do-main Similarity- and DoDo-main Complexity-based In-stance Selection for Cross-Domain Sentiment
Anal-ysis. InIEEE ICDM SENTIRE-2012.
Alfréd Rényi. 1961. On measures of entropy and
infor-mation. InProceedings of the fourth Berkeley sym-posium on mathematical statistics and probability, volume 1.
Michael T. Rosenstein, Zvika Marx, Leslie Pack Kael-bling, and Thomas G. Dietterich. 2005. To Transfer
or Not To Transfer. NIPS Workshop on Inductive
Transfer.
Sebastian Ruder, Parsa Ghaffari, and John G.
Bres-lin. 2017. Data Selection Strategies for
Multi-Domain Sentiment Analysis. In arXiv preprint arXiv:1702.02426.
Tobias Schnabel and Hinrich Schütze. 2014. FLORS:
Fast and Simple Domain Adaptation for Part-of-Speech Tagging.TACL, 2:15–26.
Burr Settles. 2012. Active learning literature survey.
Morgan and Claypool.
Claude E Shannon. 1948. A mathematical theory of
communication.The Bell System Technical Journal, 27(July 1928):379–423.
Edward H. Simpson. 1949. Measurement of diversity.
Nature.
Jasper Snoek, Hugo Larochelle, and Ryan P. Adams.
2012. Practical Bayesian Optimization of Machine
Learning Algorithms. Neural Information Process-ing Systems Conference (NIPS 2012).
Andres Søgaard. 2011. Data Point Selection for
Cross-Language Adaptation of Dependency Parsers. Pro-ceedings of the 49th Annual Meeting of the Associ-ation for ComputAssoci-ational Linguistics: Human Lan-guage Technologies (HLT ’11): Short Papers, pages 682–686.
Yulia Tsvetkov, Manaal Faruqui, Wang Ling, and Chris
Dyer. 2016.Learning the Curriculum with Bayesian
Optimization for Task-Specific Word Representa-tion Learning. In Proceedings of the 54th Annual Meeting of the Association for Computational Lin-guistics (ACL 2016).
Vincent Van Asch and Walter Daelemans. 2010.
Us-ing Domain Similarity for Performance Estimation.
Computational Linguistics, (July):31–36.
Marlies van der Wees, Arianna Bisazza, and Christof Monz. 2017. Dynamic data selection for neural
ma-chine translation. InProceedings of the 2017
Con-ference on Empirical Methods in Natural Language Processing.
Fangzhao Wu and Yongfeng Huang. 2016. Sentiment
Domain Adaptation with Multiple Sources.