Fitting Sentence Level Translation Evaluation
with Many Dense Features
Miloˇs Stanojevi´c
and
Khalil Sima’an
Institute for Logic, Language and Computation
University of Amsterdam
Science Park 107, 1098 XG Amsterdam, The Netherlands
{m.stanojevic,k.simaan}@uva.nl
Abstract
Sentence level evaluation in MT has turned out far more difficult than corpus level evaluation. Existing sentence level metrics employ a lim-ited set of features, most of which are rather sparse at the sentence level, and their intricate models are rarely trained for ranking. This pa-per presents a simple linear model exploiting 33 relatively dense features, some of which are novel while others are known but seldom used, and train it under thelearning-to-rank frame-work. We evaluate our metric on the stan-dard WMT12 data showing that it outperforms the strong baseline METEOR. We also ana-lyze the contribution of individual features and the choice of training data, language-pair vs. target-language data, providing new insights into this task.
1 Introduction
Evaluating machine translation (MT) output at the sen-tence/ segment levelhas turned out far more challeng-ing than corpus/ system level. Yet, sentence level evaluation can be useful because it allows fast, fine-grained analysis of system performance on individual sentences.
It is instructive to contrast two widely used metrics, METEOR (Michael Denkowski and Alon Lavie, 2014) and BLEU (Papineni et al., 2002), on sentence level evaluation. METEOR constantly shows better corre-lation with human ranking than BLEU (Papineni et al., 2002). Arguably, this shows that sentence level evaluation demands finer grained and trainable models overless sparse features. Ngrams, the core of BLEU, are sparse at the sentence level, and a mismatch for longer ngrams implies that BLEU falls back on shorter ngrams. In contrast, METEOR has a trainable model and incorporates a small, yet wider set of features that are less sparse than ngrams. We think that METEOR’s features and its training approachonly suggestthat sen-tence level evaluation should be treated as a modelling challenge. This calls for questions such as what model, what features and what training objective are better suited for modelling sentence level evaluation.
We start out by explicitly formulating sentence level evaluation as the problem ofrankinga set of
compet-ing hypothesis. Given data consistcompet-ing of human ranked system outputs, the problem then is to formulate an easy to train model for ranking. One particular exist-ing approach (Ye et al., 2007) looks especially attrac-tive because we think it meshes well with a range of effective techniques forlearning-to-rank(Li, 2011).
We deliberately select a linear modelling approach inspired byRankSVM(Herbrich et al., 1999), which is easily trainable for ranking and allows analysis of the individual contributions of features. Besides presenting a new metric and a set of known, but also a set of novel features, we target three questions of interest to the MT community:
• What kind of features are more helpful for sen-tence level evaluation?
• How does a simple linear model trained for rank-ing compare to the well-developed metric ME-TEOR on sentence level evaluation?
• Should we train the model for each language pair separately or for a target language?
Our new metric dubbed BEER1 outperforms
ME-TEOR on WMT12 data showing the effectiveness of dense features in a learning-to-rank framework. The metric and the code are available as free software2.
2 Model
Our model is a linear combination of features trained for ranking similar to RankSVM (Herbrich et al., 1999) or, to readers familiar with SMT system tuning, to PRO tuning (Hopkins and May, 2011):
score(sys) =w~·~xsys
wherew~ represents a weight vector and~xsys a
vec-tor of feature values for system output sys. Look-ing at evaluation as a rankLook-ing problem, we con-trast (at least) two system translations good and
bad for the same source sentence. Assuming that
humanRank(good) > humanRank(bad)as ranked
1BEER participated on WMT14 evaluation metrics task where it was the highest scoring sentence level evaluation metric on average over all language pairs (Stanojevi´c and Sima’an, 2014)
2https://github.com/stanojevic/beer
by human judgement, we expect metricscore(·)to ful-fillscore(good)> score(bad):
~
w·~xgood > w~·~xbad ⇔
~
w·~xgood−w~·~xbad > 0 ⇔
~
w·(~xgood−~xbad) > 0 ∧
~
w·(~xbad−~xgood) < 0
The two feature vectors(~xgood−~xbad)and(~xbad−
~xgood)can be considered as positive and negative
in-stances for training our linear classifier. For training this model, we use Logistic Regression from the Weka toolkit (Hall et al., 2009).
3 Features
Generally speaking we identifyadequacyandfluency
features. For both types we devise far less sparse fea-tures than word ngrams.
Adequacy features We use precisionP, recallRand F1-scoreFas follows:
Pfunc,Rfunc,Ffunc on matched function words
Pcont,Rcont,Fcont on matched content words
Pall,Rall,Fall on matched words of any type
Pchar,Rchar,Fchar matching of the char ngrams
By differentiating between function and non-function words, our metric weighs each kind of words accord-ing to importance for evaluation. Matchaccord-ing character ngrams, originally proposed in (Yang et al., 2013), re-wards certain translations even if they did not get the morphology completely right. Existing metrics use stemmers for this, but using character ngrams is inde-pendent of the availability of a good quality stemmer. Higher-order character ngrams have less risk of sparse counts than word ngrams. In our experiments we used char ngrams fornup to 6, which makes the total num-ber of adequacy features 27.
Fluency features To evaluate word order we follow (Isozaki et al., 2010; Birch and Osborne, 2010) in rep-resenting reordering as a permutationπover[1..n]and then measuring the distance to the ideal monotone per-mutationh1,2,· · · , ni. We present a novel approach based on factorization into permutation trees (PETs)
(Zhang and Gildea, 2007), and contrast it with Kendall
τ(Birch and Osborne, 2010; Isozaki et al., 2010). PETs are factorizations of permutations, which allows for an abstract andless sparseview of word order as exempli-fied next. Kendall score was regularly shown to have high correlation with human judgment on distant lan-guage pairs (Isozaki et al., 2010; Birch and Osborne, 2010).
Features based on PETs We informally review PETs in order to exploit them for novel ordering fea-tures. We refer the reader to (Zhang and Gildea, 2007) and (Maillette de Buy Wenniger and Sima’an, 2011) for a formal treatment of PETs and efficient factoriza-tion algorithms.
A PET of permutationπis a tree organization ofπ’s
unique, atomic building blocks, calledoperators. Ev-ery operator on a PET node is anatomic permutation
(not factorizing any further),3and it stands for the
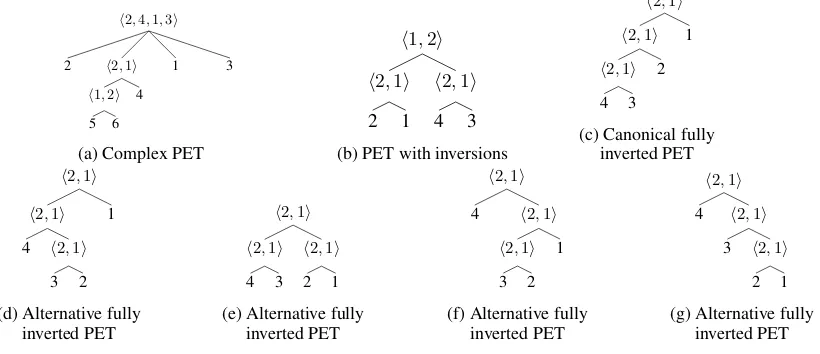
per-mutation of the direct children of that node. Figure 1a shows an example PET that has one 4-branching node with operatorh2,4,1,3i, two binary branching nodes of which one decorated with the inverted operatorh2,1i
and another with the monotoneh1,2i.
PETs have two important properties making them at-tractive for measuring order difference: firstly, order difference is measured on the operators – the atomic reordering building blocksof the permutation, and sec-ondly, the operators on higher level nodes capture hid-den ordering patternsthat cannot be observed without factorization. Statistics over ordering patterns in PETs are far less sparse than word or character ngram statis-tics.
Intuitively, among the atomic permutations, the bi-nary monotone operatorh1,2isignifies no ordering dif-ference at all, whereas the binary invertedh2,1i signi-fies the shortest unit of order difference. Operators of length four likeh2,4,1,3i(Wu, 1997) are presumably more complex than h2,1i, whereas operators longer than four signify even more complex order difference. Therefore, we devise possible branching feature func-tions over the operator length for the nodes in PETs:
• factor 2 - with two features:∆[ ]and∆<>(there
are no nodes with factor 3 (Wu, 1997))
• factor 4 - feature∆=4
• factor bigger than 4 - feature∆>4
Consider permutationsh2,1,4,3iandh4,3,2,1i, none of which has exactly matching ngrams beyond uni-grams. Their PETs are in Figures 1b and 1c. Intuitively,
h2,1,4,3iis somewhat less scrambled thanh4,3,2,1i
because it has at least some position in correct order. These “abstract ngrams” pertaining to correct order-ing of full phrases could be counted usorder-ing∆[ ]which
would recognize that on top of the PET in 1b there is a binary monotone node, unlike the PET in Figure 1c which has no monotone nodes at all.
Even though the set of operators that describe a per-mutation is unique for the given perper-mutation, the ways in which operators are combined (the derivation tree) is not unique. For example, for the fully monotone
h2,4,1,3i
2 h2,1i h1,2i
5 6 4
1 3
(a) Complex PET
h1,2i
h2,1i
2 1
h2,1i
4 3
(b) PET with inversions
h2,1i h2,1i h2,1i 4 3
2 1
(c) Canonical fully inverted PET
h2,1i
h2,1i 4 h2,1i
3 2 1
(d) Alternative fully inverted PET
h2,1i
h2,1i 4 3
h2,1i 2 1
(e) Alternative fully inverted PET
h2,1i
4 h2,1i
h2,1i 3 2
1
(f) Alternative fully inverted PET
h2,1i
4 h2,1i
3 h2,1i 2 1
[image:3.595.96.506.67.244.2](g) Alternative fully inverted PET
Figure 1: Examples of PETs
permutationh4,3,2,1ithere are 5 possible derivations (PETs) presented in Figures 1c, 1d, 1e, 1f and 1g. The features on PETs that we described so far look at the operators independently (they treat a derivation as a set of operators) so differenct derivations do not influ-ence the score–whichever derviation we use we will get the same feature score. However, the number of derivations might say something about thegoodnessof the permutation. Similar property of permutations was found to be helpful earlier in (Mylonakis and Sima’an, 2008) as an ITG prior for learning translation rule prob-abilities.
Permutations likeh3,2,1,4iandh2,4,3,1ihave the same set of operators, but the former factorizes into more PETs than the latter because h4,3i must group first before grouping it with2and then1inh2,4,3,1i. The “freedom to bracket” in different ways could be a signal of better grouping of words (even if they have inverted word order). Hence we exploit one more fea-ture:
∆count the ratio between the number of alternative
PETs for the given permutation, to the number of PETs that could be built if permutation was per-fectly grouped (fully monotone or fully inverted). Finding the number of PETs that could be built does not require building all PETs or encoding them in the chart. The number can be computed directly from the canonical left-branching PET. Since multiple different PETs appear only in cases when there is a sequence of more than one node that is eitherh1,2iorh2,1i(Zhang et al., 2008), we can use these sequences to predict the number of PETs that could be built. LetX represent a set of sequences of the canonical derivation. The num-ber of PETs is computed in the following way:
#P ET s= Y x∈X
Cat(|x|) (1)
Cat(n) =n+ 11
2n n
(2)
whereCat(·)is a Catalan number. The proof for this formula is beyond the scope of this paper. The reader can consider the example of the PET in Figure 1c. That derivation has one sequence of monotone operators of length 3. So the number of PETs that could be built is
Cat(3) = 5.
4 Experiments
We use human judgments from the WMT tasks: WMT13 is used for training whereas WMT12 for test-ing. The baseline is METEOR’s latest version (Michael Denkowski and Alon Lavie, 2014), one of the best met-rics on sentence level. To avoid contaminating the re-sults with differences with METEOR due to resources, we use the same alignment, tokenization and lower-casing (-normin METEOR) algorithms, and the same tables of function words, synonyms, paraphrases and stemmers.
Kendall τ correlation is borrowed from WMT12 (Callison-Burch et al., 2012):
τ =##concordantconcordant−+ ##discordantdiscordant−+ ##tiesties
#concordant represents the number of pairs or-dered in the same way by metric and by human,
#discordant the number of opposite orderings and
#tiesthe number of tied rankings by metric.
Beside testing our full metric BEER, we perform ex-periments where we remove one kind of the following features at a time:
1. char n-gram features (P, R and F-score)
2. all word features (P, R and F-score for all, function and content words),
3. all function and content words features
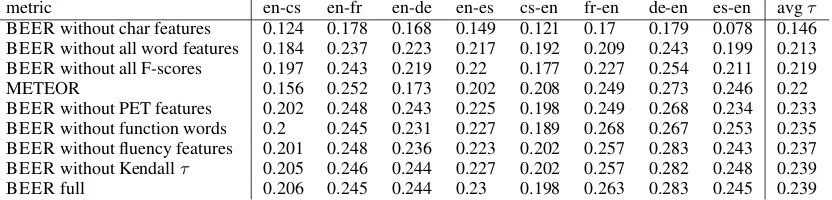
metric en-cs en-fr en-de en-es cs-en fr-en de-en es-en avgτ BEER without char features 0.124 0.178 0.168 0.149 0.121 0.17 0.179 0.078 0.146 BEER without all word features 0.184 0.237 0.223 0.217 0.192 0.209 0.243 0.199 0.213 BEER without all F-scores 0.197 0.243 0.219 0.22 0.177 0.227 0.254 0.211 0.219
METEOR 0.156 0.252 0.173 0.202 0.208 0.249 0.273 0.246 0.22
[image:4.595.75.491.63.163.2]BEER without PET features 0.202 0.248 0.243 0.225 0.198 0.249 0.268 0.234 0.233 BEER without function words 0.2 0.245 0.231 0.227 0.189 0.268 0.267 0.253 0.235 BEER without fluency features 0.201 0.248 0.236 0.223 0.202 0.257 0.283 0.243 0.237 BEER without Kendallτ 0.205 0.246 0.244 0.227 0.202 0.257 0.282 0.248 0.239 BEER full 0.206 0.245 0.244 0.23 0.198 0.263 0.283 0.245 0.239
Table 1: Kendallτscores on WMT12 data
5. PET features 6. Kendallτfeatures
7. all fluency features (PET and Kendallτ)
Table 1 shows the results sorted by their average Kendallτcorrelation with human judgment.
5 Analysis
Given these experimental results, we are coming back to the questions we asked in the introduction.
5.1 What kind of features are more helpful for sentence level evaluation?
Fluency vs. Adequacy The fluency features play a smaller role than adequacy features. Apparently, many SMT systems participating in this task have rather sim-ilar reordering models, trained on simsim-ilar data, which makes the fluency features not that discriminative rel-ative to adequacy features. Perhaps in a different ap-plication, for example MT system tuning, the reorder-ing features would be far more relevant because ignor-ing them would basically imply disregardignor-ing the im-portance of the reordering model in MT.
Character vs. Word features We observe that, pre-cision, recall and F-score oncharacter ngramsare cru-cial. We think that this shows that less sparse features are important for sentence level evaluation. The sec-ond best features are word features. Without word features, BEER scores just below METEOR, which suggests that word boundaries play a role as well. In contrast, differentiating betweenfunction and content wordsdoes not seem to be important.
PETs vs. Kendall τ Despite the smaller role for reordering features we can make a few observations. Firstly, while PETs and Kendall seem to have simi-lar effect on English-Foreign cases, in all four cases of Foreign-English PETs give better scores. We hypoth-esize that the quality of the permutations (induced be-tween system output and reference) is better for English than for the other target languages. Discarding PET features has far larger impact than discarding Kendall. Most interestingly, for de-en it makes the difference in outperforming METEOR. In many cases discarding Kendallτimproves the BEER score, likely because it
conflicts with the PET features that are found more ef-fective.
5.2 Is a linear model sufficient?
A further insight, from our perspective, is thatF-score
features constitute a crucial set of features,even when the corresponding precision and recall features are in-cluded. Because our model merely allows for linear in-terpolation, whereas F-score is a non-linear function of precision and recall, we think this suggests that a non-linear interpolation of precision and recall is useful.4
By formulating the evaluation as a ranking problem it is relatively easy to “upgrade” for using non-linear mod-els while using the same (or larger) set of features.
5.3 Train for the language pair or only for the target language?
All our models were trained for each language pair. This is not the case with many other metrics which train their models for each target language instead of language pair. We contrast these two settings in Table 2. Training for each language pair separately does not give significant improvement over training for the tar-get language only. A possible reason could be that by training for the target language we have more training data (in this case four times more).
Train for cs-en fr-en de-en es-en avgτ target lang 0.199 0.257 0.273 0.248 0.244 lang pair 0.198 0.263 0.283 0.245 0.247
Table 2: Kendallτscores on WMT12 for different training data
5.4 BEER vs. METEOR
The results across individual language pairs are mostly consistent with the averages with a few exceptions. BEER outperforms METEOR in five out of eight lan-guage pairs, ties at one (the difference is only 0.001 on es-en) and loses in two (en-fr and cs-en). In some cases BEER is better than METEOR by a large margin (see, e.g., en-cs, en-de).
4Interestingly, METEOR tunesβin F
6 Conclusion
In this work we show that combining less sparse fea-tures at the sentence level into a linear model that is trained on ranking we can obtain state-of-the-art re-sults. The analysis of the results shows that features on character ngrams are crucial, besides the standard word level features. The reordering features, while rather important, are less effective within this WMT task, al-beit the more abstract PET features have larger impact than the often used Kendall. Good performance of F-score features leads to the conclusion that linear models might not be sufficient for modeling human sentence level ranking and to learn the right relation between precision and recall it could be worthwhile exploring non-linear models.
Acknowledgments
This work is supported by STW grant nr. 12271 and NWO VICI grant nr. 277-89-002. We also thank TAUS and the other DatAptor project User Board members.
References
Alexandra Birch and Miles Osborne. 2010. LRscore for Evaluating Lexical and Reordering Quality in MT. InProceedings of the Joint Fifth Workshop on Statistical Machine Translation and MetricsMATR, pages 327–332, Uppsala, Sweden, July. Association for Computational Linguistics.
Chris Callison-Burch, Philipp Koehn, Christof Monz, Matt Post, Radu Soricut, and Lucia Specia. 2012. Findings of the 2012 Workshop on Statistical Ma-chine Translation. In Proceedings of the Seventh Workshop on Statistical Machine Translation, pages 10–51, Montr´eal, Canada, June. Association for Computational Linguistics.
Mark Hall, Eibe Frank, Geoffrey Holmes, Bernhard Pfahringer, Peter Reutemann, and Ian H. Witten. 2009. The WEKA Data Mining Software: An Update. SIGKDD Explor. Newsl., 11(1):10–18, November.
Ralf Herbrich, Thore Graepel, and Klaus Obermayer. 1999. Support Vector Learning for Ordinal Regres-sion. In In International Conference on Artificial Neural Networks, pages 97–102.
Mark Hopkins and Jonathan May. 2011. Tuning as Ranking. InProceedings of the 2011 Conference on Empirical Methods in Natural Language Processing, pages 1352–1362, Edinburgh, Scotland, UK., July. Association for Computational Linguistics.
Hideki Isozaki, Tsutomu Hirao, Kevin Duh, Katsuhito Sudoh, and Hajime Tsukada. 2010. Automatic Evaluation of Translation Quality for Distant Lan-guage Pairs. InProceedings of the 2010 Conference on Empirical Methods in Natural Language Process-ing, EMNLP ’10, pages 944–952, Stroudsburg, PA, USA. Association for Computational Linguistics.
Hang Li. 2011. Learning to Rank for Information Re-trieval and Natural Language Processing. Synthesis Lectures on Human Language Technologies. Mor-gan & Claypool Publishers.
Gideon Maillette de Buy Wenniger and Khalil Sima’an. 2011. Hierarchical Translation Equivalence over Word Alignments. InILLC Prepublication Series, PP-2011-38. University of Amsterdam.
Michael Denkowski and Alon Lavie. 2014. Meteor Universal: Language Specific Translation Evalua-tion for Any Target Language. InProceedings of the ACL 2014 Workshop on Statistical Machine Transla-tion.
Markos Mylonakis and Khalil Sima’an. 2008. Phrase Translation Probabilities with ITG Priors and Smoothing as Learning Objective. InProceedings of the 2008 Conference on Empirical Methods in Natu-ral Language Processing, pages 630–639, Honolulu, USA, October. Association for Computational Lin-guistics.
Kishore Papineni, Salim Roukos, Todd Ward, and Wei-Jing Zhu. 2002. BLEU: A Method for Automatic Evaluation of Machine Translation. InProceedings of the 40th Annual Meeting on Association for Com-putational Linguistics, ACL ’02, pages 311–318, Stroudsburg, PA, USA. Association for Computa-tional Linguistics.
Miloˇs Stanojevi´c and Khalil Sima’an. 2014. BEER: BEtter Evaluation as Ranking. InProceedings of the Ninth Workshop on Statistical Machine Translation, pages 414–419, Baltimore, Maryland, USA, June. Association for Computational Linguistics.
Dekai Wu. 1997. Stochastic inversion transduction grammars and bilingual parsing of parallel corpora.
Computational linguistics, 23(3):377–403.
Muyun Yang, Junguo Zhu, Sheng Li, and Tiejun Zhao. 2013. Fusion of Word and Letter Based Metrics for Automatic MT Evaluation. In Proceedings of the Twenty-Third International Joint Conference on Artificial Intelligence, IJCAI’13, pages 2204–2210. AAAI Press.
Yang Ye, Ming Zhou, and Chin-Yew Lin. 2007. Sen-tence Level Machine Translation Evaluation As a Ranking Problem: One Step Aside from BLEU. In
Proceedings of the Second Workshop on Statistical Machine Translation, StatMT ’07, pages 240–247, Stroudsburg, PA, USA. Association for Computa-tional Linguistics.
Hao Zhang and Daniel Gildea. 2007. Factorization of synchronous context-free grammars in linear time. InIn NAACL Workshop on Syntax and Structure in Statistical Translation (SSST.
Hao Zhang, Daniel Gildea, and David Chiang. 2008. Extracting Synchronous Grammar Rules From Word-Level Alignments in Linear Time. In