Automatic Pyramid Evaluation Exploiting EDU-based Extractive
Reference Summaries
Tsutomu Hirao1 and Hidetaka Kamigaito2 and Masaaki Nagata1
1NTT Communication Science Laboratories, NTT Corporation 2Institute of Innovative Research, Tokyo Institute of Technology 1{hirao.tsutomu,nagata.masaaki}@lab.ntt.co.jp
Abstract
This paper tackles automation of the pyramid method, a reliable manual evaluation frame-work. To construct a pyramid, we transform human-made reference summaries into extrac-tive reference summaries that consist of El-ementary Discourse Units (EDUs) obtained from source documents and then weight ev-ery EDU by counting the number of extractive reference summaries that contain the EDU. A summary is scored by the correspondences be-tween EDUs in the summary and those in the pyramid. Experiments on DUC and TAC data sets show that our methods strongly correlate with various manual evaluations.
1 Introduction
To develop high quality summarization systems, we need accurate automatic content evaluation. Although, various evaluation measures have been proposed, ROUGE-N (Lin,2004), Basic Elements (BE) (Hovy et al.,2006) remain the de facto stan-dard measures since they strongly correlate with various manual evaluations and are easy to use. However, the evaluation scores computed by these automatic measures are not so useful for improv-ing system performance because they merely con-firm if the summary contains small textual frag-ments and so they do not address semantic cor-rectness.
The pyramid method was proposed as a man-ual evaluation that well supports the improvement of summarization systems (Nenkova and Passon-neau, 2004; Nenkova et al., 2007). First, the method identifies conceptual contents, Summary Content Units (SCUs), in reference summaries and then constructs a pyramid by collecting se-mantically equivalent SCUs. The weight of an SCU in the pyramid is defined as the number of reference summaries that contain the SCU. Thus, an SCU shared by many reference summaries is
given higher weight. Second, a system summary is scored by the correspondences between SCUs in the summary and the pyramid. Its results are very useful for system improvement, i.e., we can know which important SCUs the system could or could not include in the summary. Although the pyramid method is reliable, it requires consider-able cost and effort.
To address the weaknesses, automatic pyra-mid evaluation, Pyrapyra-mid Evaluation via Auto-mated Knowledge Extraction (PEAK) was pro-posed (Yang et al., 2016). Since SCU is the conceptual content of the text, it is difficult to automatically extract them from reference sum-maries by systems. Thus, PEAK regards subject-predicate-object triples as alternatives to SCUs and constructs a pyramid by clustering semanti-cally equivalent triples. However, the performance of subject-predicate-object triples extraction is not satisfying for the practical demands and seman-tic similarity utilized for clustering the triples does not correlate well with human judgment (see Sec-tion 2). As a result, the resultant pyramid is un-reliable. Actually, PEAK is significantly inferior to ROUGE and BE (see Section 4.3) in terms of correlation.
rea-son why we derive extractive reference summaries whose SCUs are EDUs is as follows. First, Li et al. (2016) reported that EDUs are very simi-lar to SCUs. Second, the performance of EDU segmenter is sufficient to satisfy practical require-ments (see Section 2). Third, we do not need measure any semantic similarity to identify EDUs common to the extractive reference summaries. We also examine two types of extractive refer-ence summary. One is based on the alignment between EDUs in reference summary and source documents. The other is based on theextractive oracle summary (Hirao et al., 2017). We con-ducted experiments on the Document Understand-ing Conference (DUC) 2003 to 2007 data sets and Text Analysis Conference (TAC) 2008 to 2011 data sets. The results showed that our methods ex-hibit strong correlation with manual evaluations.
2 Background and Related Work
The pyramid method (Nenkova and Passonneau,
2004;Nenkova et al.,2007), a manual evaluation framework, was developed to measure the con-tent coverage of summaries. The pyramid method consists of two steps: (1) pyramid construction, and (2) summary scoring based on the pyramid. First, human annotators identify Summary Con-tent Units (SCUs), conceptual conCon-tent units in the reference summaries. They then construct a pyramid by clustering and weighting SCUs. The weight of an SCU is defined as the number of ref-erence summaries that contain the SCU. As a re-sult, if there are K reference summaries, the up-per bound weight of an SCU in the pyramid isK
and the lower bound is 1. Second, the score for a summary is determined by the correspondences between SCUs in the summary and those in the pyramid. Thus, the score is defined as the sum of weights of SCUs that correspond to those in the pyramid in the summary divided by the sum of SCU weight possible for an average-length ref-erence summary. The pyramid method has two advantages over conventional manual evaluations: (1) the score is not intuitive but is systematically computed, i.e., the score can be explained as the sum of weights of SCUs in the pyramid, (2) the correspondences between the SCUs in a summary and the pyramid tell us whether the summary con-tains important SCUs or not. Thus, the results ex-plicitly tell us why a summary was given a good or bad score.
During the past few years, studies have focused on the automatic scoring of summaries based on manually generated pyramids.Harnly et al.(2005) proposed a scoring method that matches SCUs in the pyramid with possible textual fragments in the summary. They enumerate all possible textual fragments within a sentence in the summary and compute similarity scores between the fragments and the SCUs in the pyramid based on unigram overlap. Then, they find the optimal correspon-dences between SCUs and the fragments that max-imize the sum of similarity scores. Passonneau et al.(2013) extended the method by introducing distributional semantics to compute the similarity scores between SCUs and the fragments.
Recently, Yang et al. (2016) proposed the first automatic pyramid method, Pyramid Evaluation via Automated Knowledge Extraction (PEAK). PEAK employs subject-predicate-object triples extracted by ClausIE (Del Corro and Gemulla,
2013) as SCUs, and constructs pyramids by cut-ting a graph whose vertices represent the triples and whose edges represent semantic similarity scores between the triples computed by Align, Disambiguate and Walk (ADW) (Pilehvar et al.,
2013). When evaluating a summary, PEAK con-structs a weighted bipartite graph whose vertices represent subject-predicate-object triples extracted from the pyramid and the summary, respectively; the edges represent the similarity scores between the triples as computed by ADW. It scores the summary by solving the Linear Assignment Prob-lem which involves maximizing the sum of the similarity scores on the bipartite graph.
The major difference between PEAK and our method is that the former regards the refer-ence summary as a set of subject-predicate-object triples while the latter regards a reference sum-mary as a set of EDUs obtained from the source documents. Thus, to construct high quality pyra-mids, PEAK is required to not only accurately extract the triples but also measure the seman-tic similarity between them accurately. However, in general, both extracting the triples and mea-suring the semantic similarity are still challeng-ing NLP tasks. The performances are not always achieved in practical use. Actually, the F-measure of ClausIE is around 0.6 (Del Corro and Gemulla,
Ref. 1 Ref. 2 Ref. 3 Ref. 4
Extractive reference extractor
Src. 1
e1, e2,…
……,e17
Src. 2
e18, e19,
……,e30
Src. 3
e31, e32,
……,e50
Ext. ref. 1 e3, e8, e10, e21 e25,e41
Human-made reference summaries Source
documents
Extractive reference summaries
Ext. ref. 2 e3, e8, e21,e30, e50
Ext. ref. 3 e3, e10, e19,e21, e25
Ext. ref. 4 e3, e10, e11,e25, e50
W=4
e3
e10 e21
e8 e25 e50
e11 e19 e41 e30
W=3
W=2
W=1
Pyramid
[image:3.595.76.290.62.340.2]e3: Ext. ref. 1, 2, 3, 4 e10: Ext. ref. 1, 3, 4 e21: Ext. ref. 1, 2, 3 e8: Ext. ref. 1, 2 e50: Ext. ref. 2, 4 e25: Ext. ref. 1, 4 e11: Ext. ref. 4 e19: Ext. ref. 3 e41: Ext. ref. 1 e30: Ext. ref. 1
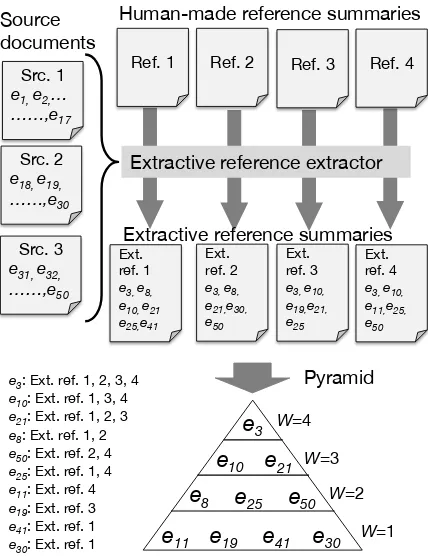
Figure 1: Overview of our pyramid construction.
(Pilehvar et al., 2013). As a result, the resultant pyramids have insufficient quality to be practical. Clearly, further improvement is necessary.
While our method is required to decompose a document into EDUs accurately, the EDU segmenter offers accurate decomposition perfor-mance; existing EDU boundary detection meth-ods have F-measures over 0.9 (Fisher and Roark,
2007;Feng and Hirst,2014). Moreover, since ex-tractive reference summaries are set of EDUs from the source documents, we do not need semantic similarity to identify EDUs that have the same meaning. Thus, we can easily construct a pyra-mid by simply counting the number of extractive reference summaries that contains each EDU.
3 Automatic Pyramid Evaluation
First, we transform human-made reference sum-maries into extractive reference sumsum-maries; the EDUs in the source documents are used as the atomic units. Second, we construct a pyramid by weighting EDUs in the extractive reference sum-maries. EDU weights are defined as the number of reference summaries that contain each EDU (see Figure1). In addition, we propose two techniques for deriving the extractive reference summaries.
3.1 Extractive Reference Summaries based on Alignment between EDUs
When similarity scores between EDUs in a refer-ence summary and those in the source documents are available, we can regard extractive reference summary derivation as an optimal alignment prob-lem with a length constraint, an extension of Lin-ear Assignment Problem. We assume that a bi-partite graph in which the vertices represent EDUs in the reference summary and source documents, and the edges represent similarity scores between the EDUs. The optimal alignment is obtained by solving following ILP problem:
maximize |E|
X
j=1
|M|
X
k=1
φ(ej, mk)aj,k (1)
s.t. |E|
X
j=1
|M|
X
k=1
`(ej)aj,k≤Lmax (2)
|E|
X
j=1
aj,k ≤1 ∀k (3)
|M|
X
k=1
aj,k ≤1 ∀j (4)
aj,k ∈ {0,1} ∀j, k. (5)
E is the set of all EDUs in the source documents andMis the set of all EDUs in the reference sum-mary.`()returns the length (the number of words) of a textual unit. φ(ej, mk)returns the similarity score between thej-th EDU in the source docu-ments and thek-th EDU in the reference summary as follows:
φ(ej, mk) =
`(LCS(ej, mk))
`(mk)
. (6)
LCS(·,·) returns the Longest Common Subse-quence between ej and mk. aj,k is a binary in-dicator, andaj,k = 1 denotes that thej-th EDU
[image:3.595.328.528.265.439.2]3.2 Extractive Reference Summaries based on Extractive Oracle Summaries
As another extractive reference summary, we can utilize extractive oracle summary (Hirao et al.,
2017). The extractive oracle summary is de-fined as the set of consequential textual fragments within a sentence obtained from the source docu-ments that has the maximum automatic evaluation score. Since we regard EDUs as SCUs and employ ROUGE/BE as an automatic evaluation measure, an extractive reference summary is a summary that consists of EDUs in the source documents and has maximum ROUGE/BE score.
For a given reference summary R, the extrac-tive oracle summary is defined as follows:
O = arg max E⊆E
f(R, S)
s.t. `(S)≤Lmax.
(7)
f() denotes an automatic evaluation measure (ROUGE/BE) and is defined as follows:
f(R, S) =
P|U|
i=1min{N(ui, R), N(ui, S)} P|U|
i=1N(ui, R)
. (8)
S is a system summary and U is the set of all atomic units in the reference summary. N-grams are utilized as the units used in comput-ing ROUGE and head-modifier-relation triples are utilized in computing BE.N(ui, R);N(ui, S) re-turns the number of occurrences of the units in the reference and system summary, respectively.
Since the extractive oracle summaries inHirao et al. (2017) are based on sentences, we extend the method to obtain EDU-based extractive oracle summaries. The ILP formulation that returns an extractive oracle summary is defined as follows:
maximize |U|
X
i=1
zi− |S|
X
m=1
sm (9)
s.t. |E|
X
j=1
`(ej)xj ≤Lmax (10)
N(ui, R)≥zi ∀i (11)
X
n∈Vi
dn≥zi ∀i (12)
xleft(n) ≥dn ∀n (13)
xright(n)≥dn ∀n (14)
sc(j)≥xj ∀j (15)
dn∈ {0,1} ∀n (16)
xj ∈ {0,1} ∀j (17)
zi ∈Z+ ∀i. (18)
zi is the count of the i-th unit in the oracle sum-mary. xj is a binary indicator, xj = 1 denotes that the j-th EDU, ej, is included in the oracle summary. sm is a binary indicator, sm = 1 de-notes that EDU(s) inm-th sentence is included in the oracle summary. The value of P|S|
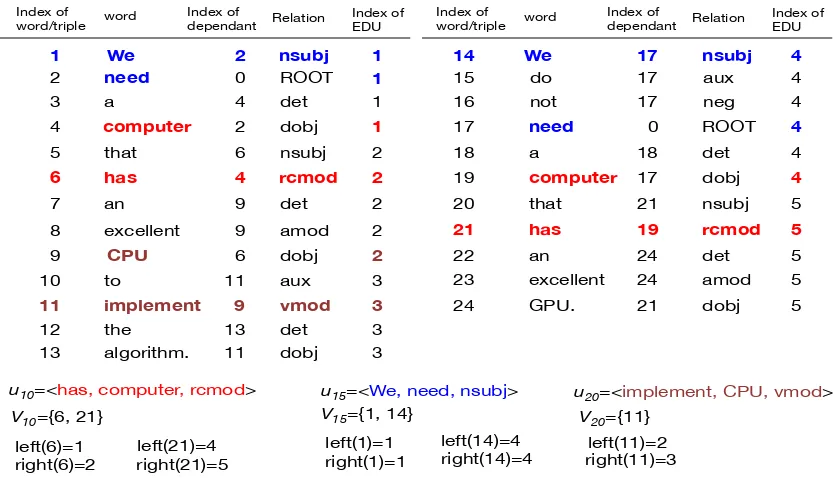
m=1sm is equal to the number of sentence whose EDU(s) is used in oracle summary. Thus, an oracle summary that consist of fewer sentences tends to obtain a higher objective value. Therefore, we can avoid generating fragmented oracle summaries with low readability. This objective function is inspired by the work of compressive summarization method (Morita et al., 2013). Vi is the set of indices in-dicating the position of the i-th unit, anddn is a binary indicator indicating whether the n-th unit is contained in the oracle summary or not. Func-tion left(·) and right(·) return the index of EDU that contains a word on the left in the unit, and the index of EDU that contains a word on the right in the unit, respectively. Function c(·) returns the index of sentence that containsj-th EDU.
Figure2shows examples. Suppose that the 10-th triple inU is “<has,computer,rcmod>”. From the figure, the indices of the triple corresponding to “<has,computer,rcmod>” are 6 and 21. Thus,
V10 ={6,21}. The word on the left in the triples is “computer” and the word on the right is “has”. For the first triple, the index of the EDU that con-tains “computer” is 1 and the index of the EDU that contains “has” is 2. For the second triple, the index of the EDU that corresponds to “computer” is 4, while that of “has” is 5. Thus,left(6) = 1and right(6) = 2,left(21) = 4, andright(21) = 5.
After solving the ILP problem, we construct the extractive oracle summary by collecting EDUs ac-cording toxj = 1.
3.3 Pyramid Construction: EDU Weighting
By deriving extractive references, we can easily construct a pyramid. The weight of an EDU is defined as the number of extractive references that contain the EDU. Here,P is a complete set of all EDUs in K extractive reference summaries, i.e., P=SK
We need a computer that has an excellent CPU to implement the algorithm. 1 2 3 4 5 6 7 8 9 10 11 12 13 2 0 4 2 6 4 9 9 6 11 9 13 11 nsubj ROOT det dobj nsubj rcmod det amod dobj aux vmod det dobj 1 1 1 1 2 2 2 2 2 3 3 3 3 We need a computer that has an excellent GPU. 14 17 18 19 20 21 22 23 24 17 0 18 17 21 19 24 24 21 nsubj ROOT det dobj nsubj rcmod det amod dobj 4 4 4 4 5 5 5 5 5 do not 15 16 17 17 aux neg 4 4 Index of
word/triple word Index ofdependant Relation Index ofEDU
Index of
word/triple word Index ofdependant Relation Index ofEDU
u10=<has, computer, rcmod> V10={6, 21}
left(6)=1 right(6)=2
left(21)=4 right(21)=5
u15=<We, need, nsubj>
V20={11} left(1)=1
right(1)=1
left(14)=4 right(14)=4
u20=<implement, CPU, vmod>
[image:5.595.90.507.62.301.2]left(11)=2 right(11)=3 V15={1, 14}
Figure 2: Examples of head-modifier-relation triples.
of thej-th EDU inP is defined as follows:
wj =C(pj). (19)
C() returns the number of extractive reference summaries that contain pj, i.e., the maximum score of C(pj)isK and its minimum score is 1. Since all EDUs in the source documents are as-signed an integer score in the range of 01toK, the scoring can be regard as a variant of relative utility score (Radev and Tam,2003).
3.4 Automatic Scoring of Summaries
Based on the pyramid, we compute a score for a summary by aligning EDUs in the pyramid and EDUs in the system summary. By following PEAK, we find the optimal alignment by solv-ing the Linear Assignment Problem. That is, we compute all similarity scores between EDUs in the summary and pyramid and then find the maximal score so that each EDU in the system summary is matched to at most one EDU in the pyramid. The ILP formulation of the problem is as follows:
maximize |C| X i=1 |P| X j=1
g(ci, pj)wjαi,j (20)
s.t.
|C|
X
i=1
αi,j≤1 ∀i (21)
1The EDUs that are not included in pyramid have scores
of zero.
|P|
X
j=1
αi,j ≤1 ∀j (22)
αi,j ∈ {0,1} ∀i, j.(23)
Cis the set of EDUs in the system summary. Func-tion g() indicates a binary function based on the similarity score between EDUs as follows:
g(c, p) =
1 φ(c, p)≥t
0 otherwise. (24)
We sett= 0.55in our experiments (Section 4).
αi,j is a binary indicator,αi,j = 1denotes that thei-th EDU in the system summary is aligned to
j-th EDU in the pyramid.
The optimal solution of the objective function in the ILP problem (19)-(22) is not normalized. Since the unnormalized score is not suitable for comparing systems, we propose a normalization method. To normalize the score to satisfy the range of 0 to 1, we divide the score by the max-imum score of sum of the EDU weights. Since ev-ery EDU in the pyramid has both length (the num-ber of the word) and weight, the maximum score is derived by solving theknapsack problem:
maximize
|P|
X
j=1
wjxj (25)
s.t. |P|
X
j=1
2003 2004 2005 2006 2007
Manual evaluation Cov. Cov. Resp. Resp. Pyr. Resp. Pyr.
# of Topics 30 50 50 50 20 45 23
# of Systems 16 17 32 35 22 32 13
# of References 4 4 4,9 4 4
Summary length 100 100 250 250 250
[image:6.595.124.478.61.134.2]Summary type Generic Generic Query-focused Query-focused Query-focused
Table 1: Statistics of the data sets (DUC-2003 to 2007).
2008 2009 2010 2011
Manual evaluation Resp. Resp. Resp. Resp
Pyr. Pyr. Pyr. Pyr.
# of Topics 48 44 46 44
# of Systems 58 55 43 50
# of References 4 4 4 4
Summary length 100 100 100 100
Update Update Guided Guided
Summary type Initial Initial Initial Initial
Update Update Update Update
Table 2: Statistics of the data sets (TAC-2008 to 2011).
xj ∈ {0,1} ∀j (27)
xj is a binary indicator, and xj = 1 denotes that thej-th EDU is included in theknapsack.
Finally, the score is defined as Pyramid(P, S) = OTPLAP/OPTKP. OPTLAP and OPTLAP denote maximum score of Equation (20) and maximum score of Equation (25), respectively.
4 Experiments
To investigate the effectiveness of our automatic evaluation method, we compare the correlation co-efficients yielded by our methods with those ob-tained from strong baselines, 2, ROUGE-SU4 and BE. We employ ROUGE toolkit version 1.5.5 to compute ROUGE/BE scores and Stanford Parser (de Marneffe et al., 2006) to obtain head-modifier-relation triples. In addition, we exam-ine two types of oracle summaries for our method. One is ROUGE-2-based, the other is BE-based.
We evaluate automatic evaluation measures by Pearson’s correlationr, Spearman’s rank correla-tion ρ and Kendall’s rank correlation τ. Corre-lation coefficients are computed by average auto-matic score and average manual evaluation score for all topics.
4.1 Data Sets
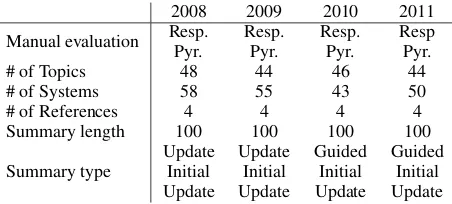
We conducted experiments on the data sets devel-oped for multi document summarization tasks in DUC-2003 to 2007 and TAC-2008 to 2011. Table
1and Table2show the statistics of the data sets.
DUC-2003 and 2004 were used for a generic summarization task with 100 word limit; mean coverage was used in a manual evaluation. DUC-2005 to 2007 were used for a query-focused sum-marization task with 250 word limit; responsive-ness was used in a manual evaluation. The number of topics varied from 30 to 50 and the participat-ing systems from 16 to 35. Note that the pyra-mid method was applied to small sets of topics in DUC-2006 and 2007.
TAC-2008 and 2009 were used for an update summarization task while TAC-2010 and 2011 were employed for a guided summarization task. For both tasks, the participating systems required two types of summaries,initial summaryand up-date summarywith 100 word limit. Both pyramid method and responsiveness were used in manual evaluations. In particular, TAC-2008 to 2011 have large numbers of participating systems, from 44 to 48.
4.2 EDU Segmenter
We regard decomposing a sentence into EDUs as a sequential tagging problem and implement a neu-ral EDU segmenter that classifies each word in a sentence as the boundary of EDU or not based on 3-layer bi-LSTM (Wang et al.,2015). The size of word embeddings and hidden layers of the LSTM were set to 100 and 256, respectively. To handle low-frequency words, all words are encoded to 40 dimension hidden state by using character-based bi-LSTM (Lample et al.,2016). To utilize entire words in a corpus, we integrated word dropout (Iyyer et al.,2015) into our models with smooth-ing rate, 1.0. Moreover, to avoid overfittsmooth-ing the training data, dropout layer was adopted to the in-put of the LSTMs with the ratio 0.3.
[image:6.595.75.301.177.279.2]2003 2004 2005 2006 2007
Cov. Cov. Resp. Resp. Pyr. Resp. Pyr.
ROUGE-2 .906/.821/.617 .909/.838/.691 .932/.931/.792 .836/.767/.584 .905/.884/.740 .880/.873/.715 .979/.989/.949 ROUGE-SU4 .782/.774/.600 .854/.772/.559 .925/.893/.731 .849/.790/.601 .885/.850/.706 .835/.832/.650 .961/.973/.897 BE .927/.862/.617 .936/.868/.721 .897/.867/.714 .834/.757/.584 .883/.837/.680 .891/.890/.732 .982/.973/.897
PEAK − − − .617/.640/− .508/.538/− − −
[image:7.595.75.539.63.155.2]Prop(BE) .936/.909/.750 .929/.892/.750 .845/.819/.657 .786/.716/.516 .877/.833/.687 .885/.881/.715 .936/.967/.897 Prop(ROUGE) .908/.874/.750 .938/.814/.676 .864/.809/.629 .740/.670/.465 .871/.818/.662 .853/.845/.679 .943/.951/.872 Prop(AL) .831/.841/.633 .904/.855/.735 .821/.757/.567 .762/.667/.465 .801/.772/.584 .814/.793/.610 .958/.962/.872
Table 3: Evaluation results from DUC-2003 to 2007.
Inital Update
Pyr. Resp. Pyr. Resp.
2008
ROUGE-2 .908/.909/.757 .830/.868/.677 .943/.942/.800 .910/.888/.728 ROUGE-SU4 .888/.885/.733 .803/.834/.636 .926/.933/.783 .902/.895/.725 BE .913/.903/.732 .817/.818/.627 .944/.939/.799 .913/.880/.712 Prop(BE) .926/.905/.734 .867/.852/.663 .940/.918/.779 .922/.899/.736 Prop(ROUGE) .895/.891/.708 .851/.840/.648 .912/.871/.702 .901/.872/.699 Prop(AL) .833/.792/.598 .779/.794/.602 .929/.895/.746 .909/.905/.750
Pyr. Resp. Pyr. Resp.
2009
ROUGE-2 .911/.950/.823 .757/.844/.674 .939/.896/.742 .717/.755/.600 ROUGE-SU4 .920/.925/.786 .767/.805/.631 .939/.857/.701 .729/.719/.568 BE .856/.931/.784 .692/.838/.670 .924/.929/.798 .695/.816/.670 Prop(BE) .867/.932/.782 .854/.848/.670 .855/.917/.782 .866/.810/.656 Prop(ROUGE) .886/.917/.770 .858/.819/.639 .864/.890/.741 .822/.735/.586 Prop(AL) .901/.872/.689 .881/.821/.666 .886/.857/.704 .830/.743/.594
Pyr. Resp. Pyr. Resp.
2010
ROUGE-2 .978/.917/.787 .967/.924/.801 .963/.911/.758 .953/.890/.742 ROUGE-SU4 .968/.947/.830 .954/.952/.837 .910/.885/.727 .900/.878/.727 BE .965/.942/.817 .943/.907/.749 .953/.911/.775 .928/.872/.713 Prop(BE) .949/.872/.713 .953/.867/.720 .954/.912/.764 .957/.913/.774 Prop(ROUGE) .952/.854/.673 .959/.859/.702 .938/.873/.713 .936/.860/.711 Prop(AL) .928/.882/.697 .929/.891/.720 .898/.853/.676 .900/.845/.691
Pyr. Resp. Pyr. Resp.
2011
ROUGE-2 .955/.888/.734 .930/.776/.592 .862/.789/.616 .879/.831/.665 ROUGE-SU4 .976/.888/.726 .943/.778/.585 .857/.824/.642 .892/.865/.689 BE .934/.900/.736 .903/.757/.554 .880/.828/.670 .842/.783/.610 Prop(BE) .905/.857/.690 .917/.832/.640 .891/.880/.693 .889/.868/.694 Prop(ROUGE) .925/.883/.708 .924/.847/.673 .864/.864/.689 .870/.862/.683 Prop(AL) .934/.891/.713 .920/.792/.618 .843/.787/.601 .865/.799/.607
Table 4: Evaluation results from TAC-2008 to 2011.
in our experiments were decomposed into EDUs by the segmenter.
4.3 Results and Discussion
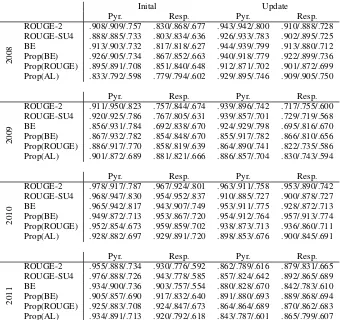
Table 3and 4list the correlation coefficients be-tween manual evaluation and automatic evalua-tion for DUC-2003 to 2007 and TAC-2008 to 2011, respectively. In the tables, the coeffi-cients are written in the order “Pearson’sr/ Spear-man’s ρ/ Kendall’s τ”. The rows of Prop(BE), Prop(ROUGE) and Prop(AL) denote our method with BE-based oracle summaries as extractive ref-erence summaries, with ROUGE-2-based oracle summaries, and with extractive reference sum-maries based on alignment, respectively. “Cov.”,
“Resp.” and “Pyr.” denote mean coverage, respon-siveness and manual pyramid, respectively.
With regard to mean coverage on DUC-2003 to 2004, Prop(BE) achieved the best correlation coefficients. The correlation coefficients indicate very strong correlation with the manual evalua-tion. Prop(ROUGE) and Prop(AL) attained com-parable correlation coefficients with the baseline methods. The correlation coefficients still indicate strong correlation.
[image:7.595.129.470.194.514.2]ex-ceed 0.8 except for responsiveness on DUC-2006. Since our methods mimic manual pyramid evalua-tion, correlation coefficients against manual pyra-mid on DUC-2006 to 2007 are better than those against responsiveness and the scores are compa-rable to those of the baselines.
Moreover, we compare our methods with PEAK on the DUC-2006 data set. For manual pyramid,
r andρ are 0.508 and 0.538, respectively, while for responsiveness they are 0.617 and 0.640, re-spectively. These scores are significantly lower than those attained by our methods and baselines. Note that these results are obtained by running the code from the author’s web pagehttp://www.
larayang.com/peak/. The results
demon-strated that our methods are superior to PEAK.
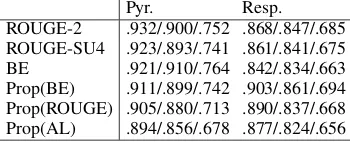
For manual pyramid on TAC-2008 to 2011, all methods attained quite strong correlation. The scores achieved were around 0.9 and better than those on DUC-2003 to 2007. In particular, Prop(BE) achieved the best scores in some cases. Although, responsiveness yielded lower correla-tion coefficients than manual pyramid, Prop(BE) still retains strong correlation , e.g., ρ are in the range of 0.857 to 0.932 against manual pyramid, 0.810 to 0.913 against responsiveness. The aver-age correlation coefficients across all data sets on TAC are shown in Table5. The average correlation coefficients of Prop(BE) slightly lower than those of ROUGE-2 and BE against manual pyramid. On the ohter hand, Prop(BE) achieved the best cor-relation coefficients against responsiveness. The results imply that Prop(BE) achieves comparable performance to baseline methods.
In a comparison of our methods, Prop(BE) attained the best results while Prop(ROUGE) showed better results than Prop(AL) in many cases. These results imply that extractive oracle summaries are helpful as extractive reference sum-maries and BE is better objective function to gen-erate them.
In addition, we show SCUs and correspond-ing EDUs obtained from a human-made pyramid and Prop(BE) in Figure 3. They are obtained from topic “Earthquake Sichuan (ID:D1110B)” from TAC-2011 Guided Summarization Task, the topic type is categorized as “Accidents and Nat-ural Disasters”. Summarizers are required to generate a summary that includes following as-pects: (1) WHAT: what happend, (2) WHEN: date, time, other temporal placement makers,
Pyr. Resp.
ROUGE-2 .932/.900/.752 .868/.847/.685 ROUGE-SU4 .923/.893/.741 .861/.841/.675
BE .921/.910/.764 .842/.834/.663
[image:8.595.327.502.63.134.2]Prop(BE) .911/.899/.742 .903/.861/.694 Prop(ROUGE) .905/.880/.713 .890/.837/.668 Prop(AL) .894/.856/.678 .877/.824/.656
Table 5: Average correlation coefficients across data sets (TAC-2008 to TAC-2011)
(3) WHERE: physical location, (4) WHY: rea-sons for accident/disaster, (5) WHO AFFECTED: casualties (death, injury), or individuals other-wise negatively affected by the accident/disaster, (6) DAMAGES: damages caused by the acci-dent/disaster, (7) COUNTERMEASURES: coun-termeasures, rescue efforts, prevention efforts, other reactions to the accident/disaster. From the figure, we can see that the EDUs are not always identical to human-generated SCUs at word-level but are identical at concept-level.
In short, these results imply that our methods have at least comparable performance to the base-lines. Although our methods are outperformed by the baselines in some cases, the correlation coeffi-cients are high enough against manual evaluation. Moreover, our methods have a significant advan-tage over the baselines methods because our meth-ods clearly indicate whether the output of the text summarization system failed to include important SCUs. Thus, our automatic pyramid method en-hanced with extractive oracle summaries is help-ful for further improvement of summarization sys-tems.
5 Conclusion
SCUs obtained from human-made pyramid
w= 4 The 7.8-magnitude earthquake struck
w= 4 Sichuan Province of China
w= 4 No warning signs detected
w= 4 Over 8,500 killed
w= 4 China allocated 200 million yuan ($29 Million) disaster relief
w= 1 Rain is forecast, could hamper relief efforts
w= 1 Quake also affected Gansu, Shaanxi provinces, and Chongqing municipality
EDUs obtained from pyramid of Prop(BE)
w= 1 The 7.8-magnitude earthquake struck Sichuan province shortly before 2:30 pm
w= 2 in aid for earthquake victims in Sichuan Province of China
w= 4 Chinese authorities did not detect any warning signs ahead of Monday’s earthquake
w= 1 leaving at least 12,000 people died
w= 2 China has allocated 200 million yuan
w= 1 Rain in the coming days in Sichuan is expected to hamper earthquake relief efforts, as well as increase risks of landslides
w= 1 50 in the municipality of Chongqing, 61 in Shaanxi province, and one in southwestern Yunnan
Figure 3: Examples of SCUs obtained from pyramids.
oracle summary.
To demonstrate the effectiveness of our meth-ods, we conducted experiments on DUC-2003 to 2007 and TAC-2008 to 2011 data sets. The re-sults demonstrated that our method yielded rere-sults that well correlated with various manual evalua-tions. The correlation coefficients are at least com-parable to those obtained from strong baselines, ROUGE-2, ROUGE-SU and BE and significantly higher than those obtained from previous auto-matic pyramid evaluation, PEAK.
References
Lynn Carlson, Daniel Marcu, and Mary Ellen Okurowski. 2001. Building a discourse-tagged cor-pus in the framework of rhetorical structure theory. In Proc. of the Second SIGdial Workshop on Dia-logue and Discourse, pages 1–10.
Luciano Del Corro and Rainer Gemulla. 2013. Clausie: clause-based open information extraction. In Pro-ceedings of the 22nd international conference on World Wide Web, pages 355–366.
Vanessa Wei Feng and Graeme Hirst. 2014. Two-pass discourse segmentation with pairing and global fea-tures. CoRR, abs/1407.8215.
Seeger Fisher and Brian Roark. 2007. The utility of parse-derived features for automatic discourse
seg-mentation. InProceedings of the 45th Annual Meet-ing of the Association of Computational LMeet-inguistics, pages 488–495.
Aaron Harnly, Ani Nenkova, Rebecca Passonneau, and Owen Rambow. 2005. Automation of summary evaluation by the pyramid method. In Proc. of the International Conference on Recent Advances in Natural Language Processing (RANLP 2005), pages 226–232.
Tsutomu Hirao, Masaaki Nishino, Jun Suzuki, and Masaaki Nagata. 2017. Enumeration of extractive oracle summaries. In Proc. of the 15th Confer-ence of the European Chapter of the Association for Computational Linguistics: Volume 1, Long Papers, pages 386–396.
Eduard Hovy, Chin-Yew Lin, Liang Zhou, and Junichi Fukumoto. 2006. Automated summarization evalu-ation with basic elements. InProc. of the 5th Inter-national Conference Language Resource and Eval-uation (LREC06), pages 899–902.
Mohit Iyyer, Varun Manjunatha, Jordan Boyd-Graber, and Hal Daum´e III. 2015. Deep unordered compo-sition rivals syntactic methods for text classification. In Proceedings of the 53rd Annual Meeting of the Association for Computational Linguistics and the 7th International Joint Conference on Natural Lan-guage Processing, pages 1681–1691.
Guillaume Lample, Miguel Ballesteros, Sandeep Sub-ramanian, Kazuya Kawakami, and Chris Dyer. 2016. Neural architectures for named entity recognition. InProc. of the 2016 Conference of the North Amer-ican Chapter of the Association for Computational Linguistics: Human Language Technologies, pages 260–270.
Junyi Jessy Li, Kapil Thadani, and Amanda Stent. 2016. The role of discourse units in near-extractive summarization. In Proc. of the 17th Annual Meet-ing of the Special Interest Group on Discourse and Dialogue, pages 137–147.
Chin-Yew Lin. 2004. ROUGE: A Package for Auto-matic Evaluation of Summaries. InProc. of Work-shop on Text Summarization Branches Out, pages 74–81.
Mann, William Charles and Thompson, Sandra An-near. 1988. Rhetorical Structure Theory: Toward a functional theory of text organization. Text, 8(3):243–281.
Hajime Morita, Ryohei Sasano, Hiroya Takamura, and Manabu Okumura. 2013. Subtree extractive sum-marization via submodular maximization. In Pro-ceedings of the 51st Annual Meeting of the Asso-ciation for Computational Linguistics, pages 1023– 1032.
Ani Nenkova and Rebecca Passonneau. 2004. Eval-uating content selection in summarization: The pyramid method. In Proc. of the Human Lan-guage Technology Conference of the North Ameri-can Chapter of the Association for Computational Linguistics:HLT-NAACL 2004, pages 145–152.
Ani Nenkova, Rebecca Passonneau, and Kathleen McKeown. 2007. The pyramid method incorporat-ing human content selection variation in summariza-tion evaluasummariza-tion. ACM Transactions on Speech and Language Processing (TSLP), 4(2).
Rebecca J. Passonneau, Emily Chen, Weiwei Guo, and Dolores Perin. 2013. Automated pyramid scoring of summaries using distributional semantics. In Pro-ceedings of the 51st Annual Meeting of the Associa-tion for ComputaAssocia-tional Linguistics, pages 143–147.
Mohammad Taher Pilehvar, David Jurgens, and Roberto Navigli. 2013. Align, disambiguate and walk: A unified approach for measuring semantic similarity. InProceedings of the 51st Annual Meet-ing of the Association for Computational LMeet-inguis- Linguis-tics, pages 1341–1351.
Dragomir R. Radev and Daniel Tam. 2003. Summa-rization evaluation using relative utility. In Proceed-ings of the Twelfth International Conference on In-formation and Knowledge Management, pages 508– 511.
Peilu Wang, Yao Qian, Frank K. Soong, Lei He, and Hai Zhao. 2015. Part-of-speech tagging with bidi-rectional long short-term memory recurrent neural network.CoRR, abs/1510.06168.