Master Thesis
Improving the productivity of the SubStation5.1ing process using discrete-event simulation
Author: Melle Edens Date: 11/03/2019
Study: Master Industrial Engineering & Management Production & Logistics Management
Confidential
This is a public version. If needed,
company names, employee names,
product names and types are
replaced by fictive names. In some
cases, sections are completely
iii
Company X
Company X
-
Company X B.V. Groenloseweg 28
7151 HW Place X +31 545 466466
http://www.Company X-Product B.com
Title: Improving the productivity of the SubStation5.1ing process using discrete-event simulation.
Date: 11/03/2019
Author: Melle Edens
[email protected] s1492519
Study Program: Master of Science Industrial Engineering & Management University of Twente
Faculty of Behavioral Management and Social Sciences
Examination committee:
University of Twente: dr. P.C. Schuur (1st supervisor)
ir. W. de Kogel-Polak (2nd supervisor)
Company X: dr. Person B MSc. (1st supervisor)
R&D Manager
Person A (2nd supervisor)
WCM Coordinator
Confidential
Confidential
v
Management summary
Motivation and research question
Company X is world’s leading manufacturer of Product B and offers powerful, precise and user-friendly solutions enabling customer to shape and surface-finish all types of materials. The production plant in Place X produces about 80 different A. Product A and Product B. From the start of 2018 Company X worldwide started with the implementation of Industry 4.0, which is the digitalization of all products and processes. The plant in Place X operates as pilot-plant regarding this project. In the current phase, they want to improve their pressing process.
Company X experiences a serious loss due to a high cycle time at this pressing process, especially at their indication press, which is Machine X. At this press, only the small A. Product A and Product B are produced. So, it is also known as a SubStation5.1. In total, Company X has five of these MachinesXYZ extra which are nearly identical. This means that the improvements on Machine X also could lead to the same improvements at all MachinesXYZ. Therefore, the following central research question is formulated:
“To what extent can the productivity of the pressing process, specifically at Machine X, within Company X be improved?”
Methods
In order to come to an answer to this central research question, we analyze the current situation and study the literature to find alternative solutions to the existing problem. The cycle time is analyzed over the year 2018 and the following performance is obtained:
Table 0-1. Performance of Machine X based on four KPIs measured over the period of September 2017 until October 2018.
KPI Performance
Average cycle time 4.244 seconds
Minimal cycle time 4.413 seconds
Maximal cycle time 4.060 seconds
Products below target of 4.000 seconds 0%
Machine X consists of two tables, a Machine X.2 and the Machine X.1, where each station has their own cycle time. In the figure below, we can see both tables schematically and in the attached video we can see the press in action. The station with the highest cycle time defines the cycle time of the overall process because after each operation one wheel is produced. We analyze the process by looking at each station separately in order to determine which stations can be identified as bottlenecks within the pressing process.
vi Figure 0.1. Schematic overview of the pressing process.
We identified the following bottlenecks:
SubStation10.2 station (at the Machine X.2) (station 10 of the Machine X.2 in the figure)
SubStation2.1 station (at the Machine X.1) (station 2 of the Machine X.1)
Waiting time of inlay stations
SubStation4.1 station (at the Machine X.1) (station 4 of the Machine X.1)
Since each station cycle time has a stochastic character, we decided to use a simulation model in order to evaluate several improvement options. The evaluated interventions can be found in the table below. Table 0-2. Improvement options per bottleneck that could be tested in the simulation model.
Bottleneck (station) Improvement option
SubStation10.2 station
Time reduction of moving the plunger (Dutch: stamper) down Distance reduction of crawl height (Dutch: kruiphoogte) Reduction of press time
SubStation2.1 station
Reduction of distance between mold and station SubStation4.1
station
Reduction of distance between inlayer and mold
vii Figure 0.2. Schematic overview of crawl height principle (left) and SubStation2.1 station (right).
Results and recommendations
The experiments are evaluated with the KPIs as mentioned in Table 0-1. Since the outcomes of the best experiments were very close, we need to make some concessions. Since the result of reducing the distance at the SubStation4.1 station is only marginal, the following outcomes correspond with the best experiment:
Reduce the SubStation10.2 time from 1.3 to 1.1 seconds after performing thorough research on reducing it on all different types of SubStation2.1 and pressure.
Reduce the crawl height of the plunger of the SubStation10.2 from 3 to 0 mm.
Adjust the moving time of the plunger of the SubStation10.2 from 80% to 90% of its maximum power.
Reduce the distance between the mold and the SubStation2.1 station by inserting plugs. Synchronize the system in a way that no waiting time occurs.
Table 0-3. Performance based on the four KPIs as outcome of the simulation model.
KPI Performance
Average cycle time 3.995 seconds
Minimal cycle time 3.921 seconds
Maximal cycle time 4.133 seconds
Products below target of 4.000 seconds 46.7% of total products
Besides this analysis based on the KPIs, we also look at the bottleneck contribution of the critical stations as mentioned. With the interventions as proposed above, a three-bottleneck situation originates with the SubStation2.1 station as the main bottleneck since its contribution is about 73%. The second major bottleneck is the SubStation10.2 station with about 20% contribution and thirdly the SubStation4.1 has a contribution of 7%. Furthermore, comparing the old situation with the new situation we can see that on a yearly basis 317,220 Product A extra can be produced. In terms of money, this would save Company X 12,255 euros on yearly basis. Let us see below what the savings for Machine X and for all MachinesXYZ are.
Only Machine X:
o Savings per year: €12,255
viii
All MachinesXYZ:
o Savings per year: €73,533
o Extra Product A produced per year: 1,903,322
In addition to the main goal of this research, we also performed a scenario analysis based on the average, minimal and maximal cycle time as respectively the average, best and worst case scenario. This analysis concerns the impact on the next steps in the overall production process, namely the curing process and the packing of the final products taking into account the need of help materials and the throughput time. We take the average case scenario as most realistic option. In terms of help materials, we can say that the improved productivity does not affect it negatively. However, within the total throughput time of 45.8 hours not all Product A can be handled. The main bottleneck in this system is the packing line, where the labor efficiency is too low, namely about 4 hours of backlog work that still needs to be done while a new batch of Product A arrives at the packaging line. Since this was also the case in the old situation, we think it can be of no harm to implement the proposed interventions with the remark that this packing line should be analyzed more deeply. Therefore, based on these results, we would recommend Company X the following:
Implement the proposed improvement options in order to decrease the cycle time of Machine X with a special attention for pressing time that should be investigated more deeply. When obtaining good results, also implement adjustments to the similar MachinesXYZ.
Focus on how to improve the SubStation2.1 station such that the cycle time could decrease further. Besides that, always continuously improve the pressing process.
Keep track of the cycle time in the right way in order to analyze it correctly. Besides that, create an unambiguous way of performance measurement within the company.
Reconsider the cycle time target of 4.000 seconds.
For further research, we would recommend Company X the following:
Investigate how to improve the labor efficiency at the packing line to deal with the improved productivity.
Investigate how to reduce stopping time of the machine like short stops, changeovers and set-ups in order to continuously improve the productivity of the pressing process.
Investigate on how to improve the factory performance overall by doing research on several aspects like factory layout, warehouse improvements and logistical flows.
Implementation
In order to make sure that the improvements as suggested are maintained, we develop a roadmap. Within this roadmap, we formulate which actions need to be done by whom and within which time frame. By following this roadmap, employees are triggered to perform these actions such that it becomes and even more important stays profitable to implement the intervention. In addition to this roadmap, we also implement a part of the proposed interventions. The intermediate results of this testing phase are as follows:
Reduction of average cycle time to 4.011 seconds.
Almost 50% of the products produced in 4.000 or less seconds.
ix
[image:9.612.71.501.86.406.2] SubStation2.1 station to be the new serious bottleneck in the process.
Figure 0.3. Roadmap for Company X in order to improve and control the production process.
Roadmap for maintaining and continuously improving press 51
Responsibles Deadline/time horizon
Action
Make sure that the display present at press 51 shows:
- The right real cycle time
- The right sub cycle times
Deadline: 01 march 2019
Check weekly if it is still correct Software engineer / IT
Weekly meeting about progress/performance of the previous
week
A fixed day in the week --> every week Project team
Create a team on how to improve the labor efficiency on the packing line
Team formed: 1 March 2019 Starting 1 March 2019 Monthly check on progress
Deadline end: 1 July 2019
Team leader packing line WCM Coordinator Daily check by an expert Every day depsite of time Technichal Department
Process Engineer
Monthly meeting about
progress/performance of the last month The first Monday of the month Project team Creating a team to investigate on how to
improve the cycle time of mix station
Team formed: 1 April 2019 Starting 1 April 2019 Monthly check on progress Deadline end: 1 October 2019
WCM coordinator
x
Preface
The report in front of you is the result of my graduation assignment for the Master Industrial Engineering & Management with as specialization Production & Logistics Management at the University of Twente. The research is executed on the behalf of Company X located in Place X within the department of Research and Development. During this research, I investigated how they could improve their cycle time within the pressing process of the overall production process.
First of all, I would like to thank Company X to give me the opportunity to perform this research within their company. Further, a special thanks to my two supervisors dr. Person B and Person A for their help and guidance during this assignment. In addition, I would like to thank all employees of Company X that helped me with providing and gathering all information and data that I needed during my research. Moreover, I would like to thank dr. Peter Schuur for being the first supervisor and his useful feedback and help during the research from the university. Furthermore, I also would like to thank ir. Wieteke de Kogel-Polak for being the second supervisor and useful input for this report.
I hope you enjoy reading this report! Melle Edens
xii
Glossary
Notion Explanation Introduced at page
X Company X p. 1
OEE Overall Equipment Effectiveness. A
measurement for the performance of the factory.
p. 3
Industry 4.0 Digitalization of all products and processes.
p. 3
KPI Key Performance Indicator p. 6
MACHINE X Machine X. p. 8
CycleTime(1) This is the average cycle time to make 1 product over a period of time.
p. 15
CycleTime(2) This is the cycle time of a machine or process at a certain point in time.
p. 15
HP SubStation10.2 p. 23
PCP SubStation5.1 p. 23
Crawl height (Dutch: kruiphoogte)
The distance between the mold and the plunger where the plunger is slowed down.
p. 33
Cavity (Dutch: mal) up/down
The movement of the mold going up or down.
p. 35
Plugs Small pieces that can be placed
under the mold such that the
distance to the SubStation2.1 station can be reduced.
p. 39
Plunger (Dutch: stamper) Part of the SubStation10.2 that stamps the materials together.
xiv
Table of Contents
Management summary ... v
Preface ... x
Glossary ... xii
List of Figures and tables ... xviii
1. Introduction ... 1
1.1. Company description... 1
1.2. Process description... 2
1.3. Research introduction ... 2
1.3.1. Motivation for research... 3
1.3.2. Problem description ... 3
1.3.3. Research objective and scope ... 4
1.3.4. Research questions ... 5
1.4. Research outline ... 6
2. Context analysis ... 7
2.1. SubStation5.1 process ... 7
2.1.1. Machine X.1 ... Error! Bookmark not defined. 2.1.2. Machine X.2 ... Error! Bookmark not defined. 2.1.3. Conveyor belt ... 13
2.1.4. Route of a product ... 14
2.2. Cycle times at the pancake process ... 15
2.2.1. Cycle time definition ... 15
2.2.2. Cycle times of type 1 ... 17
2.2.3. Other KPIs ... 18
2.3. Factor analysis of CycleTime(2) ... 21
2.3.1. Stations ... 21
2.3.2. Station cycle times and bottlenecks ... 22
2.3.3. Short stop analysis ... 23
2.4. Conclusion ... 24
3. Literature review ... 27
3.1. Cycle time reduction strategies ... 27
3.1.1. Lean Manufacturing ... 27
xv
3.1.3. Theory Of Constraints ... 28
3.2. Simulation models ... 28
3.2.1. Definition and applications of simulation ... 29
3.2.2. Benefits and drawbacks of simulation ... 29
3.2.3. Types of simulation models ... 30
3.2.4. Optimization within simulation ... 31
3.3. Similar research and Design of Experiments (DOE) ... 32
3.4. Conclusion ... 33
4. Alternative solutions and model ... 35
4.1. Cycle time improvements ... 35
4.1.1. Improvement options ... 35
4.1.2. Data ... 41
4.2. Simulation model ... 42
4.2.1. System description ... 42
4.2.2. Input data ... 45
4.2.3. Validation... 46
4.3. Experimental design ... 47
4.3.1. Warm-up, run length and number of replications ... 47
4.3.2. Experimental factors ... 47
4.3.3. Experimental ranges ... 48
4.3.4. Output values ... 49
4.4. Conclusion ... 49
5. Results ... 51
5.1. KPIs ... 51
5.1.1. Experiments ... 51
5.1.1. Bottleneck analysis ... 56
5.2. Sensitivity analysis ... 56
5.3. Consequences supply chain ... 59
5.3.1. Help materials ... 59
5.3.2. Scenario analysis Machine X... 60
5.4. Savings ... 62
5.5. Conclusion ... 62
xvi
6.1. Limitations ... 65
6.2. Further research ... 65
7. Implementation ... 69
7.1. Implementation plan ... 69
7.2. Results of implementation ... 71
8. Conclusion and recommendations ... 73
8.1. Conclusion ... 73
8.1.1. Bottlenecks and solutions ... 73
8.1.2. Cycle time and impact ... 74
8.1.3. Concluding words ... 74
8.2. Recommendations... 75
8.2.1. Research recommendations ... 75
8.2.2. Further research ... 75
Bibliography ... 77
Appendix A ... 79
Appendix B ... 85
xviii
List of Figures and tables
Figure 0.1. Schematic overview of the pressing process. ... vi
Figure 0.2. Schematic overview of crawl height principle (left) and SubStation2.1 station (right). ... vii
Figure 0.3. Roadmap for Company X in order to improve and control the production process. ... ix
Figure 1.1. Organization structure of Company X. ... 1
Figure 1.2. Example of several Product A produced by Company X (Company X Database). ... 2
Figure 1.3. Complete production process overview. ... 2
Figure 1.4. OEE losses on Machine X (Company X, 2018). ... 3
Figure 1.5. Research scope of production process, where green is the main focus and blue is a side scope. ... 5
Figure 2.1. Whole pressing process picture front view, where red = Machine X.1, green = Machine X.2, blue = conveyor belt (Company X Database). ... 8
Figure 2.2. Whole pressing process back view, where red = Machine X.1, green = Machine X.2, blue = conveyor belt (Company X Database). ... 8
Figure 2.3. Schematic overview of the whole pressing process... 9
Figure 2.4. Product composition wheel (Company X). ... 9
Figure 2.5. Machine X.1 picture, where 1 = SubStation1.1 station, 2 = SubStation2.1 station, 3 = SubStation3.1 station, 4 = SubStation4.1 station, 5 = SubStation5.1 station, 6 = pick-and-place station (Company X Database). ... 10
Figure 2.6. Schematic overview of the Machine X.1, where the number corresponds with Figure 2.5. .... 10
Figure 2.7. Machine X.2 picture front view, where 2 = SubStation1.2, 3 = SubStation2.2, 4 = SubStation3.2 station, 5,6,7 = waiting stations, 8 = pick-and-place station, 9 = waiting station, 10 = SubStation10.2 station (Company X Database). ... 11
Figure 2.8. Machine X.2 side view, where 11 = waiting station, 12 = pick-and-place station, 1 = waiting station, 2 = SubStation1.2 (Company X Database). ... 12
Figure 2.9. Schematic overview of the Machine X.2 with the number corresponding to the number in Figure 2.7 and 2.8. ... 12
Figure 2.10. Conveyor belt front view, where 1 = place/waiting station, 2 = weighting station, 3 = thickness station, 4 = waiting station, 5 = pick-and-place station (Company X Database). ... 13
Figure 2.11. Schematic overview of the conveyor belt with the number corresponding to Figure 2.10. .. 14
Figure 2.12. Route of a product. ... 15
Figure 2.13. Cycle time(1) Machine X (Sep-2017 till Oct-2018) (Company X, 2018). ... 17
Figure 2.14. OEE(2) Machine X (Sep-2017 till Oct-2017) (Company X, 2018). ... 19
Figure 2.15. OEE(2) loss on downtime Machine X (Sep-2017 till Oct-2018) (Company X, 2018). ... 20
Figure 2.16. OEE(2) loss due cycle time Machine X (Sep-2017 till Oct-2018) (Company X, 2018). ... 20
Figure 2.17. Design of solving the problem from context analysis till solutions for the existing problem. 25 Figure 4.1. Schematic overview of principle of crawl height (left) and cavity going up and down (right). 35 Figure 4.2. SubStation10.2 station - Plunger moving down with a crawl height indication (Company X Database)... 36
Figure 4.3. Cavity up and down of SubStation2.1 station, red = mold going up, green = mold going down (Company X Database). ... 37
xix Figure 4.5. Process of inserting plugs into the SubStation2.1 station, 1= SubStation2.1 station, 2 = with
green arrow indicated where plugs are placed, 3 = example of plugs, 4 = plugs inserted in the mold. ... 40
Figure 4.6. Overview Simulation Control Panel. ... 43
Figure 4.7. Flow chart of the ExitStation method used in the simulation model. ... 44
Figure 4.8. Flow chart of the LineExit method used in the simulation model. ... 45
Figure 5.1. Average cycle time per experiment based on the computations of the simulation model with a simulation time of one week, where the flattened peaks occur due to the boundaries of the input. ... 52
Figure 5.2. Standard deviation of the cycle time per experiment based on the computations of the simulation model with a simulation time of one week. ... 52
Figure 5.3. Minimal cycle time, lowest CycleTime(2), observed per experiment based on the output of the simulation model with a simulation time of one week. ... 53
Figure 5.4. Maximal cycle time, highest CycleTime(2), observed per experiment based on the output of the simulation model with a simulation time of one week, where the flattened peaks occur due to the boundaries of the input. ... 53
Figure 5.5. Number of products below the target of 4.000 seconds per experiment based on the output of the simulation model with a simulation time of one week. ... 54
Figure 5.6. Quality rate per experiment based on the computations of the simulation model with a simulation time of one week, where the flattened peaks occur due to the boundaries of the input. ... 54
Figure 5.7. Lapse of the cycle time target - sensitivity analysis, based on the out of the simulation model with a simulation time of one week. ... 58
Figure 5.8. Zoom of the lapse of the cycle time target, based on the out of the simulation model with a simulation time of one week. ... 58
Figure 5.9. Schematic figure of stacking of plates between blocks. ... 59
Figure 7.1. Roadmap for implementing the adaptions at Machine X and other important issues regarding the consequences of the adjustments. ... 71
Table 0-1. Performance of Machine X based on four KPIs measured over the period of September 2017 till October 2018. ... v
Table 0-2. Improvement options per bottleneck that could be tested in the simulation model. ... vi
Table 0-3. Performance based on the four KPIs as outcome of the simulation model. ... vii
Table 2-1. Statistics of cycle time Machine X (Company X, 2018)... 17
Table 2-2. Machine X.2 station cycle times (Company X, 2018). ... 22
Table 2-3. Machine X.1 station cycle times (Company X, 2018). ... 22
Table 2-4. Short stop analysis total (Company X, 2018). ... 23
Table 2-5. Short stop analysis average (Company X, 2018). ... 24
Table 2-6. Stations that could influence the machine cycle time. ... 25
Table 4-1. Distances per station that is used as input data. ... 42
Table 4-2. Example of input data used with corresponding probabilities. ... 45
Table 4-3. Distances used per station as input data for the simulation model. ... 45
Table 4-4. Statistics of the validation of the simulation model... 46
Table 4-5. Experimental ranges used as input for the experiments executed with the simulation model. 48 Table 4-6. Overview of the interventions proposed in this chapter in order to reduce the cycle time. .... 50
xx Table 5-2. Configurations of the best experiments, with the experiment number corresponding to the
number in Table 13. ... 55
Table 5-3. Bottleneck analysis of the best experiments. ... 56
Table 5-4. Sensitivity analysis part 1, with target of 4.10 to 4.06 seconds based on the out of the simulation model with a simulation time of one week. ... 56
Table 5-5. Sensitivity analysis part 2, with target of 4.05 to 4.01 seconds based on the out of the simulation model with a simulation time of one week. ... 57
Table 5-6. Sensitivity analysis part 3, with target of 4.00 to 3.96 seconds based on the out of the simulation model with a simulation time of one week. ... 57
Table 5-7. Sensitivity analysis part 4, with target of 3.95 to 3.92 seconds based on the out of the simulation model with a simulation time of one week. ... 57
Table 5-8. Help materials and other information for curing process (Company X Database). ... 59
Table 5-9. Number of products per period of time without OEE per scenario. ... 60
Table 5-10. Number of products per period of time with OEE per scenario. ... 61
Table 5-11. Help materials needed per scenario. ... 61
Table 5-12. Impact on the packing line of improved productivity per scenario. ... 61
Table 7-1. Checklist for operators before the can start an order. ... 69
Table 7-2. Example of filled form cycle times. ... 70
Table 7-3. Outcomes of the implementation testing phase in the period from 07-02-2019 till 14-02-2019 (Company X, 2018). ... 72
1
1.
Introduction
This report is written for completing the master of Industrial Engineering & Management at the University of Twente. This is reached by doing research at Company X (X) located in Place X with a duration of approximately six months. The research is executed within the Research and Development department of X.
In this first chapter, the company is introduced in section 1.1. In section 1.2, the overall production process of the Product A is described. After that, in section 1.3 the research is introduced by describing the motivation of the research, the problem description, the research objective and scope and finally the research questions. In the last section, section 1.4, the research framework is explained by connecting the research questions to the chapters and which data or literature is needed for solving each research question.
1.1.
Company description
Company X is a French multinational group that is market leader for the design, production and distribution of materials and solutions needed in the wellbeing of everyone now and in the future. They are established in 67 countries all over the world and have about 179,000 employees in service which are responsible for this design, production and distribution. The company is divided in three so-called “activities hubs”: Innovative materials, Construction products and Building distribution, where Innovative materials can be split up in Flat Glass and Performance Materials. Company X is part of the High-Performance Materials sector with a plant located in Place X. Company X is the world’s leading manufacturer of Product B and offers powerful, precise and user friendly solutions enabling customers to shape and surface-finish all types of materials (About Saint-Gobain, sd). In the video linked below, we can see an application of such a solution.
Figure 1.1. Organization structure of Company X.
2
1.2.
Process description
The production plant in Place X produces approximately 80 different Product A. In Figure 1.2 and on the front page of this report, we can see several Product A Company X is producing varying in size.
Figure 1.2. Example of several Product A produced by Company X (Saint-Gobain Abrasives Database).
[image:23.612.64.543.122.286.2]The production process starts with the raw materials coming in with a truck and stored in the warehouse. These raw materials are going to the SubStation2.1ing process when needed for an order. In this SubStation2.1ing process, grains, resins and fillers are combined and sieved.Next, the SubStation2.1 is checked on quality. When the quality of the SubStation2.1 is good enough, it has to rest for a couple of hours before it is ready for the next production step. In this next step, the pressing takes place. Before the pressing is done, several components, like the SubStation2.1, SubStation3.2, label and ring are processed all together into a wheel. During this process, each component is added step by step and eventually pressed to a so-called “Product A”.After stacking, the Product A are baked in the oven. Then the plates are cooled and unstacked to send them to the last quality control. When the quality is good enough again, they are packed at the packing line and sent to the warehouse where they are ready for distribution. The whole process in a flow chart depicted in Figure 1.3.
Figure 1.3. Complete production process overview.
1.3.
Research introduction
In this section, the motivation for the research is explained. Further, the main problem is described and the research scope and objective are elaborated. Finally, the main research question and the sub questions are formulated.
Confidential
3
1.3.1.
Motivation for research
An important worldwide project for Company X is the implementation of Industry 4.0 in all the production processes. Simply said, Industry 4.0 is the fourth phase of industrialization which comes down to the digitalization of all products and processes. During the implementation of Industry 4.0, the intelligent factory is originated and therefore intelligent manufacturing. The production plant located in Place X is chosen to be the pilot plant regarding the Industry 4.0 project.
[image:24.612.70.300.321.488.2]At the start of 2018, the plant in Place X started with this project as pilot-plant for Company X. During the first half-year of 2018, the processes of raw materials, storage, SubStation2.1ing and platforms have been mapped. The objective of this was to improve the traceability within the production process and optimize the quality of the SubStation2.1. Also for Company X, the optimization of the end product and production process is of importance. So, the next step within the process is to improve and digitalize the pressing process. Currently, within this pressing process Company X experiences losses in terms of productivity. Company X uses the Overall Equipment Effectiveness (OEE) as measurement for their machine efficiency. The OEE concerns the availability, performance and quality rate of the machine. The losses regarding this OEE can be due to two causes, namely downtime and cycle time losses. Since January 2018, the losses on Machine X, the press that is investigated, are divided as follows:
Figure 1.4. OEE losses on Machine X (Company X, 2018).
1.3.2.
Problem description
As Company X wants to optimize their production process overall, we investigate every process on its own on optimization possibilities. Currently, the cycle times within the pressing process, especially Machine X for this research, are suboptimal. There are several factors that influence the cycle time during the pressing step. Nowadays, there is some information about the factors influencing the cycle time at the presses negatively. However, this information should be sharpened to take directed actions in order to come to an improved cycle time. So, with the project of Industry 4.0 in mind, the question comes up on how to get more insight in the factors that have a negative impact on the cycle time and what actions to take. For giving an idea about the cycle time, below an equation is given on how Company X determines the cycle time. On a later point in this research, cycle times within Company X are described more deeply. So, average cycle time, from now on this is stated as CycleTime(1), is computed as follows:
𝐶𝑦𝑐𝑙𝑒𝑇𝑖𝑚𝑒(1) = 𝑃𝑟𝑜𝑑𝑢𝑐𝑡𝑖𝑜𝑛 ℎ𝑜𝑢𝑟𝑠 𝑟𝑒𝑎𝑙𝑖𝑧𝑒𝑑 ∗ 3600
4 The suboptimal cycle times are mainly caused by the machine settings. More specifically the combination of the machine settings. Currently, it is not clear which settings are leading to an improved cycle time of the pressing process. So, the bottleneck or bottlenecks of the process are not clear. Further, the short stops of the machine are of importance, because a lower cycle time with a same increase in short stops does not result in a better productivity overall. So, comparing it to Figure 1.4 the 20% of the losses due to cycle time have the main focus within this research. However, also a part of the 80% loss is investigated since that one cannot increase such that the productivity overall does not increase. Therefore, the main problem is formulated as follows:
“It is not clear which combination of machine settings, taking into account the quality requirements, lead to an improved cycle time with limited failures.”
The main problem consists of two aspects. The first aspect is more or less a technical issue where the best possible settings are investigated. The second aspect is to evaluate different combinations of settings to reduce the cycle time and improve the OEE overall.
1.3.3.
Research objective and scope
Since the core problem is defined as above and the main goal from Company X itself is stated as follows: “The common goal for Company X is to optimize the cycle times of the SubStation5.1ing process”, an overall research objective is formulated as follows:
“Get more insight in the factors that influence the cycle time negatively in order to take directed actions with respect to these factors such as to improve the cycle time and overall productivity of the SubStation5.1ing process.”
The so-called SubStation5.1ing process is explained in chapter 2 with a more detailed overview and description of this process. A sub objective of this research is also to investigate the consequences of this possible improved productivity. These consequences concern the inventory of help materials needed at both the baking and packing process.
5 Figure 1.5. Research scope of production process, where green is the main focus and blue is a side scope.
1.3.4.
Research questions
In this section, the research questions are formulated. First, a main research question is formulated to come to a well-founded conclusion when answering this main research question. In order to formulate such an answer, it is divided in several sub questions. The main research question is formulated as follows: “To what extent can the productivity of the pressing process, specifically at Machine X, within Company X be improved?”
As already mentioned, sub questions are also formulated to come to a structured answer. First, an analysis of the current situation is performed. The SubStation5.1ing process itself, the cycle time definition, current cycle times and insight in the factors that influence the cycle time are analyzed. Last, a small analysis on the current short stops is executed, because as mentioned these short stops cannot increase such that the productivity does not increase. Therefore, the following sub questions are formulated:
1. How is the current process of Machine X designed? 2. How is cycle time defined within Company X? 3. What are the cycle times of Machine X? 4. What other KPIs are important for Company X? 5. Which factors could influence the cycle time?
6. Which of these factors are the bottlenecks in the process?
7. How are the short stops distributed within the stations at the press?
Next, some literature research needs to be done. In order to find ways on how to reduce cycle times, several options are investigated. Since the cycle times are stochastically distributed and in consultation with Company X, a simulation model is used and we elaborate this decision in section 3.2. Before building this model, the best suitable type of simulation within the situation of Company X is defined. So, the following sub questions are formulated:
8. What is written in literature about reduction of cycle times?
9. What type of simulation models are known in the literature and which of these suits the situation within Company X the best?
Now that literature research is also done, alternative solutions can be proposed. Several options for improving the cycle time of the SubStation5.1 could be tested and analyzed by means of a simulation
6 model. Further, these possible improvements have consequences for the materials needed at the baking and packing process. Therefore, the following sub questions are formulated:
10. What alternative solutions can be thought of in order to achieve an improved cycle time at the SubStation5.1?
11. Which of these alternatives has the best performance?
12. How does this best alternative influence the inventory levels of help materials at the next production process steps?
Further, the finally chosen improvements are implemented within a real-time order or period to test if the best solution according to the simulation model shows the same performance as on the real pressing process.
13. To what extent do the implemented settings meet the expectations as concluded from the simulation model?
1.4.
Research outline
In this section, the research framework to answer the research questions is designed. Each chapter within this research is connected to some research questions and methods of data and information gathering. An overview of the framework and therefore the outline of the report is shown below.
1) The introduction of this research, where the company is introduced. Further, the production process and problem statement are described. For getting the problem clear, interviews are conducted in order to formulate a main research question.
2) In the second chapter the analysis of the current situation is done. First, the process is described more thoroughly. Further, data is collected and analyzed for getting a good overview of the current cycle times and the process bottlenecks. The first seven sub questions are answered in this section. 3) The third chapter consists of a literature review. Within the literature, possible solutions on how to solve the problem are investigated. Literature research is done by searching for papers and using libraries. The eighth and ninth sub question are answered within this chapter.
4) Next, possible solutions are designed by using both the literature and practical ideas. These solutions are evaluated by means of a simulation model such that the best solution can be identified. The tenth sub question is answered in this chapter.
5) Eventually, this best alternative is analyzed by looking at the performance and the inventory of the help materials needed at the baking and packing process. The eleventh and twelfth research questions are answered in this chapter.
6) Within this chapter, we discuss the limitations of this research. Besides, options for further research are formulated.
7) In this chapter, we discuss the results after implementing the best experiment. The results are discussed and compared to the results obtained from the simulation model. So, the thirteenth question is answered in this chapter.
7
2.
Context analysis
In this chapter, the context analysis is described. First, in section 2.1 the overall process of creating the Product A at the SubStation5.1 (MACHINE X) is explained. In section 2.2 the cycle time definition is explained, the current cycle times at Machine X are analyzed and other important Key Performance Indicators are explained. Next, a factor analysis is executed in order to find the bottlenecks within the process that influence the cycle time negatively. Lastly, a short analysis on the short stops of each station is executed.
Recap
Before analyzing the current situation, we give a small recap of what can be concluded from the first chapter. We observed a serious loss on the Overall Equipment Effectiveness for X partly caused by a cycle time of the pressing process that is too high. We want to know which factors influence this cycle time and therefore we perform this context analysis.
2.1.
SubStation5.1 process
In this section, we describe the process of producing the Product A in order to answer the first sub research question:
How is the current process Machine X designed?
We describe this process stepwise by first giving an overview of the whole process and the product. Next, each department is explained separately. This separate explanation is done by using two point of views, namely the mold and the product point of view and comparing a schematic overview with a real-time picture to give a better imagination of the process. We also show a picture of the whole process and compare it to the complete schematic overview.
8 Figure 2.1. Whole pressing process picture front view, where red = Machine X.1, green = Machine X.2, blue = conveyor belt (Saint-Gobain Abrasives Database).
Figure 2.2. Whole pressing process back view, where red = Machine X.1, green = Machine X.2, blue = conveyor belt (Saint-Gobain Abrasives Database).
9 Figure 2.3. Schematic overview of the whole pressing process.
[image:30.612.74.402.334.583.2]We can see the composition of the product in Figure 2.4. The upper two parts, the SubStation4.1 as number 1 and the SubStation2.1 as number 2, correspond to the Machine X.1 and therefore are the elements of the “pancake”. The other three parts, the SubStation3.2 as number 3, the label as number 4 and the ring as number 5, are corresponding to the process on the Machine X.2. All these five components together create the final wheel. We will refer to this figure in the sections when needed.
Figure 2.4. Product composition wheel (Saint-Gobain Abrasives).
2.1.1.
Machine X.1
This table consists of six stations and thus six molds which we can see in Figure 2.5 and Figure 2.6 both in real time and schematically. When all six jobs are finished, the table rotates such that the next job can take place. We first explain this by using the point of view of the mold starting at station 1. The numbers in the figure of the real press correspond with the numbers in the schematic overview. The Machine X.1 consists of six molds which are moving to the next station when all six jobs on each station are finished.
10 Figure 2.5. Machine X.1 picture, where 1 = SubStation1.1 station, 2 = SubStation2.1 station, 3 = SubStation3.1 station, 4 = SubStation4.1 station, 5 = SubStation5.1 station, 6 = pick-and-place station (Saint-Gobain Abrasives Database).
Figure 2.6. Schematic overview of the Machine X.1, where the number corresponds with Figure 2.5.
Mold point of view
1. At the first station, the mold is SubStation1.1ed if necessary. After a period of time the mold could become slippery and therefore needs to be SubStation1.1ed with magnesium.
2. At this station, the mold receives the SubStation2.1 equally divided on itself. This SubStation2.1 correspond to element 2 in Figure 2.4.
3. At this station, remainders of the SubStation2.1 accidentally ended up at the edge or middle of the mold are removed.
4. At this station, the mold receives a SubStation4.1 on top of the SubStation2.1. The SubStation4.1 corresponds to element 1 in Figure 2.4.
11 5. At this station, the press plunger is pressing the label and SubStation2.1 on the mold to create the
“pancake” built up of element 1 and 2 in Figure 2.4.
6. At this station, the pancake is taken out of the mold and the empty mold moves to the first station. Product point of view
1. In terms of product, at this station nothing happens.
2. At this station, the SubStation2.1, element 2 in Figure 2.4, needed for creating the pancake is inserted.
3. At this station, nothing happens in terms of the product.
4. At this station, the SubStation2.1 receives a SubStation4.1, element 1 in Figure 2.4, on top. 5. At this station, the pancake is created by pressing the SubStation2.1 and SubStation4.1 together. 6. At this station, the mold becomes empty by means of a robot arm that picks the pancake. Next,
the mold moves to station 1.
2.1.2.
Machine X.2
This table consists of twelve stations and thus twelve molds, and is depicted both in real pictures and a schematic overview in Figure 2.7, Figure 2.8 and Figure 2.9. This table also rotates with the same logic as at the Machine X.1. Again, we describe both point of views. The mold “starts” at station 1. The waiting stations at this table are present due to space restrictions. When the machine has a breakdown, an operator or engineer needs enough space to inspect the machine. For this table, we also attached a video of the process to give an extra visual imagination of the process.
Figure 2.7. Machine X.2 picture front view, where 2 = SubStation1.2, 3 = SubStation2.2, 4 = SubStation3.2 station, 5,6,7 = waiting stations, 8 = pick-and-place station, 9 = waiting station, 10 = SubStation10.2 station (Saint-Gobain Abrasives Database).
12 Figure 2.8. Machine X.2 side view, where 11 = waiting station, 12 = pick-and-place station, 1 = waiting station, 2 = SubStation1.2 (Saint-Gobain Abrasives Database).
Figure 2.9. Schematic overview of the Machine X.2 with the number corresponding to the number in Figure 2.7 and 2.8.
Mold point of view
1. At this station, the mold is waiting.
2. At this station, the mold receives the ring that can be seen in Figure 2.4 as element 5. 3. At this station, the mold receives a label which is element 4 in Figure 2.4.
4. At this station, the mold receives a glass cloth, element 3 in Figure 2.4, on top of the label. 5. At this station, the mold is waiting.
6. At this station, the mold is waiting. 7. At this station, the mold is waiting.
13 8. At this station, the mold receives the pancake from the other table on top of the already placed
ring, label and SubStation3.2. 9. At this station, the mold is waiting.
10. At this station, the SubStation10.2 plunger presses all components that can be seen in Figure 2.4 on the mold together such that the wheel is created.
11. At this station, the mold is waiting.
12. At this station, the mold becomes empty by means of a robot that picks the “wheel” out of the mold. Next, the mold moves to station 1.
Product point of view
1. In terms of product, nothing happens at this station. 2. Here the ring of the final product is inserted.
3. At this station, the ring receives the label on top.
4. At this station, the SubStation3.2 is inserted on top of the label. 5. Nothing happens.
6. Nothing happens. 7. Nothing happens.
8. At this station, the pancake from the other table is inserted on the components, the ring, label and SubStation3.2, inserted at station 2, 3 and 4.
9. Nothing happens.
10. At this station, the green “wheel” is created by pressing all components together. 11. Nothing happens.
12. At this station, for the product itself nothing happens. It is only moved to the next department.
2.1.3.
Conveyor belt
We can see the conveyor belt in Figure 2.10 in real and a schematic overview in Figure 2.11. It consists of five places which are explained below. The number in both figures correspond with each other. For this line, only the product point of view is described.
Figure 2.10. Conveyor belt front view, where 1 = place/waiting station, 2 = weighting station, 3 = thickness station, 4 = waiting station, 5 = pick-and-place station (Saint-Gobain Abrasives Database).
14 Figure 2.11. Schematic overview of the conveyor belt with the number corresponding to Figure 2.10.
1. The wheel coming from the Machine X.2 is placed on place 1, where it is waiting till station 2 is free.
2. At this station, the wheel is weighed. The weight of the wheel should be between the lower and upper limit.
3. At this station, the wheel is measured on thickness. The thickness of the wheel should be between the lower and upper limit.
4. At this station, the wheel is waiting until station 5 becomes free.
5. At this station, the wheel is picked up by a robot and placed on a plate, which we can see in Figure 2.10 on the right side. These plates are stacked before going into the baking process. Apart from that, when a wheel does not meet one of the requirements it is thrown away by the same robot arm.
2.1.4.
Route of a product
We describe the route a product goes on. At some points in time (T), at both tables two jobs are executed regarding the specific product.
T=1: The empty mold waits at station 1 on the Machine X.2.
T=2: The ring is inserted in the empty mold at station 2 on the Machine X.2.
T=3: The label is inserted on the ring at station 3 on the Machine X.2 and the empty mold arrives or is SubStation1.1ed at station 1 on the Machine X.1.
T=4: The SubStation3.2 is inserted on the label at station 4 on the Machine X.2 and the SubStation2.1 is divided on the mold at station 2 on the Machine X.1.
T=5: At station 5 on the Machine X.2, the components are waiting and at station 3 on the Machine X.1 the mold is cleaned if necessary.
T=6: At station 6 on the Machine X.2, the components are waiting and at station 4 on the Machine X.1 the SubStation4.1 is inserted on the SubStation2.1.
T=7: At station 7 on the Machine X.2, the components are waiting and at station 5 on the Machine X.1 the SubStation2.1 and SubStation4.1 are pressed together into a pancake.
T=8: At station 6 on the Machine X.1, the pancake is picked up and placed on the mold with the other components at station 8 on the Machine X.2.
T=9: At station 9 on the Machine X.2, the pancake and components are waiting. T=10: At station 10 on the Machine X.2, all components are pressed into one wheel. T=11: At station 11 on the Machine X.2, the wheel is waiting.
T=12: At station 12 on the Machine X.2, the wheel is picked up and placed on station 1 at the conveyor belt.
T=13: At station 1 on the belt, the wheel is waiting.
15 T=17: At station 5 on the belt, the wheel is picked up and placed on a plate before going to the baking process.
[image:36.612.68.526.156.324.2]So, a final wheel is produced within 17 steps. From t=3 until t=8, certain steps are processed parallel to each other which fastens the whole time from start until end. The route of a product is depicted in Figure 2.12.
Figure 2.12. Route of a product.
2.2.
Cycle times at the pancake process
In this section, the cycle time definition within Company X is explained. Next, the current cycle times are shown and analyzed. Furthermore, some other KPIs are discussed and analyzed. So, the second, third and fourth sub question are treated in this section.
2.2.1.
Cycle time definition
Now that the process has been described, a definition of the cycle times within Company X can be given. Therefore, the following sub question is answered in this section:
How is cycle time defined within Company X?
First of all, within Company X there are two different types of cycle time. The first one is the average product cycle time, also known as CycleTime(1), which is computed after a certain period of time. The second type is the machine or station cycle time, from now on stated as CycleTime(2). Obviously, the average machine cycle time over the same period of time is equal to the average product cycle time. Below, we discuss both types.
Average product cycle time – CycleTime(1)
As mentioned, the average product cycle time is computed over a certain period of time. It gives us the average time of producing unit from start until end. Simply said, this can be calculated with the equation that was stated in 1.3 (equation 1.a):
𝐶𝑦𝑐𝑙𝑒 𝑡𝑖𝑚𝑒 (1) =Poduction hours realized ∗ 3600
Number of good products made (𝑒2. 𝑎)
Where
16
Machine cycle time – CycleTime(2)
As we can see in Section 2.1. the total number of stations at the pressing process is 23. We have six stations at the Machine X.1, twelve station at the Machine X.2 and five at the conveyor belt. For this situation, we assume that a station is equal to a mold at the tables and the five spots on the conveyor belt are equal to five stations. This implies a utilization of 100% for all stations with the exception of the start and end of the process when not all stations are utilized. Since every job at each station is processed parallel to each other job, we can assume that there is one machine with 23 stations processing simultaneously. Therefore, we could say that the machine cycle time is the same as the longest station cycle time. Further, it means that after each point in time where all 23 jobs are executed, one product is created. Since the times of the conveyor belt are negligible, we only look at cycle times of the two tables. This implies that we only have 18 stations to look at. So, the product cycle time is assumed to be the same as the longest station cycle time.
According to Hopp & Spearman (2008), the definition of station cycle time is: “The average cycle time at a
station is made up of the following components:
1. Move time
2. Queue time
3. Setup time
4. Process time
5. Wait-to-batch time
6. Wait-in-batch time
7. Wait-to-match time
In our case, we do not have any setup times at the stations. Moreover, batching times are not applicable since we only have single products. This means that only three components define the station cycle time. Move time is simply defined as the time a job spent being moved from the previous workstation. In our case, the move times for the six stations at the Machine X.1 are the same. The same counts for the move times of the Machine X.2. Queue time is defined as: “the time jobs spend waiting for processing at the station or to be moved to the next station. In our case, this means the second part of the definition. Lastly, the process time is simply the time a job is actually being worked on at the station. So, the machine cycle time, CycleTime(2), and thus product cycle time within our situation can be defined as:
“The maximum of the processing time at a station plus the corresponding move time of that station.”
In others words, the machine cycle time is defined by the station that is the bottleneck in the process. For all other stations, the queue time is the difference between the machine cycle time and their own processing time.
Conclusion
17 difference between the maximal process time and the process time of that station we do not investigate this part. Further in this research, we focus on the bottleneck stations that define the machine cycle time. Next, these bottleneck stations are investigated more deeply on how to reduce this machine cycle time.
2.2.2.
Cycle times of type 1
In this section, the average cycle time of Machine X overall, CycleTime(1), is determined and analyzed. Therefore, the third sub question is answered:
What are the cycle times of Machine X?
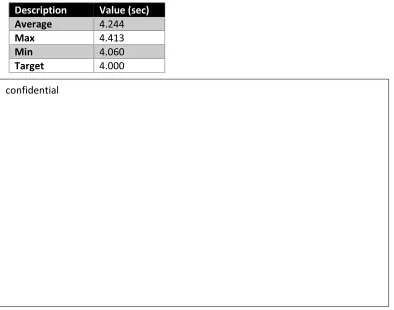
For analyzing the average cycle time, an analysis is executed on the cycle times in the period of slightly more than one year (September-2017 till October-2018) obtained by using a database within Company X. In Figure 2.13, the cycle times are shown in a graph over this period and in Table 2-1, the average, standard deviation, minimum and maximum is shown. The first thing to notice from the graph is that is fluctuating a lot over the period of time. For example, when comparing the minimal and maximal cycle time in terms of products, it equals a difference of approximately 620,000 Product A a year. Moreover, the cycle time has never reached the target time of 4.00 seconds. When comparing this target to the average cycle time again in terms of products, this equals approximately 452,000 pieces a year. Besides the fluctuating behavior of the cycle time, indicating a trend of the cycle time is rather difficult. However, when looking from week 12 till 36, which is also the most recent period, a clear upwards trend can be identified which underlines the importance of reducing the cycle times even more. This upwards trend is probably caused by the low attention paid to cycle times of the operator. So, the total number of Product A produced per year using the total production time realized in the same period is almost 4.9 million.
Table 2-1. Statistics of cycle time Machine X (Company X, 2018).
Description Value (sec)
Average 4.244
Max 4.413
Min 4.060
[image:38.612.62.456.413.723.2]Target 4.000
Figure 2.13. Cycle time(1) Machine X (Sep-2017 till Oct-2018) (Company X, 2018). 4,0000
4,1000 4,2000 4,3000 4,4000 4,5000
363840424446485052 2 4 6 8 10121416182022242628303234363840
Cycle
time
(s
ec)
Week number
CycleTime(1)
18
2.2.3.
Other KPIs
Besides the cycle times of the pressing process, some other aspects are important for Company X. In this section, these Key Performance Indicators are explained and analyzed. The fourth sub research question is answered:
What other KPIs are important for Company X?
The most important KPI for Company X regarding the production process is the Overall Equipment Effectiveness (OEE). The OEE is a quantitative metric which is derived from the Total Productive Maintenance concept (Muchiri & Pintelon, 2008). It identifies and measures losses of important aspects of manufacturing regarding to availability, performance and quality rate (Muchiri & Pintelon, 2008). Regarding the theory, the OEE is computed as:
𝑂𝐸𝐸 = 𝐴𝑣𝑎𝑖𝑙𝑎𝑏𝑖𝑙𝑖𝑡𝑦 ∗ 𝑃𝑒𝑟𝑓𝑜𝑟𝑚𝑎𝑛𝑐𝑒 ∗ 𝑄𝑢𝑎𝑙𝑖𝑡𝑦 (𝑒2. 𝑐)
Where Availability is the production time realized divided by the planned production time. Performance is the cycle time target multiplied by the number of products made which is divided by the realized production time. Last, Quality is simply the number of ‘good’ products divided by the number of products in total. When substituting this into the formula above, you get the following formula:
𝑂𝐸𝐸(1) =#𝐺𝑜𝑜𝑑𝑃𝑟𝑜𝑑𝑢𝑐𝑡𝑠𝑀𝑎𝑑𝑒 ∗ 𝐶𝑦𝑐𝑙𝑒𝑇𝑖𝑚𝑒𝑇𝑎𝑟𝑔𝑒𝑡
𝑃𝑟𝑜𝑑𝑢𝑐𝑡𝑖𝑜𝑛𝑇𝑖𝑚𝑒𝑃𝑙𝑎𝑛𝑛𝑒𝑑 (𝑒2. 𝑑)
Within Company X, the OEE is measured differently, since most of the time the quality of the Product A is checked a few days later at the packing line. So, the computation for the OEE over a certain period of time is done as follows:
𝑂𝐸𝐸(2) =#𝑃𝑟𝑜𝑑𝑢𝑐𝑡𝑠𝑀𝑎𝑑𝑒 ∗ 𝐶𝑦𝑐𝑙𝑒𝑇𝑖𝑚𝑒𝑇𝑎𝑟𝑔𝑒𝑡
𝑃𝑟𝑜𝑑𝑢𝑐𝑡𝑖𝑜𝑛𝑇𝑖𝑚𝑒𝑃𝑙𝑎𝑛𝑛𝑒𝑑 𝑒2. 𝑒)
19 Figure 2.14. OEE(2) Machine X (Sep-2017 till Oct-2017) (Company X, 2018).
Obviously, an OEE of 100% or even more is desired, but in practice not realistic. As can be seen in Figure 2.14, the OEE does not reach the 100% or even 90%. So, there are losses on OEE that can be identified. These losses are divided in two categories within Company X. The first category is OEE loss due to downtime, where downtime means all short stops, changeovers and breakdowns or simply said when the machine is not in use. This OEE loss due to downtime is based on the number of products that Company X could have made in the production time planned if the cycle time is equal to the target cycle time minus the number of products that you could have made in the realized production time with again the cycle time target. When putting this in a formula, it is as follows:
𝑂𝐸𝐸(2)𝑙𝑜𝑠𝑠 𝑑𝑢𝑒 𝑡𝑜 𝑑𝑜𝑤𝑛𝑡𝑖𝑚𝑒 = 𝑃𝑙𝑎𝑛𝑛𝑒𝑑𝑃𝑟𝑜𝑑𝑢𝑐𝑡𝑖𝑜𝑛 (𝑠𝑒𝑐𝑜𝑛𝑑𝑠) 𝐶𝑦𝑐𝑙𝑒𝑇𝑖𝑚𝑒𝑇𝑎𝑟𝑔𝑒𝑡 −
𝑅𝑒𝑎𝑙𝑖𝑧𝑒𝑑𝑃𝑟𝑜𝑑𝑢𝑐𝑡𝑖𝑜𝑛 (𝑠𝑒𝑐𝑜𝑛𝑑𝑠)
𝐶𝑦𝑐𝑙𝑒𝑇𝑖𝑚𝑒𝑇𝑎𝑟𝑔𝑒𝑡 (𝑒2. 𝑓)
The OEE losses due to downtime are graphically displayed in Figure 2.15. A correlation between the OEE overall and the losses due to downtime is clear, since the negative peak in week 49 from Figure 2.14 corresponds with the negative upwards peak in week 49 in Figure 2.15.
50% 60% 70% 80% 90% 100%
36 38 40 42 44 46 48 50 52 2 4 6 8 10 12 14 16 18 20 22 24 26 28 30 32 34 36 38 40
OE
E
Week number
OEE(2)
20 Figure 2.15. OEE(2) loss on downtime Machine X (Sep-2017 till Oct-2018) (Company X, 2018).
The second category of OEE losses are the losses due to cycle time. These cycle time losses are expressed in terms of products that you lost due to cycle times that are too high. It is based on the products that you could have made within the hours that the machine is in production if the cycle time is equal to the target and the products that really are produced. So, it is also dependent on the target cycle time and calculated as follows:
𝑂𝐸𝐸(2) 𝑙𝑜𝑠𝑠 𝑑𝑢𝑒 𝑡𝑜 𝑐𝑦𝑐𝑙𝑒 𝑡𝑖𝑚𝑒 = 𝑅𝑒𝑎𝑙𝑖𝑧𝑒𝑑𝑃𝑟𝑜𝑑𝑢𝑐𝑡𝑖𝑜𝑛𝐻𝑜𝑢𝑟𝑠 ∗ 3600
𝐶𝑦𝑐𝑙𝑒𝑇𝑖𝑚𝑒𝑇𝑎𝑟𝑔𝑒𝑡 − #𝑃𝑟𝑜𝑑𝑢𝑐𝑡𝑠𝑀𝑎𝑑𝑒 (𝑒2. 𝑔)
In Figure 2.16, the OEE losses due to cycle time are graphically shown. Obviously, there is a clear correlation between loss due cycle time and increase in cycle time. The week numbers of the peaks both up and downwards of Figure 2.16 correspond with the cycle time progress in Figure 2.13.
Figure 2.16. OEE(2) loss due cycle time Machine X (Sep-2017 till Oct-2018) (Company X, 2018). 0 10000 20000 30000 40000 50000 60000
363840424446485052 2 4 6 8 10121416182022242628303234363840
N u m b er o f wh ee ls los t Week number
Loss on failure
0 2000 4000 6000 8000 10000 12000
363840424446485052 2 4 6 8 10121416182022242628303234363840
N u m b er o f wh ee ls los t Week number
Loss due cycle time
confidential [image:41.612.71.446.479.712.2]21
2.3.
Factor analysis of CycleTime(2)
In this section, the factors that have impact on the cycle times of the pressing process are investigated. Further, the factors that have the largest negative influence are identified to be defined as bottlenecks within the process. Also, a short stop analysis is executed since these short stops are not allowed to increase with the same degree as the cycle time decreases. The fifth, sixth and seventh research question are discussed within this section:
Which factors could influence the cycle time, CycleTime(2), at Machine X?
Which of these factors are the bottlenecks within this process?
How are the short stops distributed within the stations at the press?
The cycle times can be influenced by a lot of factors. Each station at the pressing process can influence this cycle time. First, the components that construct the station cycle times are identified. Next an analysis on these station cycle times is performed. With these data the bottlenecks within the total CycleTime(2) can be identified. Lastly, we execute a small analysis on the short stops which have an influence on the final OEE.
2.3.1.
Stations
As mentioned in section 2.2.1, CycleTime(2) is the “slowest” station cycle time of one of the tables and the rotation time of the corresponding table. So, all machine settings that can be adjusted in order to change the cycle time are factors that could influence this cycle time. Further, the rotation speed of both tables could be adjusted. Each station has their own settings and therefore their own changes. Below, per station an explanation is given plus the settings that can be adjusted. First, the stations at the Machine X.1s are described.
1. SubStation1.1ing station. As mentioned, at this station the mold is SubStation1.1ed for making the mold rougher. However, this action, which is also the only one at this station, is not done at every mold but only when needed. So, this station can be considered as fixed.
2. SubStation2.1 station. At this station, several steps are performed before the SubStation2.1 is divided amongst the mold. First, the SubStation2.1 is divided on the station. Then the reservoir is moved to the mold where the SubStation2.1 is divided equally on the mold by going downwards after the reservoir moves back for getting new SubStation2.1 by going upwards. So, both the up- and downwards and for- and backwards movements are adaptable.
3. SubStation3.1 station. At this station, the SubStation3.1 option is only used when necessary and therefore not a constant process. So, this station is also to be considered as fixed.
4. SubStation4.1 station. At this station, the labels are picked up from a pile and put on the conveyor belt where the labels are transferred to the end of the belt where a robot arm places them on the mold. Since it is done sequentially, only the slowest step has an impact on the eventual final cycle time.
22 6. Pick-and-place station. This station consists of two parts. The first process is to push the mold upwards to be ready for the second process which is the transfer from the pancake to the Machine X.2. Both processes have a certain processing time which are adjustable.
Secondly, the stations at the Machine X.2 are explained. Also, the settings corresponding to this Machine X.2 are described. Since the waiting stations do not have any processing time, they are left out of the analysis at all.
1. SubStation1.2. At this station, the ring is inserted in the middle of the mold. For this station, the same holds as for the SubStation4.1 station. The rings are on a conveyor belt in sequential line. So, it is only delayed when a ring is not placed or place wrong on the belt.
2. SubStation2.2. At this station, again the same procedure as for the SubStation4.1 station holds. 3. SubStation3.2 station. Also, at this station the same procedure as for the SubStation4.1 station
holds.
4. Press station. At this station, the same steps as mentioned for the pancake plunger are executed. So, also five parts that determine the station cycle time.
5. Pick-and-place station. At this station, the final “green” wheel is picked up and placed on the measuring line. The same steps as for the pick-and-place station are executed. So, also the same adaptable settings.
2.3.2.
Station cycle times and bottlenecks
In this section, the cycle times per station are given. Later on in chapter 4, we discuss this more thoroughly. Furthermore, the rotation time of both tables is mentioned in the tables of the total time. The data is based on a period of one week. Since the data is constantly kept updated, we can assume that gives us enough significant data. The fixed stations as the SubStation1.1 station, SubStation3.1 station and waiting stations are left out of this analysis, because they assumed to be of no influence on the cycle time. The cycle times per station are given in Table 2-2 and Table 2-3.
Table 2-2. Machine X.2 station cycle times (Company X, 2018).
Station Average (sec) Standard Deviation (sec)
SubStation1.2 2.7071 0.0207
SubStation2.2 2.0461 0.0244
SubStation3.2 station 2.2126 0.0187
Press station 3.3042 0.0148
Pick-and-place station 2.4265 0.0207
Rotation time 1.0135 0.0071
Table 2-3. Machine X.1 station cycle times (Company X, 2018).
Station Average (sec) Standard deviation (sec)
SubStation2.1 station 2.9655 0.0340
SubStation4.1 station 2.5705 0.0249
Press station 2.1193 0.0260
Pick-and-place station 2.0892 0.0229