1
The Grid: past, present, future
Fran Berman,
1Geoffrey Fox,
2and Tony Hey
3,41San Diego Supercomputer Center, and Department of Computer Science and
Engineering, University of California, San Diego, California,2Indiana University,
Bloomington, Indiana,3EPSRC, Swindon, United Kingdom,4University of Southampton,
Southampton, United Kingdom
1.1 THE GRID
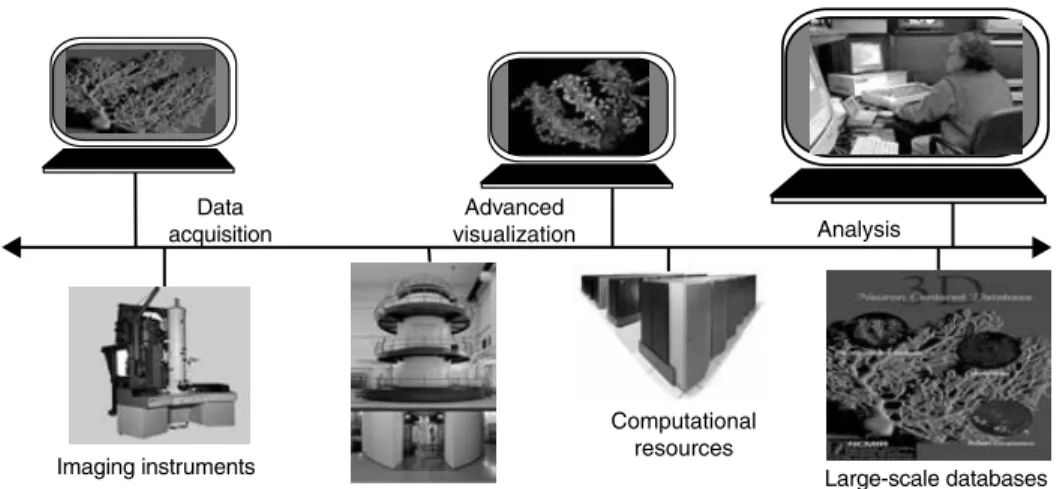
The Grid is the computing and data management infrastructure that will provide the elec-tronic underpinning for a global society in business, government, research, science and entertainment [1–5]. Grids, illustrated in Figure 1.1, integrate networking, communica-tion, computation and information to provide a virtual platform for computation and data management in the same way that the Internet integrates resources to form a virtual plat-form for inplat-formation. The Grid is transplat-forming science, business, health and society. In this book we consider the Grid in depth, describing its immense promise, potential and complexity from the perspective of the community of individuals working hard to make the Grid vision a reality.
Grid infrastructure will provide us with the ability to dynamically link together resources as an ensemble to support the execution of large-scale, resource-intensive, and distributed applications.
Imaging instruments
Computational resources
Large-scale databases Data
acquisition Analysis
Advanced visualization
Figure 1.1 Grid resources linked together for neuroscientist Mark Ellisman’s Telescience appli-cation (http://www.npaci.edu/Alpha/telescience.html).
Large-scale Grids are intrinsically distributed, heterogeneous and dynamic. They pro-mise effectively infinite cycles and storage, as well as access to instruments, visualization devices and so on without regard to geographic location. Figure 1.2 shows a typical early successful application with information pipelined through distributed systems [6]. The reality is that to achieve this promise, complex systems of software and services must be developed, which allow access in a user-friendly way, which allow resources to be used together efficiently, and which enforce policies that allow communities of users to coordinate resources in a stable, performance-promoting fashion. Whether users access the Grid to use one resource (a single computer, data archive, etc.), or to use several resources in aggregate as a coordinated ‘virtual computer’, the Grid permits users to interface with the resources in a uniform way, providing a comprehensive and powerful platform for global computing and data management.
Box 1.1 Summary of Chapter 1
This chapter is designed to give a high-level motivation for the book. In Section 1.2, we highlight some historical and motivational building blocks of the Grid – described in more detail in Chapter 3. Section 1.3 describes the current community view of the Grid with its basic architecture. Section 1.4 contains four building blocks of the Grid. In particular, in Section 1.4.1 we review the evolution of the network-ing infrastructure includnetwork-ing both the desktop and cross-continental links, which are expected to reach gigabit and terabit performance, respectively, over the next five years. Section 1.4.2 presents the corresponding computing backdrop with 1 to 40 teraflop performance today moving to petascale systems by the end of the decade. The U.S. National Science Foundation (NSF) TeraGrid project illustrates the state-of-the-art of current Grid technology. Section 1.4.3 summarizes many of the regional, national and international activities designing and deploying Grids. Standards, covered in Section 1.4.4 are a different but equally critical building block of the Grid. Section 1.5 covers the critical area of applications on the Grid covering life sciences, engineering and the physical sciences. We highlight new approaches to science including the importance of collaboration and the e-Science [7] concept driven partly by increased data. A short section on commercial applications includes the e-Enterprise/Utility [10] concept of computing power on demand. Applications are summarized in Section 1.5.7, which discusses the characteristic features of ‘good Grid’ applications like those illustrated in Figures 1.1 and 1.2. These show instru-ments linked to computing, data archiving and visualization facilities in a local Grid. Part D and Chapter 35 of the book describe these applications in more detail. Futures are covered in Section 1.6 with the intriguing concept of autonomic computing devel-oped originally by IBM [10] covered in Section 1.6.1 and Chapter 13. Section 1.6.2 is a brief discussion of Grid programming covered in depth in Chapter 20 and Part C of the book. There are concluding remarks in Sections 1.6.3 to 1.6.5.
General references can be found in [1–3] and of course the chapters of this book [4] and its associated Web site [5]. The reader’s guide to the book is given in the preceding preface. Further, Chapters 20 and 35 are guides to Parts C and D of the book while the later insert in this chapter (Box 1.2) has comments on Parts A and B of this book. Parts of this overview are based on presentations by Berman [11] and Hey, conferences [2, 12] and a collection of presentations from the Indiana University on networking [13–15].
Tomographic reconstruction Real-time
collection
Wide-area dissemination
Desktop & VR clients with shared controls Advanced photon source
Archival storage
http://epics.aps.anl.gov/welcome.html
Figure 1.2 Computational environment for analyzing real-time data taken at Argonne’s advanced photon source was an early example of a data-intensive Grid application [6]. The picture shows data source at APS, network, computation, data archiving, and visualization. This figure was derived from work reported in “Real-Time Analysis, Visualization, and Steering of Microtomography Exper-iments at Photon Sources”, Gregor von Laszewski, Mei-Hui Su, Joseph A. Insley, Ian Foster, John Bresnahan, Carl Kesselman, Marcus Thiebaux, Mark L. Rivers, Steve Wang, Brian Tieman, Ian McNulty, Ninth SIAM Conference on Parallel Processing for Scientific Computing, Apr. 1999.
1.2 BEGINNINGS OF THE GRID
It is instructive to start by understanding the influences that came together to ultimately influence the development of the Grid. Perhaps the best place to start is in the 1980s, a decade of intense research, development and deployment of hardware, software and appli-cations for parallel computers. Parallel computing in the 1980s focused researchers’ efforts on the development of algorithms, programs and architectures that supported simultaneity. As application developers began to develop large-scale codes that pushed against the resource limits of even the fastest parallel computers, some groups began looking at dis-tribution beyond the boundaries of the machine as a way of achieving results for problems of larger and larger size.
running in parallel on a low-latency parallel machine – and for linking disparate resources (storage, computation, visualization, instruments). The fundamental Grid task of manag-ing these heterogeneous components as we scale the size of distributed systems replaces that of the tight synchronization of the typically identical [in program but not data as in the SPMD (single program multiple data) model] parts of a domain-decomposed parallel application.
During the 1980s, researchers from multiple disciplines also began to come together to attack ‘Grand Challenge’ problems [17], that is, key problems in science and engineering for which large-scale computational infrastructure provided a fundamental tool to achieve new scientific discoveries. The Grand Challenge and multidisciplinary problem teams provided a model for collaboration that has had a tremendous impact on the way large-scale science is conducted to date. Today, interdisciplinary research has not only provided a model for collaboration but has also inspired whole disciplines (e.g. bioinformatics) that integrate formerly disparate areas of science.
The problems inherent in conducting multidisciplinary and often geographically dis-persed collaborations provided researchers experience both with coordination and dis-tribution – two fundamental concepts in Grid Computing. In the 1990s, the US Gigabit testbed program [18] included a focus on distributed metropolitan-area and wide-area applications. Each of the test beds – Aurora, Blanca, Casa, Nectar and Vistanet – was designed with dual goals: to investigate potential testbed network architectures and to explore their usefulness to end users. In this second goal, each testbed provided a venue for experimenting with distributed applications.
The first modern Grid is generally considered to be the information wide-area year (I-WAY), developed as an experimental demonstration project for SC95. In 1995, during the week-long Supercomputing conference, pioneering researchers came together to aggregate a national distributed testbed with over 17 sites networked together by the vBNS. Over 60 applications were developed for the conference and deployed on the I-WAY, as well as a rudimentary Grid software infrastructure (Chapter 4) to provide access, enforce security, coordinate resources and other activities. Developing infrastructure and applications for the I-WAY provided a seminal and powerful experience for the first generation of modern Grid researchers and projects. This was important as the development of Grid research requires a very different focus than distributed computing research. Whereas distributed computing research generally focuses on addressing the problems of geographical sepa-ration, Grid research focuses on addressing the problems of integration and management of software.
client-server model. These, and many other projects, provided a foundation for today’s Grid software and ideas.
In the late 1990s, Grid researchers came together in the Grid Forum, subsequently expanding to the Global Grid Forum (GGF) [2], where much of the early research is now evolving into the standards base for future Grids. Recently, the GGF has been instrumental in the development of the Open Grid Services Architecture (OGSA), which integrates Globus and Web services approaches (Chapters 7, 8, and 9). OGSA is being developed by both the United States and European initiatives aiming to define core services for a wide variety of areas including:
• Systems Management and Automation
• Workload/Performance Management
• Security
• Availability/Service Management
• Logical Resource Management
• Clustering Services
• Connectivity Management
• Physical Resource Management.
Today, the Grid has gone global, with many worldwide collaborations between the United States, European and Asia-Pacific researchers. Funding agencies, commercial ven-dors, academic researchers, and national centers and laboratories have come together to form a community of broad expertise with enormous commitment to building the Grid. Moreover, research in the related areas of networking, digital libraries, peer-to-peer com-puting, collaboratories and so on are providing additional ideas relevant to the Grid.
Although we tend to think of the Grid as a result of the influences of the last 20 years, some of the earliest roots of the Grid can be traced back to J.C.R. Licklider, many years before this. ‘Lick’ was one of the early computing and networking pioneers, who set the scene for the creation of the ARPANET, the precursor to today’s Internet. Originally an experimental psychologist at MIT working on psychoacoustics, he was concerned with the amount of data he had to work with and the amount of time he required to organize and analyze his data. He developed a vision of networked computer systems that would be able to provide fast, automated support systems for human decision making [30]:
‘If such a network as I envisage nebulously could be brought into operation, we could have at least four large computers, perhaps six or eight small computers, and a great assortment of disc files and magnetic tape units – not to mention remote consoles and teletype stations – all churning away’
In the next sections, we provide an overview of the present Grid Computing and its emerging vision for the future.
1.3 A COMMUNITY GRID MODEL
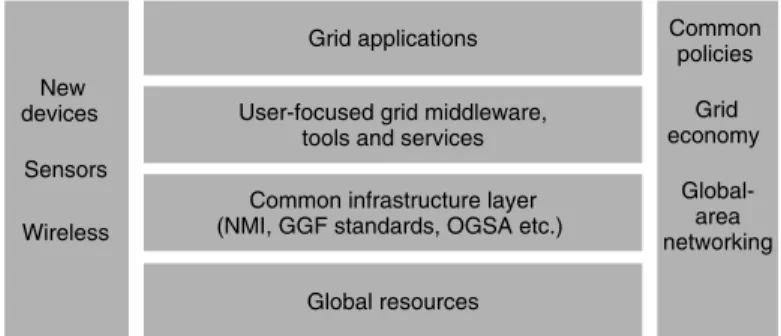
Over the last decade, the Grid community has begun to converge on a layered model that allows development of the complex system of services and software required to integrate Grid resources. This model, explored in detail in Part B of this book, provides a layered abstraction of the Grid. Figure 1.3 illustrates theCommunity Grid Model being developed in a loosely coordinated manner throughout academia and the commercial sector. We begin discussion by understanding each of the layers in the model.
The bottom horizontal layer of the Community Grid Model consists of the hard-wareresourcesthat underlie the Grid. Such resources include computers, networks, data archives, instruments, visualization devices and so on. They are distributed, heteroge-neous and have very different performance profiles (contrast performance as measured in FLOPS or memory bandwidth with performance as measured in bytes and data access time). Moreover, the resource pool represented by this layer is highly dynamic, both as a result of new resources being added to the mix and old resources being retired, and as a result of varying observable performance of the resources in the shared, multiuser environment of the Grid.
The next horizontal layer (common infrastructure) consists of the software services and systems which virtualize the Grid. Community efforts such as NSF’s Middleware Initiative (NMI) [31], OGSA (Chapters 7 and 8), as well as emerging de facto standards such as Globus provide a commonly agreed upon layer in which the Grid’s heterogeneous and dynamic resource pool can be accessed. The key concept at the common infrastructure layer is community agreement on software, which will represent the Grid as a unified virtual platform and provide the target for more focused software and applications.
The next horizontal layer (user and application-focused Grid middleware, tools and services) contains software packages built atop the common infrastructure. This software serves to enable applications to more productively use Grid resources by masking some of the complexity involved in system activities such as authentication, file transfer, and
Common infrastructure layer (NMI, GGF standards, OGSA etc.)
Global resources User-focused grid middleware,
tools and services
Grid applications Common
policies
Grid economy
Global-area networking New
devices
Sensors
Wireless
so on. Portals, community codes, application scheduling software and so on reside in this layer and provide middleware that connects applications and users with the common Grid infrastructure.
The topmost horizontal layer (Grid applications) represents applications and users. The Grid will ultimately be only as successful as its user community and all of the other horizontal layers must ensure that the Grid presents a robust, stable, usable and useful computational and data management platform to the user. Note that in the broadest sense, even applications that use only a single resource on the Grid are Grid applications if they access the target resource through the uniform interfaces provided by the Grid infrastructure.
The vertical layers represent the next steps for the development of the Grid. The verti-cal layer on the left represents theinfluence of new devices– sensors, PDAs, and wireless. Over the next 10 years, these and other new devices will need to be integrated with the Grid and will exacerbate the challenges of managing heterogeneity and promoting per-formance. At the same time, the increasing globalization of the Grid will require serious consideration ofpolicies for sharingand using resources, global-area networking and the development of Grid economies (the vertical layer on the right – see Chapter 32). As we link together national Grids to form a Global Grid, it will be increasingly important to develop Grid social and economic policies which ensure the stability of the system, promote the performance of the users and successfully integrate disparate political, tech-nological and application cultures.
The Community Grid Model provides an abstraction of the large-scale and intense efforts of a community of Grid professionals, academics and industrial partners to build the Grid. In the next section, we consider the lowest horizontal layers (individual resources and common infrastructure) of the Community Grid Model.
1.4 BUILDING BLOCKS OF THE GRID
1.4.1 Networks
The heart of any Grid is its network – networks link together geographically distributed resources and allow them to be used collectively to support execution of a single appli-cation. If the networks provide ‘big pipes’, successful applications can use distributed resources in a more integrated and data-intensive fashion; if the networks provide ‘small pipes’, successful applications are likely to exhibit minimal communication and data transfer between program components and/or be able to tolerate high latency.
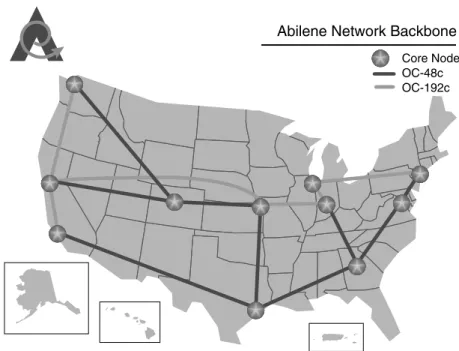
At present, Grids build on ubiquitous high-performance networks [13, 14] typified by the Internet2 Abilene network [15] in the United States shown in Figures 1.4 and 1.5. In 2002, such national networks exhibit roughly 10 Gb s−1 backbone performance.
Abilene Core Node Abilene Connector Exc hang e P oint Abilene P a rticipant P eer Netw ork Multihomed Connector or P a rticipant
OC-3c OC-12c OC-48c
OC-192c
GigE
10GigE
IEEAF OC-12c IEEAF OC-192c
Sunn
yv
ale Los Angeles
Seattle
Den
ve
r
Kansas City Houston
Atlanta Indianapolis Ne w Y o rk W ashington Chicago SDSC
UC San Diego UC Ir
vine
Caltech
Jet Propulsion Lab
USC
UC Riv
erside
UC Los Angeles UC Santa Barbar
a
San Diego State Cal P
oly P omona Cal State-San Ber nardino Ne vada-Reno Deser
t Research Inst
UNL V UNINET CUDI CALREN-2 D ARP A SuperNet Ar iz ona St. U Ar iz ona
UC San F
rancisco
UC Office of the President UC Santa Cr
uz UC Da vis Cal State-Ha yw ard CALREN-2 UC Ber kele y Ha w aii
DREN NISN NREN
NGIX-AMES
Oregon Health &
Science U
P
o
rtland State*
BYU
Oregon State OREGON*
Stanf ord ESnet Singaren WIDE SINET GEMnet AARnet Alaska NO AA-PMEL Microsoft Research W ashingtonState P A CIFIC/ NOR THWEST DREN AP AN/T ransP A C CAnet 4 T ANet-2 P acific W a v e Montana State Montana Idaho
US DeptCommerce
Color ado-Boulder Color ado-Den ve r W yoming NCAR Ar kansas Ar kansas -Little Roc k W ashington
CAnet 3 Singaren
RNP2 K OREN/KREONET2 GEMnet T ANet-2 N. Dak ota State South Dak ota DREN ESnet NISN NREN SURFNet MAN LAN SURFNet CAnet4 CERN vBNS NGIX NORDUnet ST AR TA P MREN Wisconsin -Madison Wisconsin -Milw auk ee Illinois-Chicago Argonne Chicago Nor thw ester n Illinois-Urbana Nor ther n Lights W
est Virginia Penn State
Car
negie Mellon Pittsb
urgh
IBM-TJ Watson
Cor nell Buff alo (SUNY) Binghamton (SUNY) Alban y (SUNY) Syr acuse Rochester Columbia NYU Ston
y Brook RIT
Michigan State Michigan W ayne State Michigan T ech W ester n Michigan UCAID MERIT* Souther n Illinois Notre Dame Iowa * Br adle y Motorola Labs WPI UCAID NorduNet ESnet Rensselaer Yale V e rmont Maine Ne w Hampshire Nor theaster n Dar tmouth
Boston U Har
vard
Tufts MIT
Connecticut
Rhode Island
EBSCO
U Mass Amherst
Br andeis Bro w n NYSERNet* CAnet3 HEAnet GEANT GTRN PSC D rexe l
Lehigh Penn
MA GPI O A Rnet Case W ester n Cincinnati Bo wling Green Akron K ent State
Ohio State Ohio U Wr
ight State Rutgers Adv anced Netw or k & Ser vices Dela w are NCNI Virginia T ech
George Mason Old Dominion William & Mar
y
VCU
Virginia
NWVng
NO
X MAX UCAID
Georgia Georgia T ech Georgia State Emor y K entuc ky Clemson
South Carolina Medical Univ
.
of S
. Carolina
Tennessee Alabama-Huntsville Alabama-Tuscaloosa
SO X V anderbilt NGIX Flor ida
vBNS NISN DREN
A M PAT H UMD George W ashington NSF Georgeto wn Ho w ard Hughes
Medical Ctr NIH/NLM
EOSDIS/GFSC
NO
AA
UMBC UMB Catholic Fujitsu Lab Gallaudet
Alabama
-Bir
mingham Aub
u rn REUNA RNP2 RETINA ANSP Flor ida Atlantic Miami Flor ida Inter national South Flor ida Flor ida A&M Louisiana State LAnet SFGP Puer to Rico
TEXAS Houston Rice
Ba
ylor College of Med Texas A&M
SF A ustin State NOR TH TEXAS Te xas T ech CUDI UT -El P aso NO A O /A URA UT -Ar lington UT -Dallas TCU Nor th T exas Southw
est ResearchInstitute
SMU
UT
-A
ustin
UT
-SW Med Ctr
. Qw est lab Oklahoma Oklahoma State Tulsa Toledo Memphis OneNet Ja
ckson State Souther Mississippi
n Mississippi Flor ida State Ne w Me xico Ne w Me xico State Purdue W
ashington Eli Lilly
Indiana
Color
ado State
F
ront Range
Idaho State Utah State
Utah Kansas Kansas State U Nebr aska-Lincoln Wichita State Ar kansas Med. Science Missour i-Rolla Missour i-Columbia Missour i-St. Louis Missour i-KC Great Plains WiscREN NCSA Io w a State* Louisville Tulane MississippiState ESnet ST ARLIGHT
SD Schoolof Mines
S
. Dak
ota State
ER
OS Data Center
Nor th Dak ota Minnesota W a ke F orest UNC-Chapel Hill Duk e NC State East Carolina Pr inceton
Children's Hospitalof Philadelphia
J&J HP Labs J&J J&J Cal P oly ,
San Luis Obispo
Centr al Flor ida P o rtland State* AP AN/T ransP A C
Abilene Network Backbone
Core Node OC-48c OC-192c
Figure 1.5 Backbone of Abilene Internet2 Network in USA.
NNW
Northern Ireland
MidMAN
TVN
EMMANM YHMAN
NorMAN
20 Gbps 10 Gbps 2.5 Gbps 622 Mbps 155 Mbps
EastNet
External links
LMN
Kentish MAN LeNSE
SuperJanet4, July2002
SWAN& BWEMAN South Wales
MAN
WorldCom Bristol
WorldCom Reading
WorldCom Manchester WorldCom
Glasgow
WorldCom Edinburgh
WorldCom Leeds
WorldCom London
WorldCom Portsmouth
Scotland via Edinburgh Scotland via
Glasgow
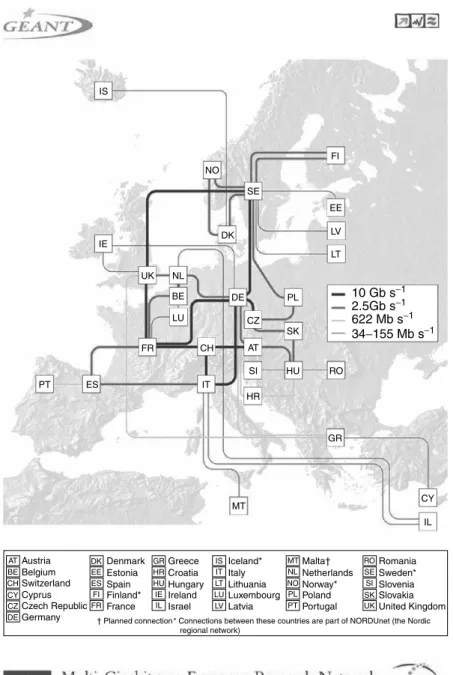
IS NO FI SE DK IE UK FR CH DE CZ AT SI HU SK PL RO HR MT GR CY IL
10 Gb s−1 2.5Gb s−1
622 Mb s−1
34−155 Mb s−1
ES PT IT NL BE LU EE LV LT Austria Belgium Switzerland Cyprus Czech Republic Germany Denmark Estonia Spain Finland* France Greece Croatia Hungary Ireland Israel Iceland* Italy Lithuania Luxembourg Latvia Malta† Netherlands Norway* Poland Portugal Romania Sweden* Slovenia Slovakia United Kingdom † Planned connection * Connections between these countries are part of NORDUnet (the Nordic
regional network) AT BE CH CY CZ DE DK EE ES FI FR GR HR HU IE IL IS IT LT LU LV MT NL NO PL PT RO SE SI SK UK
Figure 1.8 International Networks.
a 1 Gb s−1 institution-to-backbone link and by a 10 to 100 Mb s−1 desktop-to-institutional
network link.
Although there are exceptions, one can capture a typical leading Grid research envi-ronment as a 10 : 1 : 0.1 Gbs−1 ratio representingnational: organization: desktop links.
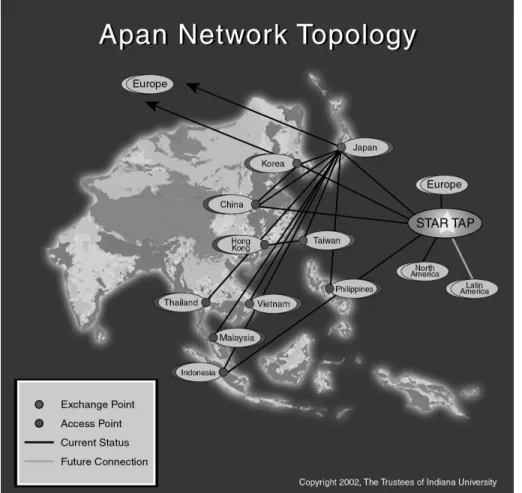
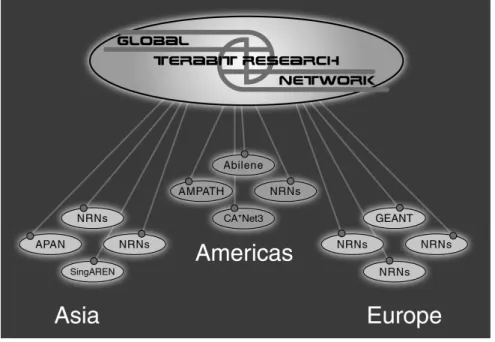
Today, new national networks are beginning to change this ratio. The GTRN or Global Terabit Research Network initiative shown in Figures 1.10 and 1.11 link national net-works in Asia, the Americas and Europe with a performance similar to that of their backbones [44]. By 2006, GTRN aims at a 1000 : 1000 : 100 : 10 : 1 gigabit performance ratio representinginternational backbone: national: organization: optical desktop: Copper desktoplinks. This implies a performance increase of over a factor of 2 per year in net-work performance, and clearly surpasses expected CPU performance and memory size increases of Moore’s law [8] (with a prediction of a factor of two in chip density improve-ment every 18 months). This continued difference between network and CPU performance growth will continue to enhance the capability of distributed systems and lessen the gap between Grids and geographically centralized approaches. We should note that although network bandwidth will improve, we do not expect latencies to improve significantly. Fur-ther, as seen in the telecommunications industry in 2000–2002, in many ways network performance is increasing ‘faster than demand’ even though organizational issues lead to problems. A critical area of future work is network quality of service and here progress is less clear. Networking performance can be taken into account at the application level as in AppLes and APST ([23] and Chapter 33), or by using the Network Weather Service [26] and NaradaBrokering (Chapter 22).
Figur
e
1.11
Physical
GTRN
Global
T
erabit
Research
High-capacity networking increases the capability of the Grid to support both paral-lel and distributed applications. In the future, wired networks will be further enhanced by continued improvement in wireless connectivity [45], which will drive integration of smaller and smaller devices into the Grid. The desktop connectivity described above will include the pervasive PDA (Personal Digital Assistant included in universal access dis-cussion of Chapter 18) that will further promote the Grid as a platform for e-Science, e-Commerce and e-Education (Chapter 43).
1.4.2 Computational ‘Nodes’ on the Grid
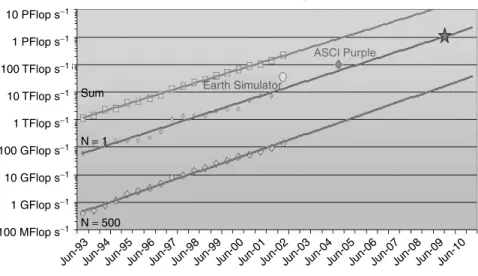
Networks connect resources on the Grid, the most prevalent of which are computers with their associated data storage. Although the computational resources can be of any level of power and capability, some of the most interesting Grids for scientists involve nodes that are themselves performance parallel machines or clusters. Such high-performance Grid ‘nodes’ provide major resources for simulation, analysis, data mining and other compute-intensive activities. The performance of the most high-performance nodes on the Grid is tracked by the Top500 site [46] (Figure 1.12). Extrapolations of this information indicate that we can expect a peak single machine performance of 1 petaflops/sec (1015 operations per second) by around 2010.
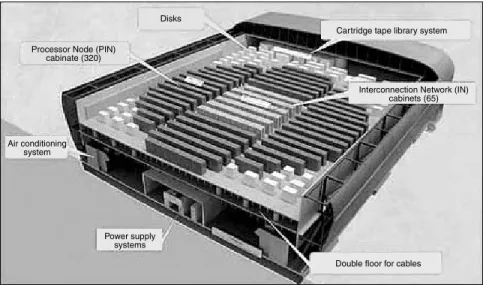
Contrast this prediction of power to the present situation for high-performance comput-ing. In March 2002, Japan’s announcement of the NEC Earth Simulator machine shown in Figure 1.13 [47], which reaches 40 teraflops s−1 with a good sustained to peak
per-formance rating, garnered worldwide interest. The NEC machine has 640 eight-processor nodes and offers 10 terabytes of memory and 700 terabytes of disk space. It has already been used for large-scale climate modeling. The race continues with Fujitsu announcing
ASCl Purple
Earth Simulator
Jun-93Jun-94Jun-95Jun-96Jun-97Jun-98Jun-99Jun-00Jun-01Jun-02Jun-03Jun-04Jun-05Jun-06Jun-07Jun-08Jun-09Jun-10
Performance extrapolation
100 MFlop s−1 1 GFlop s−1 10 GFlop s−1 100 GFlop s−1 1 TFlop s−1 10 TFlop s−1 Sum
N = 1
N = 500 100 TFlop s−1
1 PFlop s−1 10 PFlop s−1 TOP500
Processor Node (PIN) cabinate (320)
Disks
Air conditioning system
Power supply systems
Interconnection Network (IN) cabinets (65) Cartridge tape library system
Double floor for cables
Figure 1.13 Japanese Earth Simulator 40 Teraflop Supercomputer.
in August 2002, the HPC2500 with up to 16 384 processors and 85 teraflops s−1peak
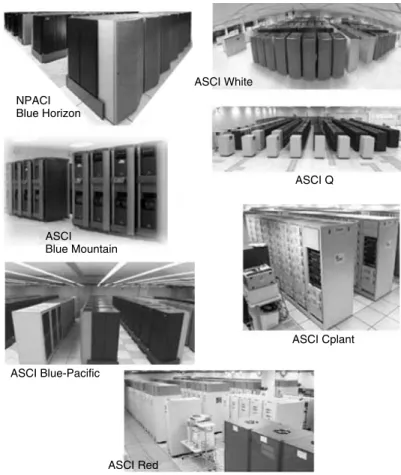
per-formance [48]. Until these heroic Japanese machines, DOE’s ASCI program [49], shown in Figure 1.14, had led the pack with the ASCI White machine at Livermore National Laboratory peaking at 12 teraflops s−1. Future ASCI machines will challenge for the Top
500 leadership position!
Such nodes will become part of future Grids. Similarly, large data archives will become of increasing importance. Since it is unlikely that it will be many years, if ever, before it becomes straightforward to move petabytes of data around global networks, data centers will install local high-performance computing systems for data mining and analysis. Com-plex software environments will be needed to smoothly integrate resources from PDAs (perhaps a source of sensor data) to terascale/petascale resources. This is an immense chal-lenge, and one that is being met by intense activity in the development of Grid software infrastructure today.
1.4.3 Pulling it all together
NPACI Blue Horizon
ASCI White
ASCI Q
ASCI Blue Mountain
ASCI Blue-Pacific
ASCI Cplant
ASCI Red
Figure 1.14 Constellation of ASCI Supercomputers.
are developing high-end, high-performance Grids with fast networks and powerful Grid nodes that will provide a foundation of experience for the Grids of the future. The Euro-pean UNICORE system ([62] and Chapter 29) is being developed as a Grid computing environment to allow seamless access to several large German supercomputers. In the United States, the ASCI program and TeraGrid project are using Globus to develop Grids linking multi-teraflop computers together [63]. There are many support projects associ-ated with all these activities including national and regional centers in the UK e-Science effort [64, 65], the European GRIDS activity [66] and the iVDGL (International Virtual Data Grid Laboratory) [67]. This latter project has identified a Grid Operation Center in analogy with the well-understood network operation center [68].
major software activities [62, 70–75]. Application Grid projects described in more detail in Section 1.5 include magnetic fusion [76], particle physics [68, 77, 78] (Chapter 39), astronomy [77, 79–81] (Chapter 38), earthquake engineering [82] and modeling [83], cli-mate [84], bioinformatics [85, 86] (Chapters 40 and 41) and, more generally, industrial applications [87]. We finally note two useful Web resources [88, 89] that list, respectively, acronyms and major projects in the Grid area.
One of the most significant and coherent Grid efforts in Europe is the UK e-Science Program [7] discussed in Section 1.1. This is built around a coherent set of applica-tion Grids linked to a UK naapplica-tional Grid. The new 7 Teraflop (peak) HPC(X) machine from IBM will be located at Daresbury Laboratory and be linked to the UK e-Science Grid [90, 91] shown in Figure 1.15. In addition to the HPC(X) machine, the UK Grid will provide connections to the HPC Computer Services for Academic Research (CSAR) service in Manchester and high-performance clusters only accessible to UK university researchers via Grid digital certificates provided by the UK Grid Certification Authority. This is located at Rutherford Laboratory along with the UK Grid Support Centre and the Engineering Task Force. The UK e-Science Grid is intended to provide a model for a genuine production Grid that can be used by both academics for their research and indus-try for evaluation. The accompanying set of application projects are developing Grids that will connect and overlap with national Grid testing interoperability and security issues for different virtual communities of scientists. A striking feature of the UK e-Science
Edinburgh
DL Newcastle
Glasgow
Belfast
Manchester
Oxford
Cardiff
Cambridge
Hinxton
London
Southampton RAL
initiative is the large-scale involvement of industry: over 50 companies are involved in the program, contributing over $30 M to supplement the $180 M funding provided by the UK Government.
The portfolio of the UK e-Science application projects is supported by the Core Pro-gram. This provides support for the application projects in the form of the Grid Support Centre and a supported set of Grid middleware. The initial starting point for the UK Grid was the software used by NASA for their IPG – Globus, Condor and SRB as described in Chapter 5. Each of the nodes in the UK e-Science Grid has $1.5 M budget for collabo-rative industrial Grid middleware projects. The requirements of the e-Science application projects in terms of computing resources, data resources, networking and remote use of facilities determine the services that will be required from the Grid middleware. The UK projects place more emphasis on data access and data federation (Chapters 14, 15 and 17) than traditional HPC applications, so the major focus of the UK Grid middleware efforts are concentrated in this area. Three of the UK e-Science centres – Edinburgh, Manchester and Newcastle – are working with the Globus team and with IBM US, IBM Hursley Laboratory in the United Kingdom, and Oracle UK in an exciting project on data access and integration (DAI). The project aims to deliver new data services within the Globus Open Grid Services framework.
Perhaps the most striking current example of a high-performance Grid is the new NSF TeraGrid shown in Figure 1.16, which links major subsystems at four different sites and will scale to the Pittsburgh Supercomputer Center and further sites in the next few years. The TeraGrid [52] is a high-performance Grid, which will connect the San Diego Supercomputer Center (SDSC), California Institute of Technology (Caltech), Argonne National Laboratory and the National Center for Supercomputing Applications (NCSA).
TeraGrid partners Alliance partners NPACI partners Abilene backbone Abilene participants Internationsl networks
Once built, the TeraGrid will link the four in a Grid that will comprise in aggregate over 0.6 petabyte of on-line disk, over 13 teraflops compute performance, and will be linked together by a 40 Gb s−1 network.
Each of the four TeraGrid sites specializes in different areas including visualization (Argonne), compute-intensive codes (NCSA), data-oriented computing (SDSC) and sci-entific collections (Caltech). An overview of the hardware configuration is shown in Figure 1.17. Each of the sites will deploy a cluster that provides users and application developers with an opportunity to experiment with distributed wide-area cluster computing as well as Grid computing. The Extensible Terascale Facility (ETF) adds the Pittsburgh Supercomputer Center to the original four TeraGrid sites. Beyond TeraGrid/ETF, it is the intention of NSF to scale to include additional sites and heterogeneous architectures as the foundation of a comprehensive ‘cyberinfrastructure’ for US Grid efforts [53]. With this as a goal, TeraGrid/ETF software and hardware is being designed to scale from the very beginning.
TeraGrid was designed to push the envelop on data capability, compute capability and network capability simultaneously, providing a platform for the community to experiment with data-intensive applications and more integrated compute-intensive applications. Key choices for the TeraGrid software environment include the identification of Linux as the operating system for each of the TeraGrid nodes, and the deployment of basic, core and advanced Globus and data services.
The goal is for the high-end Grid and cluster environment deployed on TeraGrid to resemble the low-end Grid and cluster environment used by scientists in their own laboratory settings. This will enable a more direct path between the development of test and prototype codes and the deployment of large-scale runs on high-end platforms.
32 32 5 32 32 5 32 24 8 32 24 8 4 4 4 4 2 14 8 24 16 10 Caltech 0.5 TF .4 TB memory
86 TB disk
NTONOC-48 Calren OC-12 ATM Juniper M160 vBNS Abilene Calren ESnet OC-12 OC-12 OC-12 OC-3 HPSS 300 TB 1176p IBM SP 1.7 TFLOPs Blue horizon
2 x Sun E10K
Extreme
blk diamond ANL
1 TF .25 TB memory
25 TB disk 256p HP X-Class
128p HP V2500
92p IA-32
HPSS
Chicago & LA DTF core switch/routers
Cisco 65xx catalyst switch (256 Gbs−1 crossbar)
Sun server 15xxp origin 1024p IA-32 320p IA-64 UniTree OC-12 OC-12 OC-12 OC-48 OC-3 OC-12 vBNS Abilene MREN GbE ESnet HSCC MREN/Abilene Starlight HPSS HR display & VR facilities 128p origin 574p IA-32 Chiba City Myrinet SDSC 4.1 TF 2 TB memory
225 TB SAN
NCSA
6+2 TF
4 TB memory 240 TB disk
Myrinet
TeraGrid is being developed as a production Grid (analogous to the role that produc-tion supercomputers have played over the last two decades as the target of large-scale codes developed on laboratory workstations) and will involve considerable software and human infrastructure to provide access and support for users including portals, schedulers, operations, training, a distributed help-desk, and so on.
1.4.4 Common infrastructure: standards
For the foreseeable future, technology will continue to provide greater and greater poten-tial capability and capacity and will need to be integrated within Grid technologies. To manage this ever-changing technological landscape, Grids utilize a common infrastruc-ture to provide a virtual representation to software developers and users, while allowing the incorporation of new technologies. The development of key standards that allow the complexity of the Grid to be managed by software developers and users without heroic efforts is critical to the success of the Grid.
Both the Internet and the IETF [92], and the Web and the W3C consortium [93] have defined key standards such as TCP/IP, HTTP, SOAP, XML and now WSDL – the Web services definition language that underlines OGSA. Such standards have been crit-ical for progress in these communities. The GGF [2] is now building key Grid-specific standards such as OGSA, the emergingde facto standard for Grid infrastructure. In addi-tion, NMI [31] and the UK’s Grid Core Program [7] are seeking to extend, standardize and make more robust key pieces of software for the Grid arsenal such as Globus [3] (Chapter 6), Condor [22] (Chapter 11), OGSA-DAI (Chapters 7 and 15) and the Network Weather Service [26]. In the last two decades, the development [16] of PVM [94] and MPI [95], which pre-dated the modern Grid vision, introduced parallel and distributed computing concepts to an entire community and provided the seeds for the community collaboration, which characterizes the Grid community today.
There are other important standards on which the Grid is being built. The last subsection stressed the key role of Linux as the standard for node operating systems [96]. Further within the commercial Web community, OASIS [97] is standardizing Web Services for Remote Portals (WSRP) – the portlet interface standard to define user-facing ports on Web services (Chapter 18). These standards support both commercial and noncommercial software and there is a growing trend in both arenas for open-source software. The Apache project [98] supplies key infrastructure such as servers [99] and tools to support such areas as WSDL-Java interfaces [100] and portals [101]. One expects these days that all software is either open source or provides open interfaces to proprietary implementations. Of course, the broad availability of modern languages like Java with good run-time and development environments has also greatly expedited the development of Grid and other software infrastructure.
1.5 GRID APPLICATIONS AND APPLICATION
MIDDLEWARE
The Grid will serve as an enabling technology for a broad set of applications in science, business, entertainment, health and other areas. However, the community faces a ‘chicken and egg’ problem common to the development of new technologies: applications are needed to drive the research and development of the new technologies, but applications are difficult to develop in the absence of stable and mature technologies. In the Grid community, Grid infrastructure efforts, application development efforts and middleware efforts have progressed together, often through the collaborations of multidisciplinary teams. In this section, we discuss some of the successful Grid application and application middleware efforts to date. As we continue to develop the software infrastructure that better realizes the potential of the Grid, and as common Grid infrastructure continues to evolve to provide a stable platform, the application and user community for the Grid will continue to expand.
1.5.1 Life science applications
One of the fastest-growing application areas in Grid Computing is the Life Sciences. Computational biology, bioinformatics, genomics, computational neuroscience and other areas are embracing Grid technology as a way to access, collect and mine data [e.g. the Protein Data Bank [102], the myGrid Project [103], the Biomedical Information Research Network (BIRN) [85]], accomplish large-scale simulation and analysis (e.g. MCell [104]), and to connect to remote instruments (e.g. in Telemicroscopy [105] and Chapter 33 [106]). The Biomedical Informatics Research Network links instruments and federated databases, illustrated in Figure 1.18. BIRN is a pioneering project that utilizes infrastructure to support cross-correlation studies of imaging and other data critical for neuroscience and biomedical advances.
The MCell collaboration between computational biologists and computer scientists to deploy large-scale Monte Carlo simulations using Grid technologies is a good example of a successful Grid-enabled life science application. Over the last decade, biologists have developed a community code calledMCell, which is a general simulator for cellular microphysiology (the study of the physiological phenomena occurring at the microscopic level in living cells). MCell uses Monte Carlo diffusion and chemical reaction algorithms in 3D to simulate complex biochemical interactions of molecules inside and outside cells. MCell is one of the many scientific tools developed to assist in the quest to understand the form and function of cells, with specific focus on the nervous system. A local-area distributed MCell code is installed in laboratories around the world and is currently being used for several practical applications (e.g. the study of calcium dynamics in hepatocytes of the liver).
Large scale on-line data archive
High performance
computing
TeraGrid
Data acquisition
Local database
Local database
Local database Federated database layer
The Biomedical Informatics Research Network
UCLA Wash
UCSD
Mark Ellisman, et al. EM
MRI
PET
Codes for
– “blending/bending”
– Visualization
U
Figure 1.18 Biomedical Informatics Research Network – one of the most exciting new applica-tion models for the Grid.
(a) (b)
Figure 1.19 MCELL depiction of simulation of traversal of ligands in a cell (a) and program structure (b). On the right, we show linkage of shared input files, Monte Carlo “ experiments” and shared output files.
application execution and this resulted in new computer science as well as computational science advances.
In the United Kingdom, the myGrid project [103] is a large consortium comprising the universities of Manchester, Southampton, Nottingham, Newcastle and Sheffield together with the European Bioinformatics Institute at Hinxton near Cambridge. In addition, GSK, AstraZeneca, IBM and SUN are industrial collaborators in the project. The goal of myGrid is to design, develop and demonstrate higher-level functionalities over the Grid to sup-port scientists making use of complex distributed resources. The project is developing an e-Scientist’s workbench providing support for the process of experimental investiga-tion, evidence accumulation and result assimilation. A novel feature of the workbench will be provision for personalization facilities relating to resource selection, data man-agement and process enactment. The myGrid design and development activity will be driven by applications in bioinformatics – one for the analysis of functional genomic data and another for supporting the annotation of a pattern database. The project intends to deliver Grid middleware services for automatic data annotation, workflow support and data access and integration. To support this last goal, the myGrid project will be a key application test case for the middleware being produced by the UK Core Programme project on OGSA – DAI [108].
1.5.2 Engineering-oriented applications
The Grid has provided an important platform for making resource-intensive engineering applications more cost-effective. One of the most comprehensive approaches to deploying production Grid infrastructure and developing large-scale engineering-oriented Grid appli-cations is the NASA IPG [50] in the United States (Chapter 5). The NASA IPG vision provides a blueprint for revolutionizing the way in which NASA executes large-scale science and engineering problems via the development of
1. persistent Grid infrastructure supporting ‘highly capable’ computing and data manage-ment services that, on demand, will locate and co-schedule the multicenter resources needed to address large-scale and/or widely distributed problems,
2. ancillary services needed to support the workflow management frameworks that coor-dinate the processes of distributed science and engineering problems.
Crew capabilities -accuracy -perception
Human models
Landing gear models
• Braking performance • Steering capabilities • Traction
• Dampening capabilities • Thrust performance• Reverse thrust performance • Responsiveness
• Fuel consumption Airframe models
Wing models
Stabilizer models
Engine models • Lift capabilities
• Drag capabilities
• Deflection capabilities • Responsiveness
Figure 1.20 A Grid for aerospace engineering showing linkage of geographically separated sub-systems needed by an aircraft.
Build as multiple filter web services Build as multiple interdisciplinary Programs Filter1
WS
Filter1 WS
Filter1 WS
Prog1 WS
Prog2 WS
Sensor data as a Web service (WS)
Sensor management
WS
Data analysis WS
Visualization WS Simulation WS
In Europe, there are also interesting Grid Engineering applications being investi-gated. For example, the UK Grid Enabled Optimization and Design Search for Engi-neering (GEODISE) project [110] is looking at providing an engiEngi-neering design knowl-edge repository for design in the aerospace area. Rolls Royce and BAESystems are industrial collaborators. Figure 1.22 shows this GEODISE engineering design Grid that will address, in particular the ‘repeat engagement’ challenge in which one wishes to build a semantic Grid (Chapter 17) to capture the knowledge of experienced design-ers. This of course is a research challenge and its success would open up many simi-lar applications.
1.5.3 Data-oriented applications
As described in Chapter 36, data is emerging as the ‘killer application’ of the Grid. Over the next decade, data will come from everywhere – scientific instruments, experiments, sensors and sensornets, as well as a plethora of new devices. The Grid will be used to collect, store and analyze data and information, as well as to synthesize knowledge from data. Data-oriented applications described in Chapters 38 to 42 represent one of the most important application classes on the Grid and will be key to critical progress for both science and society. The importance of data for the Grid is also illustrated in several chapters: Chapters 7, 14 to 17 emphasize it in Part B of the book.
Geodise Project
APPLICATION SERVICE PROVIDER
COMPUTATION GEODISE
PORTAL
OPTIMIZATION Engineer
Parallel machines Clusters Internet resource providers
Pay-per-use Optimisation
archive
Intelligent application manager
Intelligent resource provider Licenses
and code Session
database
Design archive
OPTIONS system Knowledge
repository
Traceability
Visualization
Globus, Condor, SRB Ontology for
engineering, computation, & optimisation and
design search
Reliability security
QoS
CAD System CADDS
IDEAS ProE CATIA, ICAD
Analysis CFD FEM CEM
DAME project
In-flight data
Airline
Ground station
Global network eg: SITA
Internet, e-mail, pager
DS&S Engine Health Center
Data center Maintenance center
Figure 1.23 DAME Grid to manage data from aircraft engine sensors.
An example of a data-oriented application is Distributed Aircraft Maintenance Envi-ronment (DAME) [111], illustrated in Figure 1.23. DAME is an industrial application being developed in the United Kingdom in which Grid technology is used to handle the gigabytes of in-flight data gathered by operational aircraft engines and to integrate maintenance, manufacturer and analysis centers. The project aims to build a Grid-based distributed diagnostics system for aircraft engines and is motivated by the needs of Rolls Royce and its information system partner Data Systems and Solutions. The project will address performance issues such as large-scale data management with real-time demands. The main deliverables from the project will be a generic distributed diagnostics Grid application, an aero gas turbine application demonstrator for the maintenance of aircraft engines and techniques for distributed data mining and diagnostics. Distributed diagnos-tics is a generic problem that is fundamental in many fields such as medical, transport and manufacturing. DAME is an application currently being developed within the UK e-Science program.
1.5.4 Physical science applications
Reconstruction
Simulation
Analysis
Interactive physics analysis batc h ph ysic s analysis
Batch physics analysis
Detector
Event summary
Raw data
event reprocess in g
Event reprocessing
event si mulati on
Event simulation
Data handling and computation for physics analysis
event fi lter (selecti on & rec onst ruct io n)
Event filter (selection & reconstruction)
Processed data
CER N
data
Analysis objects (extracted by physics topic)
Figure 1.24 Architecture of particle physics analysis Grid (Chapter 39).
100 Gb s−1 GTRN network) while each physics event can be processed independently,
resulting in trillion-way parallelism.
The astronomy community has also targeted the Grid as a means of successfully col-lecting, sharing and mining critical data about the universe. For example, the National Virtual Observatory Project in the United States [79] is using the Grid to federate sky surveys from several different telescopes, as discussed in Chapter 38. Using Grid tech-nology, the sky surveys sort, index, store, filter, analyze and mine the data for important information about the night sky. High-performance Grids, such as TeraGrid, will enable NVO researchers to shorten the process of collecting, storing and analyzing sky survey data from 60 days to 5 days and will enable researchers to federate multiple sky sur-veys. Figures 1.25 and 1.26 show the NVO [113] and the potential impact of TeraGrid capabilities on this process.
Source catalogs, image data
Analysis/discovery tools: Visualization, Statistics
Specialized data: spectroscopy, time series,
polarization Information archives: derived & legacy data: NED, Simbad, ADS, etc
Standards
Query tools
Figure 1.25 Architecture for the national virtual observatory.
1. Filter Raw
DataRaw 1. Filter Data
National Virtual Observatory 2MASS Analysis Pipeline
MCAT (update indexes)SRB containers (store
sorted, processed data into HPSS)
Blue horizon
9.5 TB raw data 5 million files Today:
1 sec/file
Raw
data 1. Filter
16MB s−1
2. Sort/ Index
Data 3. Retrieve,
analyze data
4. Output image
60 days to ingest (sort, index, store) data
Restriced Web-based access to a maximum of 100 MB file (1 SRB container)
With TeraGrid:
Raw data
Raw data
1. Filter
1. Filter
250+ MB s−1
0.1 sec/file 2. Sort/
index data
Data from other surveys
Store data via SRB MCAT (update indexes)
10’s of TB of data
3. Retrieve, analyze data
4. Output image DTF
cluster Store products
Significant reduction in time to ingest data; less than 5 days Web-based query interface for on-line access to all data
Support for multiple surveys; distributed join of data across surveys Storage and network works together
Figure 1.26 e-Science for the 2MASS astronomical data analyzed by the TeraGrid.
X-Ray e-Lab
Analysis
Properties e-Lab Simulation
Video
Diffractometer
Globus Structures
database
Properties
Figure 1.27 A combinatorial chemistry Grid (Chapter 42).
Finally, Figure 1.27 captures the combinatorial chemistry application of Chapter 42; experiments in this field create their deluge by parallel execution. Here we see ‘experiment-on demand’ with a smart laboratory (e-Lab) running miniGrid software and performing needed experiments in real time to fill in knowledge holes.
1.5.5 Trends in research: e-Science in a collaboratory
The interesting e-Science concept illustrates changes that information technology is bring-ing to the methodology of scientific research [114]. e-Science is a relatively new term that has become particularly popular after the launch of the major United Kingdom initia-tive described in Section 1.4.3. e-Science captures the new approach to science involving distributed global collaborations enabled by the Internet and using very large data col-lections, terascale computing resources and high-performance visualizations. e-Science is about global collaboration in key areas of science, and the next generation of infrastruc-ture, namely the Grid, that will enable it. Figure 1.28 summarizes the e-Scientific method. Simplistically, we can characterize the last decade as focusing on simulation and its inte-gration with science and engineering – this is computational science. e-Science builds on this adding data from all sources with the needed information technology to analyze and assimilate the data into the simulations.
Over the last half century, scientific practice has evolved to reflect the growing power of communication and the importance of collective wisdom in scientific discovery. Originally scientists collaborated by sailing ships and carrier pigeons. Now aircraft, phone, e-mail and the Web have greatly enhanced communication and hence the quality and real-time nature of scientific collaboration. The collaboration can be both ‘real’ or enabled elec-tronically – as evidenced by Bill Wulf [115, 116] early influential work on the scientific collaboratory.
Data
Information
Ideas Simulation
Model
Assimilation
Reasoning
Datamining Informatics e-Science
computing paradigm
Computational science
Figure 1.28 Computational science and information technology merge in e-Science.
important is the infrastructure to support shared resources – this includes many key ser-vices including security, scheduling and management, registration and search serser-vices (Chapter 19) and the message-based interfaces of Web services (Chapter 18) to allow powerful sharing (collaboration) mechanisms. All of the basic Grid services and infras-tructure provide a critical venue for collaboration and will be highly important to the community.
1.5.6 Commercial Applications
In the commercial world, Grid, Web and distributed computing, and information concepts are being used in an innovative way in a wide variety of areas including inventory control, enterprise computing, games and so on. The Butterfly Grid [117] and the Everquest multi-player gaming environment [118] are current examples of gaming systems using Grid-like environments. The success of SETI@home [36], a highly distributed data-mining applica-tion with the goal of identifying patterns of extraterrestrial intelligence from the massive amounts of data received by the Arecibo radio telescope, has inspired both innovative research and a cadre of companies to develop P2P technologies. Chapter 12 describes the Entropia system, one of the intellectual leaders in this area of P2P or Megacomputing. Another interesting application of this type, climateprediction.com [119], is being devel-oped by the UK e-Science program. This will implement the ensemble (multiple initial conditions and dynamical assumptions) method for climate prediction on a megacomputer.
Enterprise computing areas where the Grid approach can be applied include [10]
• end-to-end automation,
• virtual server hosting,
• disaster recovery,
• heterogeneous workload management,
• end-to-end systems management,
• scalable clustering,
• accessing the infrastructure,
• ‘utility’ computing,
• accessing new capability more quickly,
• better performance,
• reducing up-front investment,
• gaining expertise not available internally, and
• Web-based access (portal) for control (programming) of enterprise function.
Chapter 43 describes issues that arise in incorporating Web services into enterprise computing. In addition to these enterprise applications, the concept of ‘e-Utility’ has emerged to summarize ‘X-on-demand’: computing-on-demand, storage-on-demand, networking-on-demand, information-on-demand and so on. This generalizes the familiar concept of Application Service Providers (ASPs). Some clear examples today of computing-on-demand come from systems like Condor and Entropia (Chapters 11 and 12). The use of Grid technologies to support e-Utility can be merged with those of autonomic computing (Chapter 13 and Section 1.6.1) in a new generation of commercial systems. Other interesting commercial Grid activities include the Sun Grid Engine [32] and Platform Computing [34] implementing resource management and scheduling opportunities similar to those addressed by Condor in Chapter 11.
The growing partnership between the commercial sector and the academic community in the design and development of Grid technologies is likely to bear fruit in two important ways: as a vehicle for a new generation of scientific advances and as a vehicle for a new generation of successful commercial products.
1.5.7 Application Summary
Applications are key to the Grid, and the examples given above show that at this stage we have some clear successes and a general picture as to what works today. A major purpose of the broader Grid deployment activities described in the Section 1.4.3 is to encourage further application development. Ultimately, one would hope that the Grid will be the operating system of the Internet and will be viewed in this fashion. Today we must strive to improve the Grid software to make it possible that more than the ‘marine corps’ of application developers can use the Grid. We can identify three broad classes of applications that today are ‘natural for Grids’ [120].
• Staged/linked applications (do Part A then do Part B): These include remote instrument applications in which one gets input from the instrument at Site A, compute/analyze data at Site B and visualizes at Site C. We can coordinate resources including computers, data archives, visualization and multiple remote instruments.
• Access to resources (get something from/do something at Site A): This includes portals, access mechanisms and environments described in Part C of the book.
Chapters 35 to 42 describe many of the early successes as do several of the chapters in Part C that describe Grid environments used to develop problem-solving environments and portals. One influential project was the numerical relativity simulations of colliding black holes where Grids have provided the largest simulations. The Cactus Grid software was developed for this (Chapter 23) and an early prototype is described in Chapter 37. An interesting example is Synthetic Forces (SF) Express [121], which can be considered as an example of Grid technology applied to military simulations. This large-scale distributed interactive battle simulation decomposed terrain (Saudi Arabia, Kuwait, Iraq) contiguously among supercomputers and performed a simulation of 100 000 vehicles in early 1998 with vehicle (tanks, trucks and planes) location and state updated several times a second. Note that the military simulation community has developed its own sophisticated distributed object technology High-Level Architecture (HLA) [122] and the next step should involve integrating this with the more pervasive Grid architecture.
Next-generation Grid applications will include the following:
• Adaptive applications (run where you can find resources satisfying criteria X),
• Real-time and on-demand applications (do something right now),
• Coordinated applications (dynamic programming, branch and bound)and
• Poly-applications (choice of resources for different components).
Note that we still cannot ‘throw any application at the Grid’ and have resource manage-ment software determine where and how it will run.
There are many more Grid applications that are being developed or are possible. Major areas of current emphasis are health and medicine (brain atlas, medical imaging [123] as in Chapter 41, telemedicine, molecular informatics), engineering, particle physics (Chapter 39), astronomy (Chapter 38), chemistry and materials (Chapter 42 and [124]), environmental science (with megacomputing in [119]), biosciences and genomics (see Chapter 40 and [125, 126]), education (Chapter 43) and finally digital libraries (see Chapter 36).
Grid applications will affect everybody – scientists, consumers, educators and the gen-eral public. They will require a software environment that will support unprecedented diversity, globalization, integration, scale and use. This is both the challenge and the promise of the Grid.
1.6 FUTURES – GRIDS ON THE HORIZON
change over the next decade. The future will expand existing technologies and inte-grate new technologies. In the future, more resources will be linked by more and better networks. At the end of the decade, sensors, PDAs, health monitors and other devices will be linked to the Grid. Petabyte data resources and petaflop computational resources will join low-level sensors and sensornets to constitute Grids of unprecedented hetero-geneity and performance variation. Over the next decade, Grid software will become more sophisticated, supporting unprecedented diversity, scale, globalization and adapta-tion. Applications will use Grids in sophisticated ways, adapting to dynamic configurations of resources and performance variations to achieve goals of Autonomic computing.
Accomplishing these technical and disciplinary achievements will require an immense research, development and deployment effort from the community. Technical requirements will need to be supported by the human drivers for Grid research, development and education. Resources must be made available to design, build and maintain Grids that are of high capacity (rich in resources), of high capability (rich in options), persistent (promoting stable infrastructure and a knowledgeable workforce), evolutionary (able to adapt to new technologies and uses), usable (accessible, robust and easy-to-use), scalable (growth must be a part of the design), and able to support/promote new applications.
Today, many groups are looking beyond the challenges of developing today’s Grids to the research and development challenges of the future. In this section, we describe some key areas that will provide the building blocks for the Grids of tomorrow.
1.6.1 Adaptative and autonomic computing
The Grid infrastructure and paradigm is often compared with the Electric Power Grid [127]. On the surface, the analogy holds up – the Grid provides a way to seamlessly virtualize resources so that they can provide access to effectively infinite computing cycles and data storage for the user who ‘plugs in’ to the Grid. The infrastructure managing which machines, networks, storage and other resources are used is largely hidden from the user in the same way as individuals generally do not know which power company, transformer, generator and so on are being used when they plug their electric appliance into a socket. The analogy falls short when it comes to performance. Power is either there or not there. To the first order, the location of the plug should not make electrical devices plugged into it run better. However, on the Grid, the choice of the machine, the network and other component impacts greatly the performance of the program. This variation in performance can be leveraged by systems that allow programs to adapt to the dynamic performance that can be delivered by Grid resources. Adaptive computing is an important area of Grid middleware that will require considerable research over the next decade.
ensure that software systems are flexible and can adapt to change [129]. Moore’s law [8] has of course a profound impact on computing. It describes the technology improvement that governs increasing CPU performance, memory size and disk storage. Further, it also underlies the improvement in sensor technology that drives the data deluge underlying much of e-Science. However, technology progress may provide increased capability at the cost of increased complexity. There are orders of magnitude more servers, sensors and clients to worry about. Such issues are explored in depth in Chapter 13 and we expect this to be an important aspect of Grid developments in the future. Both the nodes of the Grid and their organization must be made robust – internally fault-tolerant, as well as resilient to changes and errors in their environment. Ultimately, the Grid will need self-optimizing, self-configuring, self-healing and self-protecting components with a flexible architecture that can adapt to change.
1.6.2 Grid programming environments
A curious observation about computational environments is that as the environment becomes more complex, fewer robust and usable tools seem to be available for man-aging the complexity and achieving program performance. The 1980s saw more maturity in the development of parallel architecture models than effective parallel software, and currently, efforts to develop viable programming environments for the Grid are limited to just a few forward-looking groups.
In order for the Grid to be fully usable and useful, this state of affairs will need to change. It will be critical for developers and users to be able to debug programs on the Grid, monitor the performance levels of their programs on Grid resources and ensure that the appropriate libraries and environments are available on deployed resources. Part C of the book, which discusses about Grid computing environments, and is summarized in Chapter 20, describes this area. To achieve the full vision of the Grid, we will need compilers that can interact with resource discovery and resource selection systems to best target their programs and run-time environments that allow the migration of programs during execution to take advantage of more optimal resources. Robust, useful and usable programming environments will require coordinated research in many areas as well as test beds to test program development and run-time ideas. The GrADS project [69] provides a first example of an integrated approach to the design, development and prototyping of a Grid programming environment.
Raw (HPC) resources Middleware
Database
Portal services
System services
System services
System services Application
service System
services
System services
Grid computing environments User
services
‘Core’ Grid
Figure 1.29 Grids, portals, and Grid computing environments.
An important area of research will target the development of appropriate models for interaction between users and applications and the Grid. Figure 1.29 illustrates the interrelation of Grid components involved in developing portals and Grid Computing Environments (GCEs): The horizontal direction corresponds to application and/or resource functionality (parallel simulation, sensor data gather, optimization, database etc.). The vertical direction corresponds to system functionality from scheduling to composition to portal rendering. Note that system state is determined by its environment, by user request and by the running application in some dynamic fashion. Currently, there is no ‘consensus complete model’ from user to resource and correspondingly no clear distinction between GCE and ‘core’ Grid capabilities (shown at the top and bottom of Figure 1.29, respec-tively). The matrix of capabilities sketched in Figure 1.29 and elaborated in Chapter 20 is very rich and we can expect different approaches to have value for different applications.
1.6.3 New Technologies
At the beginning of the twenty-first century, we are witnessing an immense explosion in telecommunications. The ubiquitous cell phones and PDAs of today are just the beginning of a deeper paradigm shift predicated upon the increasing availability of comprehensive information about the world around us.
![Figure 1.2 Computational environment for analyzing real-time data taken at Argonne’s advanced photon source was an early example of a data-intensive Grid application [6]](https://thumb-us.123doks.com/thumbv2/123dok_us/1006118.615274/4.714.156.521.109.341/computational-environment-analyzing-argonne-advanced-example-intensive-application.webp)
![(E) N [(2 Ethoxynaphthalen 1 yl)methylidene] 2 ethylaniline](data:image/gif;base64,R0lGODlhAQABAIAAAP///wAAACH5BAEAAAAALAAAAAABAAEAAAICRAEAOw==)