What You’ll Learn
• You will use mathematicaltools to measure and predict.
• You will apply accuracy and precision when measuring.
• You will display and evaluate data graphically.
Why It’s Important
The measurement and mathematics tools presented here will help you to analyze data and make predictions.Satellites Accurate and precise measurements are important when constructing and launching a satellite— errors are not easy to correct later. Satellites, such as the Hubble Space Telescopeshown here, have revolutionized scientific research, as well as communications.
Think About This
Physics research has led to many new technologies, such as satellite-based telescopes and communications. What are some other examples of tools developed from physics research in the last 50 years?
2
physicspp.com
NASA
Do all objects fall at the same rate?
Question
How does weight affect the rate at which an object falls?
Procedure
The writings of the Greek philosopher Aristotle included works on physical science theories. These were a major influence in the late Middle Ages. Aristotle reasoned that weight is a factor governing the speed of fall of a dropped object, and that the rate of fall must increase in proportion to the weight of the object. 1.Tape four pennies together in a stack. 2.Place the stack of pennies on your hand and
place a single penny beside them.
3.Observe Which is heaviest and pushes down on your hand the most?
4.Observe Drop the two at the same time and observe their motions.
Analysis
According to Aristotle, what should be the rate of fall of the single penny compared to the stack? What did you observe?
Critical Thinking Explain which of the following properties might affect the rate of fall of an object: size, mass, weight, color, shape.
1.1
Mathematics and Physics
Objectives
•Demonstratescientific methods.
•Usethe metric system. •Evaluateanswers using
dimensional analysis.
•Performarithmetic operations using scientific notation.
Vocabulary physics
dimensional analysis significant digits scientific method hypothesis scientific law scientific theory
W
hat do you think of when you see the word physics?Many peoplepicture a chalkboard covered with formulas and mathematics: Emc2, IV/R, d 1
2at 2v
0t d0. Perhaps you picture scientists in white lab coats, or well-known figures such as Marie Curie and Albert Einstein. Or, you might think of the many modern technologies created with physics, such as weather satellites, laptop computers, or lasers.
What is Physics?
Physics is a branch of science that involves the study of the physical world: energy, matter, and how they are related. Physicists investigate the motions of electrons and rockets, the energy in sound waves and electric circuits, the structure of the proton and of the universe. The goal of this course is to help you understand the physical world.
People who study physics go on to many different careers. Some become scientists at universities and colleges, at industries, or in research institutes. Others go into related fields, such as astronomy, engineering, computer science, teaching, or medicine. Still others use the problem-solving skills of physics to work in business, finance, or other very different disciplines.
4 Chapter 1 A Physics Toolkit
Electric Current The potential difference, or voltage, across a circuit equals the current
multiplied by the resistance in the circuit. That is, V (volts) I (amperes)R (ohms).
What is the resistance of a lightbulb that has a 0.75 amperes current when plugged into a 120-volt outlet?
Analyze the Problem
• Rewrite the equation. • Substitute values.Known: Unknown:
I 0.75 amperes R? V120 volts
Solve for the Unknown
Rewrite the equation so the unknown is alone on the left.
V IR
IRV Reflexive property of equality
R V
I Divide both sides by I.
0.71520amvopletsres Substitute 120 volts for V, 0.75 amperes for I.
160 ohms Resistance will be measured in ohms.
Evaluate the Answer
• Are the units correct? 1 volt1 ampere-ohm, so the answer in volts/ampere is in ohms, as expected.
• Does the answer make sense? 120 is divided by a number a little less than 1, so the answer should be a little more than 120.
3 2 1
Math Handbook
Isolating a Variable page 845
■Figure 1-1 Physicists use mathematics to represent many different phenomena—a trait sometimes spoofed in cartoons.
Mathematics in Physics
[image:3.660.201.539.36.148.2]Physics uses mathematics as a powerful language. As illustrated in Figure 1-1, this use of mathematics often is spoofed in cartoons. In physics, equations are important tools for modeling observations and for making predictions. Physicists rely on theories and experiments with numerical results to support their conclusions. For example, think back to the Launch Lab. You can predict that if you drop a penny, it will fall. But how fast? Different models of falling objects give different answers to how the speed of the object changes, or on what the speed depends, or which objects will fall. By measuring how an object falls, you can compare the experimen-tal data with the results predicted by different models. This tests the models, allowing you to pick the best one, or to develop a new model.
©1998 Bill Amend/Dist. by Universal Press Syndicate
For each problem, give the rewritten equation you would use and the answer.
1. A lightbulb with a resistance of 50.0 ohms is used in a circuit with a 9.0-volt battery. What is the current through the bulb?
2. An object with uniform acceleration a, starting from rest, will reach a speed of vin time t
according to the formula vat. What is the acceleration of a bicyclist who accelerates from rest to 7 m/s in 4 s?
3. How long will it take a scooter accelerating at 0.400 m/s2to go from rest to a speed of 4.00 m/s?
4. The pressure on a surface is equal to the force divided by the area: PF/A. A 53-kg woman exerts a force (weight) of 520 Newtons. If the pressure exerted on the floor is 32,500 N/m2, what is the area of the soles of her shoes?
Section 1.1 Mathematics and Physics 5 ■Figure 1-2 What is a reasonable range of values for the speed of an automobile?
Table 1-1
SI Base Units
Base Quantity Base Unit Symbol
Length Mass Time Temperature
Amount of a substance Electric current
Luminous intensity
meter kilogram second kelvin mole ampere candela
m kg s K mol
A cd
Does it make sense? Sometimes you will work with unfamiliar units, as in Example Problem 1, and you will need to use estimation to check that your answer makes sense mathematically. At other times you can check
that an answer matches your experience, as shown in Figure 1-2.When
you work with falling objects, for example, check that the time you calcu-late an object will take to fall matches your experience—a copper ball dropping 5 m in 0.002 s, or in 17 s, doesn’t make sense.
The Math Handbook in the back of this book contains many useful explanations and examples. Refer to it as needed.
SI Units
To communicate results, it is helpful to use units that everyone under-stands. The worldwide scientific community and most countries currently use an adaptation of the metric system to state measurements. The Système International d’Unités, or SI, uses seven base quantities, which are
shown in Table 1-1. These base quantities were originally defined in
terms of direct measurements. Other units, called derived units, are created by combining the base units in various ways. For example, energy is meas-ured in joules, where 1 joule equals one kilogram-meter squared per second squared, or 1 J1 kgm2/s2. Electric charge is measured in coulombs, where 1 C 1 As.
6 Chapter 1 A Physics Toolkit
■Figure 1-3 The standards for the kilogram and meter are shown. The International Prototype Meter originally was measured as the distance between two marks on a platinum-iridium bar, but as methods of measuring time became more precise than those for measuring length, the meter came to be defined as the distance traveled by light in a vacuum in 1/299 792 458 s.
Table 1-2
Prefixes Used with SI Units
Prefix Symbol Multiplier Scientific Notation Example femto- pico- nano- micro- milli- centi- deci- kilo- mega- giga- tera-f p n m c d k M G T 0.000000000000001 0.000000000001 0.000000001 0.000001 0.001 0.01 0.1 1000 1,000,000 1,000,000,000 1,000,000,000,000
1015 1012 109 106 103
102 101 103 106 109 1012 femtosecond (fs) picometer (pm) nanometer (nm) microgram (g)
milliamps (mA) centimeter (cm) deciliter (dL) kilometer (km) megagram (Mg) gigameter (Gm) terahertz (THz) Scientific institutions have been created to define and regulate meas-ures. The SI system is regulated by the International Bureau of Weights and Measures in Sèvres, France. This bureau and the National Institute of Science and Technology (NIST) in Gaithersburg, Maryland keep the stan-dards of length, time, and mass against which our metersticks, clocks, and balances are calibrated. Examples of two standards are shown in Figure 1-3. NIST works on many problems of measurement, including industrial and research applications.
You probably learned in math class that it is much easier to convert meters to kilometers than feet to miles. The ease of switching between units is another feature of the metric system. To convert between SI units, multiply or divide by the appropriate power of 10. Prefixes are used to change SI units by powers of 10, as shown in Table 1-2. You often will encounter these prefixes in daily life, as in, for example, milligrams, nanoseconds, and gigabytes.
Dimensional Analysis
You can use units to check your work. You often will need to use different versions of a formula, or use a string of formulas, to solve a physics problem. To check that you have set up a problem correctly, write out the equation or set of equations you plan to use. Before performing calculations, check that the answer will be in the expected units, as shown in step 3 of Example Problem 1. For example, if you are finding a speed and you see that your answer will be measured in s/m or m/s2, you know you have made an error in setting up the problem. This method of treating the units as algebraic quantities, which can be cancelled, is called dimensional analysis.
Dimensional analysis also is used in choosing conversion factors. A conversion factor is a multiplier equal to 1. For example, because 1 kg1000 g, you can construct the following conversion factors:
1 1 1 00 k 0 g g
11
1 00 k 0 g g Math Handbook Dimensional Analysis page 847
National Institute of Standards and Technology
Section 1.1 Mathematics and Physics 7 Use dimensional analysis to check your equation before multiplying.
5. How many megahertz is 750 kilohertz? 6. Convert 5021 centimeters to kilometers. 7. How many seconds are in a leap year? 8. Convert the speed 5.30 m/s to km/h.
Math Handbook
Significant Digits pages 833—836
■Figure 1-4 This answer to 3.97.2 should be rounded to two significant digits. Choose a conversion factor that will make the units cancel, leaving the
answer in the correct units. For example, to convert 1.34 kg of iron ore to grams, do as shown below.
1.34 kg
11 00
k 0
g g
1340 gYou also might need to do a series of conversions. To convert 43 km/h to m/s, do the following:
431 k
h m
11 00
k 0
m m
60 1
m h
in
16 m 0
i s
n
12 m/sSignificant Digits
Suppose you use a meterstick to measure a pen, and you find that the end of the pen is just past 14.3 cm. This measurement has three valid digits: two you are sure of, and one you estimated. The valid digits in a measurement are called significant digits. The last digit given for any measurement is the uncertain digit. All nonzero digits in a measurement are significant.
Are all zeros significant? No. For example, in the measurement 0.0860 m, the first two zeros serve only to locate the decimal point and are not sig-nificant. The last zero, however, is the estimated digit and is sigsig-nificant. The measurement 172,000 m could have 3, 4, 5, or 6 significant digits. This ambiguity is one reason to use scientific notation: it is clear that the measurement 1.7200105m has five significant digits.
Arithmetic with significant digits When you perform any arithmetic operation, it is important to remember that the result never can be more precise than the least-precise measurement.
To add or subtract measurements, first perform the operation, then round off the result to correspond to the least-precise value involved. For
example, 3.86 m2.4 m6.3 m because the least-precise measure is to
one-tenth of a meter.
To multiply or divide measurements, perform the calculation and then round to the same number of significant digits as the least-precise
measurement. For example, 409.2 km/11.4 L35.9 km/L, because the
least-precise measure has three significant digits.
Some calculators display several additional digits, as shown in Figure 1-4, while others round at different points. Be sure to record your answers with the correct number of digits. Note that significant digits are consid-ered only when calculating with measurements. There is no uncertainty associated with counting (4 washers) or exact conversion factors (24 hours in 1 day).
■Figure 1-5 These students are conducting an experiment to determine how much power they produce climbing the stairs (a). They use their data to predict how long it would take an engine with the same power to lift a different load (b).
Measuring
Change
Collect five identical washers and a spring that will stretch measurably when one washer is suspended from it.
1. Measurethe length of the spring with zero, one, two, and three washers suspended from it. 2. Graphthe length of the spring versus the mass.
3. Predictthe length of the spring with four and five washers. 4. Testyour prediction. Analyze and Conclude 5. Describethe shape of the graph. How did you use it to predict the two new lengths?
a
Solve the following problems.
9. a. 6.201 cm7.4 cm 0.68 cm 12.0 cm
b. 1.6 km 1.62 m 1200 cm
10. a. 10.8 g8.264 g
b. 4.75 m 0.4168 m
11. a. 139 cm2.3 cm
b. 3.2145 km 4.23 km
12. a. 13.78 g11.3 mL
b. 18.21 g 4.4 cm3
8 Chapter 1 A Physics Toolkit
Scientific Methods
In physics class, you will make observations, do experiments, and create models or theories to try to explain your results or predict new answers, as shown in Figure 1-5.This is the essence of a scientific method.All scien-tists, including physicists, obtain data, make predictions, and create com-pelling explanations that quantitatively describe many different phenomena. The experiments and results must be reproducible; that is, other scientists must be able to recreate the experiment and obtain similar data. Written, oral, and mathematical communication skills are vital to every scientist.
A scientist often works with an idea that can be worded as a hypothesis, which is an educated guess about how variables are related. How can the hypothesis be tested? Scientists conduct experiments, take measurements, and identify what variables are important and how they are related. For example, you might find that the speed of sound depends on the medium through which sound travels, but not on the loudness of the sound. You can then predict the speed of sound in a new medium and test your results.
b
Laura Sifferlin
■Figure 1-6 In the mid-1960s, Arno Penzias and Robert Wilson were trying to eliminate the constant background noise in an antenna to be used for radio astronomy. They tested systems, duct-taped seams, and cleared out pigeon manure, but the noise persisted. This noise is now understood to be the cosmic microwave background radiation, and is experimental support for the Big Bang theory.
■Figure 1-7 Drawings of early telescope observations (a) showed channels on Mars; recent photos taken with improved telescopes do not (b).In this photo of Mars’ surface from the Mars Global Surveyorspacecraft (c),these layered sedimentary rocks suggest that sedimentary deposits might have formed in standing water.
a b c
Section 1.1 Mathematics and Physics 9 Models, laws, and theories An idea, equation, structure, or system can
model the phenomenon you are trying to explain. Scientific models are based on experimentation. Recall from chemistry class the different mod-els of the atom that were in use over time—new modmod-els were developed to explain new observations and measurements.
If new data do not fit a model, both are re-examined. Figure 1-6shows a historical example. If a very well-established model is questioned, physi-cists might first look at the new data: can anyone reproduce the results? Were there other variables at work? If the new data are born out by subse-quent experiments, the theories have to change to reflect the new findings. For example, in the nineteenth century it was believed that linear markings
on Mars showed channels, as shown in Figure 1-7a. As telescopes
improved, scientists realized that there were no such markings, as shown in Figure 1-7b. In recent times, again with better instruments, scientists have found features that suggest Mars once had running and standing
water on its surface, as shown in Figure 1-7c. Each new discovery has
raised new questions and areas for exploration.
A scientific lawis a rule of nature that sums up related observations to describe a pattern in nature. For example, the law of conservation of charge states that in the various changes matter can undergo, the electric charge before and after stays the same. The law of reflection states that the angle of incidence for a light beam on a reflective surface equals the angle of reflection. Notice that the laws do not explain why these phenomena happen, they simply describe them.
10 Chapter 1 A Physics Toolkit
13. Math Why are concepts in physics described with formulas?
14. Magnetism The force of a magnetic field on a charged, moving particle is given by FBqv, where F is the force in kgm/s2, q is the charge in As, and vis the speed in m/s. Bis the strength of the magnetic field, measured in teslas, T. What is 1 tesla described in base units?
15. Magnetism A proton with charge 1.601019As is moving at 2.4105m/s through a magnetic field of 4.5 T. You want to find the force on the proton.
a.Substitute the values into the equation you will use. Are the units correct?
b.The values are written in scientific notation,
m10n. Calculate the 10npart of the equation to estimate the size of the answer.
c. Calculate your answer. Check it against your estimate from part b.
d. Justify the number of significant digits in your answer.
16. Magnetism Rewrite FBqvto find vin terms of
F, q, and B.
17. Critical Thinking An accepted value for the acceleration due to gravity is 9.801 m/s2. In an experiment with pendulums, you calculate that the value is 9.4 m/s2. Should the accepted value be tossed out to accommodate your new finding? Explain.
1.1
Section Review
physicspp.com/self_check_quiz Greek philosophers proposed that objects fall because they seek their natural places. The more massive the object, the faster it falls.
Galileo showed that the speed at which an object falls depends on the amount of time it falls, not on its mass.
Galileo’s statement is true, but Newton revised the reason why objects fall. Newton proposed that objects fall because the object and Earth are attracted by a force. Newton also stated that there is a force of attraction between any two objects with mass.
Galileo’s and Newton’s statements still hold true. However, Einstein suggested that the force of attraction between two objects is due to mass causing the space around it to curve.
Revision
Revision
Revision ■Figure 1-8 Theories are
changed and modified as new experiments provide insight and new observations are made. The theory of falling objects has undergone many revisions.
A scientific theoryis an explanation based on many observations sup-ported by experimental results. Theories may serve as explanations for laws. A theory is the best available explanation of why things work as they do. For example, the theory of universal gravitation states that all the mass in the universe is attracted to other mass. Laws and theories may be revised or discarded over time, as shown in Figure 1-8.Notice that this use of the word theoryis different from the common use, as in “I have a theory about why it takes longer to get to school on Fridays.” In scientific use, only a very well-supported explanation is called a theory.
Objectives
•Distinguishbetween accuracy and precision.
•Determinethe precision of measured quantities.
Vocabulary measurement precision accuracy
1.2
Measurement
■Figure 1-9 Drawings of animals from the Lascaux cave in France. By dating organic material in the cave, such as pigments and torch marks, scientists are able to suggest dates at which these cave paintings were made. Each date is reported with an uncertainty to show how precise the measurement is.
W
hen you visit the doctor for a checkup, many measurements aretaken: your height, weight, blood pressure, and heart rate. Even your vision is measured and assigned a number. Blood might be drawn so measurements can be made of lead or cholesterol levels. Measurements quantify our observations: a person’s blood pressure isn’t just “pretty good,” it’s 110/60, the low end of the good range.
What is a measurement? A measurement is a comparison between an
unknown quantity and a standard. For example, if you measure the mass of a rolling cart used in an experiment, the unknown quantity is the mass of the cart and the standard is the gram, as defined by the balance or spring scale you use. In the Mini Lab in Section 1.1, the length of the spring was the unknown and the centimeter was the standard.
Comparing Results
As you learned in Section 1.1, scientists share their results. Before new data are fully accepted, other scientists examine the experiment, looking for possible sources of error, and try to reproduce the results. Results often are reported with an uncertainty. A new measurement that is within the margin of uncertainty confirms the old measurement.
For example, archaeologists use radiocarbon dating to find the age of cave paintings, such as those from the Lascaux cave, in Figure 1-9,and the Chauvet cave. Radiocarbon dates are reported with an uncertainty. Three radiocarbon ages from a panel in the Chauvet cave are 30,940 610 years,
30,790 600 years, and 30,230 530 years. While none of the
measure-ments exactly match, the uncertainties in all three overlap, and the meas-urements confirm each other.
12 Chapter 1 A Physics Toolkit
1 2 3
14.0 14.5 15.0
Spring length (cm)
Student 13.7
Mini Lab Data
a b
Suppose three students performed the Mini Lab from Section 1.1 several times, starting with springs of the same length. With two washers on the spring, student 1 made repeated measurements, which ranged from 14.4 cm to 14.8 cm. The average of student 1’s measurements was 14.6 cm,
as shown in Figure 1-10. This result was reported as (14.60.2) cm.
Student 2 reported finding the spring’s length to be (14.8 0.3) cm.
Student 3 reported a length of (14.0 0.1) cm.
Could you conclude that the three measurements are in agreement? Is student 1’s result reproducible? The results of students 1 and 2 overlap; that is, they have the lengths 14.5 cm to 14.8 cm in common. However, there is no overlap and, therefore, no agreement, between their results and the result of student 3.
Precision Versus Accuracy
Both precision and accuracy are characteristics of measured values. How precise and accurate are the measurements of the three students? The degree of exactness of a measurement is called its precision. Student 3’s measurements are the most precise, within 0.1 cm. The measurements of the other two students are less precise because they have a larger uncertainty. Precision depends on the instrument and technique used to make the measurement. Generally, the device that has the finest division on its scale produces the most precise measurement. The precision of a measurement is one-half the smallest division of the instrument. For example, the grad-uated cylinder in Figure 1-11ahas divisions of 1 mL. You can measure an object to within 0.5 mL with this device. However, the smallest division on the beaker in Figure 1-11bis 50 mL. How precise were your measurements in the MiniLab?
The significant digits in an answer show its precision. A measure of 67.100 g is precise to the nearest thousandth of a gram. Recall from Section 1.1 the rules for performing operations with measurements given to dif-ferent levels of precision. If you add 1.2 mL of acid to a beaker containing
2.4102 mL of water, you cannot say you now have 2.412102 mL of
fluid, because the volume of water was not measured to the nearest tenth of a milliliter, but to 100 times that.
■Figure 1-11 The graduated cylinder contains 410.5 mL (a). The flask contains 325 mL 25 mL (b).
■Figure 1-10 Three students took multiple measurements. Are the measurements in agreement? Is student 1’s result reproducible?
Horizons Companies
Section 1.2 Measurement 13 ■Figure 1-13 By positioning the scale head on (a),your results will be more accurate
than if you read your measurements at an angle (b).How far did parallax shift the measurement in b?
■Figure 1-12 Accuracy is checked by measuring a known value.
Accuracy describes how well the results of a measurement agree with the “real” value; that is, the accepted value as measured by competent experimenters. If the length of the spring that the three students measured had been 14.8 cm, then student 2 would have been most accurate and stu-dent 3 least accurate. How accurate do you think your measurements in the Mini Lab on page 8 were? What might have led someone to make inaccu-rate measurements? How could you check the accuracy of measurements? A common method for checking the accuracy of an instrument is called the two-point calibration. First, does the instrument read zero when it should? Second, does it give the correct reading when it is measuring an accepted standard, as shown in Figure 1-12?Regular checks for accuracy are performed on critical measuring instruments, such as the radiation output of the machines used to treat cancer.
Techniques of Good Measurement
To assure accuracy and precision, instruments also have to be used cor-rectly. Measurements have to be made carefully if they are to be as precise as the instrument allows. One common source of error comes from the angle at which an instrument is read. Scales should be read with one’s eye directly above the measure, as shown in Figure 1-13a.If the scale is read from an angle, as shown in Figure 1-13b,you will get a different, and less accurate, value. The difference in the readings is caused by parallax,which is the apparent shift in the position of an object when it is viewed from different angles. To experiment with parallax, place your pen on a ruler and read the scale with your eye directly over the tip, then read the scale with your head shifted far to one side.
a b
Distance to the Moon For over 25 years, scientists have been accurately measuring the distance to the Moon by shining lasers through telescopes. The laser beam reflects off reflectors placed on the surface of the Moon by Apollo astronauts. They have determined that the average distance between the centers of Earth and the Moon is 385,000 km, and it is known with an accuracy of better than one part in 10 billion. Using this laser technique, scientists also have discovered that the Moon is receding from Earth at about 3.8 cm/yr.
14 Chapter 1 A Physics Toolkit
18. Accuracy Some wooden rulers do not start with 0 at the edge, but have it set in a few millimeters. How could this improve the accuracy of the ruler?
19. Tools You find a micrometer (a tool used to meas-ure objects to the nearest 0.01 mm) that has been badly bent. How would it compare to a new, high-quality meterstick in terms of its precision? Its accuracy?
20. Parallax Does parallax affect the precision of a measurement that you make? Explain.
21. Error Your friend tells you that his height is 182 cm. In your own words, explain the range of heights implied by this statement.
22. Precision A box has a length of 18.1 cm and a width of 19.2 cm, and it is 20.3 cm tall.
a.What is its volume?
b.How precise is the measure of length? Of volume?
c. How tall is a stack of 12 of these boxes?
d.How precise is the measure of the height of one box? of 12 boxes?
23. Critical Thinking Your friend states in a report that the average time required to circle a 1.5-mi track was 65.414 s. This was measured by timing 7 laps using a clock with a precision of 0.1 s. How much confidence do you have in the results of the report? Explain.
1.2
Section Review
physicspp.com/self_check_quiz
■Figure 1-14 A series of expeditions succeeded in placing a GPS receiver on top of Mount Everest. This improved the accuracy of the altitude measurement: Everest’s peak is 8850 m, not 8848 m, above sea level.
The Global Positioning System, or GPS, offers an illustration of accuracy and precision in measurement. The GPS consists of 24 satellites with trans-mitters in orbit and numerous receivers on Earth. The satellites send signals with the time, measured by highly accurate atomic clocks. The receiver uses the information from at least four satellites to determine latitude, longitude, and elevation. (The clocks in the receivers are not as accurate as those on the satellites.)
Receivers have different levels of precision. A device in an automobile might give your position to within a few meters. Devices used by geo-physicists, as in Figure 1-14, can measure movements of millimeters in Earth’s crust.
The GPS was developed by the United States Department of Defense. It uses atomic clocks, developed to test Einstein’s theories of relativity and gravity. The GPS eventually was made available for civilian use. GPS signals now are provided worldwide free of charge and are used in navigation on land, at sea, and in the air, for mapping and surveying, by telecommuni-cations and satellite networks, and for scientific research into earthquakes and plate tectonics.
Bill Crouse
Objectives
•Graphthe relationship between independent and dependent variables.
•Interpretgraphs. •Recognizecommon
relationships in graphs.
Vocabulary independent variable dependent variable line of best fit linear relationship quadratic relationship inverse relationship
1.3
Graphing Data
[image:14.666.355.563.512.728.2]Section 1.3 Graphing Data 15
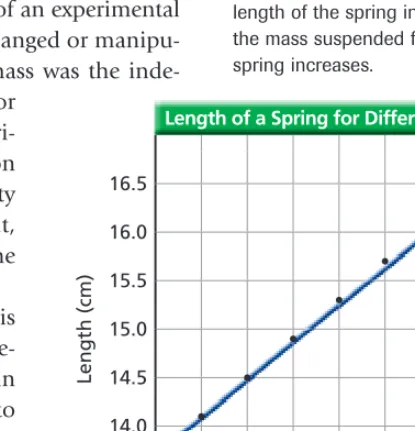
Table 1-3
Length of a Spring for Different Masses
Mass Attached to Spring (g)
Length of Spring (cm)
0 5 10 15 20 25 30 35
13.7 14.1 14.5 14.9 15.3 15.7 16.0 16.4
A
well-designed graph can convey information quickly and simply.Patterns that are not immediately evident in a list of numbers take shape when the data are graphed. In this section, you will develop graph-ing techniques that will enable you to display, analyze, and model data.
Identifying Variables
When you perform an experiment, it is important to change only one factor at a time. For example, Table 1-3gives the length of a spring with dif-ferent masses attached, as measured in the Mini Lab. Only the mass varies; if different masses were hung from different types of springs, you wouldn’t know how much of the difference between two data pairs was due to the different masses and how much to the different springs.
A variableis any factor that might affect the behavior of an experimental setup. The independent variableis the factor that is changed or manipu-lated during the experiment. In this experiment, the mass was the inde-pendent variable. The deinde-pendent variable is the factor
that depends on the independent variable. In this experi-ment, the amount that the spring stretched depended on the mass. An experiment might look at how radioactivity varies with time, how friction changes with weight, or how the strength of a magnetic field depends on the distance from a magnet.
One way to analyze data is to make a line graph. This shows how the dependent variable changes with the inde-pendent variable. The data from Table 1-3 are graphed in black in Figure 1-15. The line in blue, drawn as close to all the data points as possible, is called a line of best fit. The line of best fit is a better model for predictions than any one point that helps determine the line. The problem-solving strategy on the next page gives detailed instruc-tions for graphing data and sketching a line of best fit.
35 30 25 20 15 10 5 0 13.5 14.0 14.5 15.0 15.5 16.0 16.5
Length (cm)
Mass (g)
Length of a Spring for Different Masses ■Figure 1-15 The independent variable, mass, is on the horizontal axis. The graph shows that the length of the spring increases as the mass suspended from the spring increases.
Linear Relationships
Scatter plots of data may take many different shapes, suggest-ing different relationships. (The line of best fit may be called a curve of best fit for nonlinear graphs.) Three of the most common relationships will be shown in this section. You probably are familiar with them from math class.
When the line of best fit is a straight line, as in Figure 1-15, the dependent variable varies linearly with the independent variable.
There is a linear relationship between the two variables. The
relationship can be written as an equation.
Find the y-intercept, b, and the slope, m, as illustrated in Figure 1-16. Use points on the line—they may or may not be data points.
Linear Relationship Between Two Variables ymxb
35 5 10 15 20 25 30 0
17.0
14.0 15.0 16.0
Lengt
h
(
cm
)
Mass (g)
b 13.7 run
rise
Length of a Spring for Different Masses ■Figure 1-16 To find an equation of the line of best fit for a linear relationship, find the slope and y-intercept.
16 Chapter 1 A Physics Toolkit
Plotting Line Graphs
Use the following steps to plot line graphs from data tables.
1. Identify the independent and dependent variables in your data. The independent variable is plotted on the horizontal axis, the
x-axis. The dependent variable is plotted on the vertical axis, the y-axis.
2. Determine the range of the independent variable to be plotted.
3. Decide whether the origin (0, 0) is a valid data point.
4. Spread the data out as much as possible. Let each division on the graph paper stand for a convenient unit. This usually means units that are multiples of 2, 5, or 10.
5. Number and label the horizontal axis. The label should include the units, such as Mass (grams).
6. Repeat steps 2–5 for the dependent variable.
7. Plot the data points on the graph.
8. Draw the best-fit straight line or smooth curve that passes through as many data points as possible. This is sometimes called eyeballing. Do not use a series of straight line segments that connect the dots. The line that looks like the best fit to you may not be exactly the same as someone else’s. There is a formal procedure, which many graphing calculators use, called the least-squares technique, that produces a unique best-fit line, but that is beyond the scope of this textbook.
9. Give the graph a title that clearly tells what the graph represents.
Math Handbook
Graphs of Relations pages 848—852
The slope is the ratio of the vertical change to the hor-izontal change. To find the slope, select two points, Aand B, far apart on the line. The vertical change, or rise, y, is the difference between the vertical values of Aand B. The horizontal change, or run, x, is the difference between the horizontal values of Aand B.
In Figure 1-16: m
0.08 cm/g
If ygets smaller as xgets larger, then y/xis negative, and the line slopes downward.
The y-intercept, b, is the point at which the line crosses the y-axis, and it is the y-value when the value of xis zero. In this example, b 13.7 cm. When b0, or ymx, the quantity yis said to vary directly with x.
Nonlinear Relationships
Figure 1-17shows the distance a brass ball falls versus time. Note that the graph is not a straight line, meaning the relationship is not linear. There are many types of nonlinear relationships in science. Two of the most com-mon are the quadratic and inverse relationships.The graph in Figure 1-17 is a quadratic relationship,represented by the following equation.
A computer program or graphing calculator easily can find the values of the constants a, b, and cin this equation. In this case, the equation is d5t2. See the Math Handbook in the back of the book for more on making and using line graphs.
Quadratic Relationship Between Two Variables yax2bxc
A quadratic relationship exists when one variable depends on the square of another.
(16.0 cm14.1 cm)
(30 g5 g)
Slope m
r r u is n
e
xy
The slope of a line is equal to the rise divided by the run, which also can be expressed as the change in ydivided by the change in x.
Section 1.3 Graphing Data 17 ■Figure 1-17 This graph
indicates a quadratic, or parabolic, relationship.
An object is suspended from spring 1, and the spring’s elongation (the distance it stretches) is X1. Then the same object is removed from the first spring and suspended from a second spring. The elongation of spring 2 is X2. X2is greater than X1.
1. On the same axes, sketch the graphs of the mass versus elongation for both springs. 2. Is the origin included in the graph? Why or why not?
3. Which slope is steeper?
4. At a given mass, X21.6 X1. If X25.3 cm, what is X1?
Math Handbook
Quadratic Graphs page 852 Quadratic Equations
page 846
40 30
20 10
0 30
25
20
15
10
5
Current (A)
Resistance (ohms)
Current v. Resistance at 120 V
24. The mass values of specified volumes of pure gold nuggets are given in Table 1-4.
a. Plot mass versus volume from the values given in the table and draw the curve that best fits all points.
b. Describe the resulting curve.
c. According to the graph, what type of relationship exists between the mass of the pure gold nuggets and their volume?
d. What is the value of the slope of this graph? Include the proper units.
e. Write the equation showing mass as a function of volume for gold.
f. Write a word interpretation for the slope of the line.
18 Chapter 1 A Physics Toolkit
Table 1-4
Mass of Pure Gold Nuggets
Volume (cm3) Mass (g)
1.0 2.0 3.0 4.0 5.0
19.4 38.6 58.1 77.4 96.5 ■Figure 1-18 This graph shows
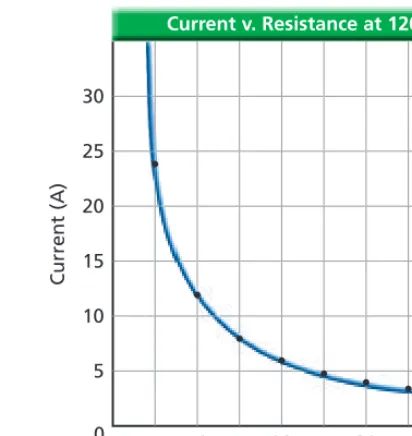
the inverse relationship between resistance and current. As resistance increases, current decreases.
The graph in Figure 1-18 shows how the current in an electric circuit varies as the resistance is increased. This is an example of an inverse relationship,represented by the following equation.
The three relationships you have learned about are a sample of the simple relations you will most likely try to derive in this course. Many other mathematical models are used. Important examples include sinu-soids, used to model cyclical phenomena, and exponential growth and decay, used to study radioactivity. Combinations of different mathematical models represent even more complex phenomena.
Inverse Relationship ya
x
[image:17.660.266.472.36.254.2]physicspp.com/self_check_quiz Section 1.3 Graphing Data 19 25. Make a Graph Graph the following data. Time is
the independent variable.
26. Interpret a Graph What would be the meaning of a nonzero y-intercept to a graph of total mass versus volume?
27. Predict Use the relation illustrated in Figure 1-16 to determine the mass required to stretch the spring 15 cm.
28. Predict Use the relation in Figure 1-18 to predict the current when the resistance is 16 ohms.
29. Critical Thinking In your own words, explain the meaning of a shallower line, or a smaller slope than the one in Figure 1-16, in the graph of stretch versus total mass for a different spring.
Time (s) 0 5 10 15 20 25 30 35
Speed (m/s) 12 10 8 6 4 2 2 2
1.3
Section Review
■Figure 1-19 Computer animators use mathematical models of the real world to create a convincing fictional world. They need to accurately portray how beings of different sizes move, how hair or clothing move with a character, and how light and shadows fall, among other physics topics.
Predicting Values
When scientists discover relations like the ones shown in the graphs in this section, they use them to make predictions. For example, the equation for the linear graph in Figure 1-16is as follows:
y(0.08 cm/g)x13.7 cm
Relations, either learned as formulas or developed from graphs, can be used to predict values you haven’t measured directly. How far would the spring in Table 1-3 stretch with 49 g of mass?
y(0.08 cm/g)(49 g)13.7 cm
18 cm
It is important to decide how far you can extrapolate from the data you have. For example, 49 kg is a value far outside the ones measured, and the spring might break rather than stretch that far.
Physicists use models to accurately predict how systems will behave: what circumstances might lead to a solar flare, how changes to a circuit will change the performance of a device, or how electromagnetic fields will affect a medical instrument. People in all walks of life use models in many
ways. One example is shown in Figure 1-19. With the tools you have
learned in this chapter, you can answer questions and produce models for the physics questions you will encounter in the rest of this textbook.
20
Exploring Objects in Motion
Physics is a science that is based upon experimental observations. Many of the basic principles used to describe and understand mechanical systems, such as objects in linear motion, can be applied later to describe more complex natural phenomena. How can you measure the speed of the vehicles in a video clip?
■Observethe motion of the vehicles seen in the video.
■Describethe motion of the vehicles.
■Collect and organize dataon the vehicle’s motion.
■Calculatea vehicle’s speed.
Internet access is required. watch or other timer
1. Visit physicspp.com/internet_labto view the Chapter 1 lab video clip.
2. The video footage was taken in the midwestern United States at approximately noon. Along the right shoulder of the road are large, white, painted rectangles. These types of markings are used in many states for aerial observation of traffic. They are placed at 0.322-km (0.2-mi) intervals.
3. Observe What type of measurements might be taken? Prepare a data table, such as the one shown on the next page. Record your observa-tions of the surroundings, other vehicles, and markings. On what color vehicle is the camera located, and what color is the pickup truck in the lane to the left?
4. Measure and Estimate View the video again and look for more details. Is the road smooth? In what direction are the vehicles heading? How long does it take each vehicle to travel two intervals marked by the white blocks? Record your observations and data.
Procedure
Materials
Safety Precautions Objectives
QUESTION
What types of measurements could be made to find the speed of a vehicle?
Benjamin Coifman
21 1. Summarize your qualitative observations.
2. Summarize your quantitative observations.
3. Make and Use Graphs Graph both sets of data on one pair of axes.
4. Estimate What is the speed of the vehicles in km/s and km/h?
5. Predict How far will each vehicle travel in 5 min?
1. Measure What is the precision of the distance and time measurements?
2. Measure What is the precision of your speed measurement? On what does it depend?
3. Use Variables, Constants, and Controls Describe the independent and the dependent variables in this experiment.
4. Compare and Contrast Which vehicle’s graph has a steeper slope? What is the slope equal to?
5. Infer What would a horizontal line mean on the graph? A line with a steeper slope?
Speed is distance traveled divided by the amount of time to travel that distance. Explain how you could design your own experiment to measure speed in the classroom using remote-controlled cars. What would you use for markers? How pre-cisely could you measure distance and time? Would the angle at which you measured the cars passing the markers affect the results? How much? How could you improve your measure-ments? What units make sense for speed? How far into the future could you predict the cars’ posi-tions? If possible, carry out the experiment and summarize your results.
When the speedometer is observed by a front-seat passenger, the driver, and a passenger in the rear driver’s-side seat, readings of 90 km/h, 100 km/h, and 110 km/h, respectively, are observed. Explain the differences.
Real-World Physics
Going Further Conclude and Apply Analyze
To find out more about measurement, visit the Web site: physicspp.com
Data Table
Marker Distance (km) White Vehicle Time (s)
Gray Pickup Time (s)
Design an Experiment Visit physicspp.com/ internet_labto post your experiment for measuring speed in the classroom using remote-controlled cars. Include your list of materials, your procedure, and your predic-tions for the accuracy of your lab. If you actually perform your lab, post your data and results as well.
22 Future Technology
Computer History and Growth
Computer History and Growth
Each pixel
of the animations or movies you watch, and each letter of the instant messages you send presents your computer with several hundred equations. Each equation must be solved in a few billionths of a second—if it takes a bit longer, you might complain that your computer is slow.Early Computers
The earliest computers could solve very complex arrays of equations, just as yours can, but it took them a lot longer to do so. There were several reasons for this. First, the mathematics of algorithms (problem-solving strategies) still was new. Computer sci-entists were only beginning to learn how to arrange a particular problem, such as the con-version of a picture into an easily-transmittable form, so that it could be solved by a machine.UNIVAC 1, an early computer, filled an entire room.
1. Research A compression protocol makes a computer file smaller and less prone to transmission errors. Look up the terms .jpg, .mp3, .mpeg,and .midi
and see how they apply to the activities you do on your computer.
2. Calculate Using the example here, how long does it take for a binary number to travel 15 m? How many such operations could there be each second?
Going
Further
Machine Size
Second, the machines were physically large. Computers work by switching patterns of electric currents that represent binary numbers. A 16-bit machine works with binary numbers that are 16 bits long. If a 64-bit num-ber must be dealt with, the machine must repeat the same operation four times. A 32-bit machine would have to repeat the operation only twice, thus making it that much faster. But a 32-bit machine is four times the size of a 16-bit machine; that is, it has four times as many wires and transistor switches, and even 8-bit machines were the size of the old UNIVAC shown above.Moreover, current travels along wires at speeds no greater than about two-thirds the speed of light. This is a long time if the com-puter wires are 15 m long and must move information in less than 109s.
Memory
Third, electronic memories were extremely expensive. You may know that a larger memory lets your computer work faster. When one byte of memory required eight circuit boards, 1024 bytes (or 1 K) of memory was enormous. Because memory was so precious, computer programs had to be written with great cleverness. Astronants got to the Moon with 64 K of memory in Apollo’son-board computers.When Gordon Moore and others invented the integrated circuit around 1960, the size and cost of computer circuitry dropped drastically. Physically smaller, and thus faster, machines could be built and very large memories became possible. Today, the transistors on a chip are now smaller than bacteria.
The cost and size of computers have dropped so much that your cell phone has far more computing power than most big office machines of the 1970s.
Processor chips used in today’s computers are tiny compared to the old computer systems.
CORBIS
1.1 Mathematics and Physics
Vocabulary
• physics (p. 3)
• dimensional analysis
(p. 6)
• significant digits (p. 7)
• scientific method (p. 8)
• hypothesis (p. 8)
• scientific law (p. 9)
• scientific theory (p. 10)
1.2 Measurement
Vocabulary
• measurement (p. 11)
• precision (p. 12)
• accuracy (p. 13)
1.3 Graphing Data
Vocabulary
• independent variable
(p. 15)
• dependent variable
(p. 15)
• line of best fit (p. 15)
• linear relationship (p. 16)
• quadratic relationship
(p. 17)
• inverse relationship
(p. 18)
Key Concepts
•
Physics is the study of matter and energy and their relationships.•
Dimensional analysis is used to check that an answer will be in the correct units.•
The result of any mathematical operation with measurements never can be more precise than the least-precise measurement involved in the operation.•
The scientific method is a systematic method of observing, experimenting, and analyzing to answer questions about the natural world.•
Scientific ideas change in response to new data.•
Scientific laws and theories are well-established descriptions and explanations of nature.Key Concepts
•
New scientific findings must be reproducible; that is, others must be able to measure and find the same results.•
All measurements are subject to some uncertainty.•
Precision is the degree of exactness with which a quantity is measured. Scientific notation shows how precise a measurement is.•
Accuracy is the extent to which a measurement matches the true value.Key Concepts
•
Data are plotted in graphical form to show the relationship between two variables.•
The line that best passes through or near graphed data is called the line of best fit. It is used to describe the data and to predict where new data would lie on the graph.•
A graph in which data points lie on a straight line is a graph of a linear relationship. In the equation, mand bare constants.•
The slope of a straight-line graph is the vertical change (rise) divided by the horizontal change (run) and often has a physical meaning.•
The graph of a quadratic relationship is a parabolic curve. It is represented by the equation below. The constants a, b, and ccan be found with a computer or a graphing calculator; simpler ones can be found using algebra.•
The graph of an inverse relationship between xand yis a hyperbolic curve. It is represented by the equation below, where ais a constant.yax
yax2bxc
mrruisne xy
ymxb
23
physicspp.com/vocabulary_puzzlemaker
30. Complete the following concept map using the following terms: hypothesis, graph, mathematical model, dependent variable, measurement.
Mastering Concepts
31. Describe a scientific method. (1.1)32. Why is mathematics important to science? (1.1) 33. What is the SI system? (1.1)
34. How are base units and derived units related? (1.1) 35. Suppose your lab partner recorded a measurement
as 100 g. (1.1)
a.Why is it difficult to tell the number of significant digits in this measurement?
b.How can the number of significant digits in such a number be made clear?
36. Give the name for each of the following multiples of the meter. (1.1)
a. 1
1
00m b. 10 1
00m c. 1000 m 37. To convert 1.8 h to minutes, by what conversion
factor should you multiply? (1.1)
38. Solve each problem. Give the correct number of significant digits in the answers. (1.1)
a.4.667104g + 3.02105g
b.(1.70102J) ÷ (5.922104cm3)
39. What determines the precision of a measurement?
(1.2)
40. How does the last digit differ from the other digits in a measurement? (1.2)
41.A car’s odometer measures the distance from home to school as 3.9 km. Using string on a map, you find the distance to be 4.2 km. Which answer do you think is more accurate? What does accurate
mean? (1.2)
42. How do you find the slope of a linear graph? (1.3) 43. For a driver, the time between seeing a stoplight and
stepping on the brakes is called reaction time. The distance traveled during this time is the reaction distance. Reaction distance for a given driver and vehicle depends linearly on speed. (1.3)
a.Would the graph of reaction distance versus speed have a positive or a negative slope?
b.A driver who is distracted has a longer reaction time than a driver who is not. Would the graph of reaction distance versus speed for a distracted driver have a larger or smaller slope than for a normal driver? Explain.
44. During a laboratory experiment, the temperature of the gas in a balloon is varied and the volume of the balloon is measured. Which quantity is the independent variable? Which quantity is the dependent variable? (1.3)
45. What type of relationship is shown in Figure 1-20?
Give the general equation for this type of relation.
(1.3)
46. Given the equation Fmv2/R, what relationship
exists between each of the following? (1.3)
a.Fand R
b.Fand m
c.Fand v
x y
Concept Mapping
24 Chapter 1 A Physics Toolkit For more problems, go to Additional Problems, Appendix B. experiment
independent variable
physicspp.com/chapter_test
Applying Concepts
47. Figure 1-21gives the height above the ground of a ball that is thrown upward from the roof of a building, for the first 1.5 s of its trajectory. What is the ball’s height at t0? Predict the ball’s height at t2 s and at t5 s.
48. Is a scientific method one set of clearly defined steps? Support your answer.
49. Explain the difference between a scientific theory and a scientific law.
50. Density The density of a substance is its mass per unit volume.
a.Give a possible metric unit for density.
b.Is the unit for density a base unit or a derived unit?
51. What metric unit would you use to measure each of the following?
a.the width of your hand
b.the thickness of a book cover
c.the height of your classroom
d.the distance from your home to your classroom
52. Size Make a chart of sizes of objects. Lengths should range from less than 1 mm to several kilometers. Samples might include the size of a cell, the distance light travels in 1 s, and the height of a room.
53. Time Make a chart of time intervals. Sample intervals might include the time between heartbeats, the time between presidential elections, the average lifetime of a human, and the age of the United States. Find as many very short and very long examples as you can.
54. Speed of Light Two students measure the speed of light. One obtains (3.0010.001)108m/s;
the other obtains (2.999 0.006)108m/s.
a.Which is more precise?
b.Which is more accurate? (You can find the speed of light in the back of this textbook.)
55. You measure the dimensions of a desk as 132 cm, 83 cm, and 76 cm. The sum of these measures is 291 cm, while the product is 8.3105cm3. Explain how the significant digits were determined in each case.
56. Money Suppose you receive $5.00 at the beginning of a week and spend $1.00 each day for lunch. You prepare a graph of the amount you have left at the end of each day for one week. Would the slope of this graph be positive, zero, or negative? Why?
57. Data are plotted on a graph, and the value on the
y-axis is the same for each value of the independent variable. What is the slope? Why? How does y
depend on x?
58. Driving The graph of braking distance versus car speed is part of a parabola. Thus, the equation is written dav2bvc. The distance, d, has units in meters, and velocity, v, has units in meters/second. How could you find the units of a, b, and c? What would they be?
59. How long is the leaf in Figure 1-22?Include the uncertainty in your measurement.
60. The masses of two metal blocks are measured. Block A has a mass of 8.45 g and block B has a mass of 45.87 g.
a.How many significant digits are expressed in these measurements?
b.What is the total mass of block A plus block B?
c.What is the number of significant digits for the total mass?
d.Why is the number of significant digits different for the total mass and the individual masses?
61. History Aristotle said that the speed of a falling object varies inversely with the density of the medium through which it falls.
a.According to Aristotle, would a rock fall faster in water (density 1000 kg/m3), or in air (density
1 kg/m3)?
b.How fast would a rock fall in a vacuum? Based on this, why would Aristotle say that there could be no such thing as a vacuum?
4
1 2 3
0 25
20
15
10
5
Height (m)
Time (s)
Height of Ball v. Time
Chapter 1 Assessment 25 ■Figure 1-21
■Figure 1-22
Laura Sifferlin
62. Explain the difference between a hypothesis and a scientific theory.
63. Give an example of a scientific law.
64. What reason might the ancient Greeks have had not to question the hypothesis that heavier objects fall faster than lighter objects? Hint: Did you ever question which falls faster?
65. Mars Explain what observations led to changes in scientists’ ideas about the surface of Mars.
66. A graduated cylinder is marked every mL. How precise a measurement can you make with this instrument?
Mastering Problems
1.1 Mathematics and Physics
67. Convert each of the following measurements to meters.
a.42.3 cm
b.6.2 pm
c.21 km
d.0.023 mm
e.214 m
f.57 nm
68. Add or subtract as indicated.
a.5.80109s3.20108s
b.4.87106m 1.93106m
c.3.14105kg 9.36105kg
d.8.12107g6.20106g
69. Rank the following mass measurements from least to greatest: 11.6 mg, 1021 g, 0.000006 kg, 0.31 mg.
70. State the number of significant digits in each of the following measurements.
a.0.00003 m
b.64.01 fm
c.80.001 m
d.0.720 g
e.2.40106kg
f.6108kg
g.4.071016m
71. Add or subtract as indicated.
a.16.2 m5.008 m 13.48 m
b.5.006 m 12.0077 m 8.0084 m
c.78.05 cm232.046 cm2
d.15.07 kg12.0 kg
72. Multiply or divide as indicated.
a.(6.21018m)(4.71010m)
b.(5.6107m)/(2.81012s)
c.(8.1104km)(1.6103km)
d.(6.5105kg)/(3.4103m3)
73. Gravity The force due to gravity is Fmgwhere
g9.80 m/s2.
a.Find the force due to gravity on a 41.63-kg object.
b.The force due to gravity on an object is 632 kgm/s2.
What is its mass?
74. Dimensional Analysis Pressure is measured in pascals, where 1 Pa1 kg/ms2. Will the following
expression give a pressure in the correct units?
1.2 Measurement
75. A water tank has a mass of 3.64 kg when it is empty and a mass of 51.8 kg when it is filled to a certain level. What is the mass of the water in the tank?
76. The length of a room is 16.40 m, its width is 4.5 m, and its height is 3.26 m. What volume does the room enclose?
77. The sides of a quadrangular plot of land are 132.68 m, 48.3 m, 132.736 m, and 48.37 m. What is the perimeter of the plot?
78. How precise a measurement could you make with the scale shown in Figure 1-23?
79. Give the measure shown on the meter in Figure 1-24
as precisely as you can. Include the uncertainty in your answer.
0 1
2 3
4
5A
A
CLASS A
(0.55 kg)(2.1 m/s)
9.8 m/s2
26 Chapter 1 A Physics Toolkit For more problems, go to Additional Problems, Appendix B.
■Figure 1-24 ■Figure 1-23
Horizons Companies
physicspp.com/chapter_test 80. Estimate the height of the nearest door frame in
centimeters. Then measure it. How accurate was your estimate? How precise was your estimate? How precise was your measurement? Why are the two precisions different?
81. Base Units Give six examples of quantities you might measure in a physics lab. Include the units you would use.
82. Temperature The temperature drops from 24°C to 10°C in 12 hours.
a.Find the average temperature change per hour.
b.Predict the temperature in 2 more hours if the trend continues.
c.Could you accurately predict the temperature in 24 hours?
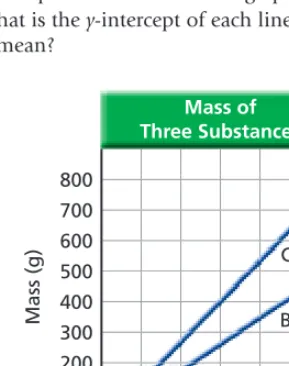
1.3 Graphing Data
83. Figure 1-25shows the masses of three substances for volumes between 0 and 60 cm3.
a.What is the mass of 30 cm3of each substance?
b.If you had 100 g of each substance, what would be their volumes?
c.In one or two sentences, describe the meaning of the slopes of the lines in this graph.
d.What is the y-intercept of each line? What does it mean?
84. During a class demonstration, a physics instructor placed a mass on a horizontal table that was nearly frictionless. The instructor then applied various horizontal forces to the mass and measured the distance it traveled in 5 seconds for each force applied. The results of the experiment are shown in Table 1-5.
a.Plot the values given in the table and draw the curve that best fits all points.
b.Describe the resulting curve.
c.Use the graph to write an equation relating the distance to the force.
d.What is the constant in the equation? Find its units.
e.Predict the distance traveled when a 22.0-N force is exerted on the object for 5 s.
85. The physics instructor from the previous problem changed the procedure. The mass was varied while the force was kept constant. Time and distance were measured, and the acceleration of each mass was calculated. The results of the experiment are shown in Table 1-6.
a.Plot the values given in the table and draw the curve that best fits all points.
b.Describe the resulting curve.
c.According to the graph, what is the relationship between mass and the acceleration produced by a constant force?
d.Write the equation relating acceleration to mass given by the data in the graph.
e.Find the units of the constant in the equation.
f.Predict the acceleration of an 8.0-kg mass.
[image:26.666.131.276.431.614.2]Table 1-6
Acceleration of Different Masses
Mass (kg) Acceleration (m/s2)
1.0 2.0 3.0 4.0 5.0 6.0 12.0 5.9 4.1 3.0 2.5 2.0 Table 1-5
Distance Traveled with Different Forces
Force (N) Distance (cm)
5.0 10.0 15.0 20.0 25.0 30.0 24 49 75 99 120 145 A B C 50 20 40 10 30 0 800 700 600 500 400 300 200 100 Mass (g)
Volume (cm3) Mass of Three Substances
Chapter 1 Assessment 27 ■Figure 1-25