ISSN 2319-7625 (Online) (An International Research Journal), www.chemistry-journal.org
Adsorption Studies of Methylene Blue Dye using Biosorbents
Saravanan Narayanan1 and Rathika Govindasamy2*
1Department of Chemistry,
Nandha Engineering College, Erode 638052, Tamil Nadu, INDIA. 2*Department of Chemistry,
PSG College of Arts and Science, Coimbatore 641014, Tamil Nadu, INDIA. email: [email protected],[email protected]
(Received on: February 10, 2018)
ABSTRACT
The aim of this study was to scrutinize the removal of methylene blue from synthetic wastewater by the biosorption on biosorbents. The operation parameters investigated including initial dye concentrations, adsorbent dosage, temperature, contact time and pH (2-12). The experimental isotherms data were examined using Freundlich, Langmuir and isotherm models. The data was discovered that Langmuir isotherm model suits the data very well for methylene blue dye on biosorbents. The pseudo-first order, pseudo-second order kinetic model and intraparticle diffusion model were used to inspect the experimental data of different initial concentrations. It was found that the pseudo-second order kinetic model outlined the data of methylene blue dye biosorption on adsorbents very well.
Keywords: Copper pod, Dye, Adsorption, Isotherm, and Kinetic.
1. INTRODUCTION
one of the major affairs in wastewater pollution. This is because many industries use dyes to colour their products, such as textiles, paper, plastics, leather, rubber, cosmetics, food and minerals. These dyes are without exception left in the industrial wastes (Gupta, et al., 2011; Jayaranjan, et al., 2011). Since they have a synthetic origin and complex aromatic molecular structures, which make them inert and difficult to biodegrade when freed into streams, people overlook their undesirable nature. The presence of very low concentrations of dyes in effluent is highly detectable and undesirable (Theivarasu, et al., 2011; Gupta, et al., 1997). Furthermore, some dyes and their degradation products may be carcinogens and toxic and consequently, they are important sources of water pollutions and their treatment and now they have become a major problem for environmental managers. There are differing standard conventional methods of removing dyes including coagulation and flocculation, oxidation or ozonation and membrane separation (Wang, et al., 2005; Velmurugan, et al., 2011). Neverthless, these methods are not widely used due to their high cost and economic drawback. Chemical and electrochemical oxidations, coagulation are generally not realistic on large scale industries. In contrast, an adsorption technique is by far, the most adaptable and widely used. The most common adsorbent materials are: alumina silica, metal hydroxides and activated carbon (Jain, et al., 2003; Namasivayam, et al., 1996). As demonstrated by many researchers, separation of dyes by activated carbon is economically appropriate and technically easier (Yavuz & Aydin, 2006; Gupta, et al., 2004). Activated carbon is widely used as an adsorbent due to its high adsorption capacity, high surface area, microporous structure, and high degree of surface correspondingly.
The main purpose of this work was to study the removal of methylene blue dyes from synthetic wastewater by adsorption technique in batch process.
2. MATERIALS AND METHODS
2.1. Preparation of adsorbents
The copper pod flowers were cleansed thoroughly with ordinary tap water to remove any dust and washed twice with distilled water. The washed materials were dried out in sun light to evaporate the moisture present in it. The dried material was crushed into fine powder and then sieved with a particle size of 53𝜇𝑚. The sieved adsorbent sample prepared was kept in an airtight container and used for additional adsorption studies.
2.2. Preparation of Adsorbate
2.3. Adsorption studies
Adsorption investigations were executed by the batch technique to obtain rate and equilibrium data. Batch adsorption experiments were conducted out to investigate the effect of initial dye concentration, contact time, pH, carbon dosage and temperature on the adsorption of methylene blue on copper pod flower. The experiments were administered out in 150ml conical flasks by mixing a pre-weighed amount of adsorbent with 50ml of methylene blue dye solution. The adsorbent dosages were examined from 0.1 – 1g/L. The isotherm survey was supervised at different temperature from 30 to 60οC with the initial dye concentrations of 10 to 50mg/l. The kinetic study was done by varying time from 0 to 100min. The effect of pH was perceived by studying the adsorption of dye over a pH range of 2 – 12. The pH of the dye solution was modified with 0.1N HCl or 0.1N NaOH solution by using a pH meter (EUTECH Instrument, pH 510).The equilibrium adsorption capacity was quantified using the following equation,
𝑞𝑒=
(𝐶0−𝐶𝑒)𝑉
𝑀 (1)
where, 𝑞𝑒 is the equilibrium adsorption capacity (mg/g), 𝐶0 and 𝐶𝑒 are the initial and
equilibrium concentrations(mg/L) of dye solution. V is the volume of dye solution (mL) and M is the weight of adsorbent (g).
3. RESULTS AND DISCUSSION
3.1. Effect of contact time and initial dye concentration
The results procured indicate that the percentage of dye removal increased with contact time promptly and became constant when equilibrium was accomplished (Zhang, et al., 2008; Ranganathan, et al., 2007). The percentage of dye removal increased with increase in initial dye concentration. It was established that the percentage of dye removal dependent on the concentration of the dye.
3.2. Effect of adsorbent dosage
The result recommends that increased adsorbent dosages rised the percentage removal of dye (Rajeshkannan, et al., 2008; Sarioglu & Atay, 2006). Higher dosage of adsorbent enriched the adsorption due to more surface area and functional groups are obtainable on the adsorbent.
3.3. Effect of pH
3.4. Effect of Temperature
The adsorption capacities of methylene blue dye reduced with the incremental temperature from 30 to 60οC for 40mgs/lit. It is because higher temperature may drop the adsorptive forces between the dye molecules and functional sites on the adsorbent (Vadivelan & Kumar, 2005; Shahbudeen & Syed, 2011). The maximum percentage removal of dye was held at 30οC. Therefore, adsorption procedure is exothermic in nature.
3.5. Analysis of adsorption Kinetics
The analysis of adsorption kinetics is a prime characteristic in describing the effectiveness of adsorption process (Gupta, et al., 2004; Hameed et al., 2006).
3.5.1. Pseudo-first order equation
The pseudo- first order equation of lagergen is indicated as follows.
log(𝑞𝑒− 𝑞𝑡) = log 𝑞𝑒− 𝑘1𝑡
2.303 (1)
Where, 𝑞𝑒 is the amount of dye removed at equilibrium (mg/g) 𝑞𝑡 is the amount of dye removed at time t (mg/g)
𝑘1 is the pseudo- first order rate constant (min-1)
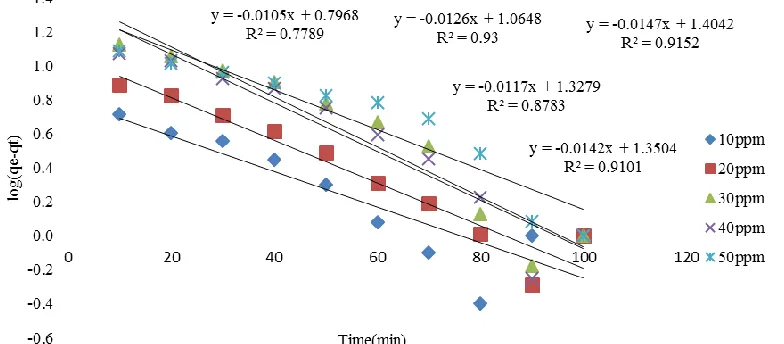
The values of 𝑘1 and calculated 𝑞𝑒 were determined from the slope and intercept of the linear
plot of log(𝑞𝑒− 𝑞𝑡) versus time (t) gives a linear relationship as shown in figure.1. The
pseudo first order rate constant (𝑘1), correlation coefficients (R2), experimental 𝑞𝑒 values and
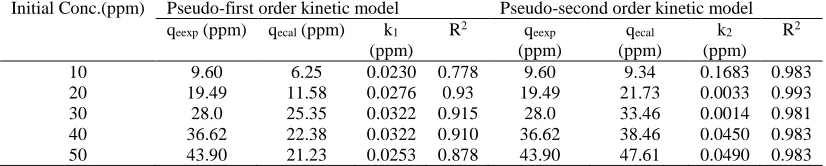
calculated 𝑞𝑒 values are presented in table.1. Values of k1 for dismissal of methylene blue dye by copper pod flower were 0.0230, 0.0276, 0.0322, 0.0322 and 0.0253.Values of correlation coefficients (R2) together with the large divergence between calculated 𝑞
𝑒 values and the
experimental 𝑞𝑒 values indicated that the adsorption of methylene blue dye on copper pod
flower not obeys the pseudo first order reaction (Gong, et al., 2006; Grag et al.,2004).
3.5.2 Pseudo-second order equation
The pseudo second order equation is revealed as follows.
𝑡 𝑞𝑡=
1 𝑘2𝑞𝑒2+
𝑡
𝑞𝑒 (2)
Where, 𝑞𝑒 is the amount of dye removed at equilibrium (mg/g)
𝑞𝑡 is the amount of dye removed at time t (mg/g)
𝑘2 is the pseudo- second order rate constant (min-1)
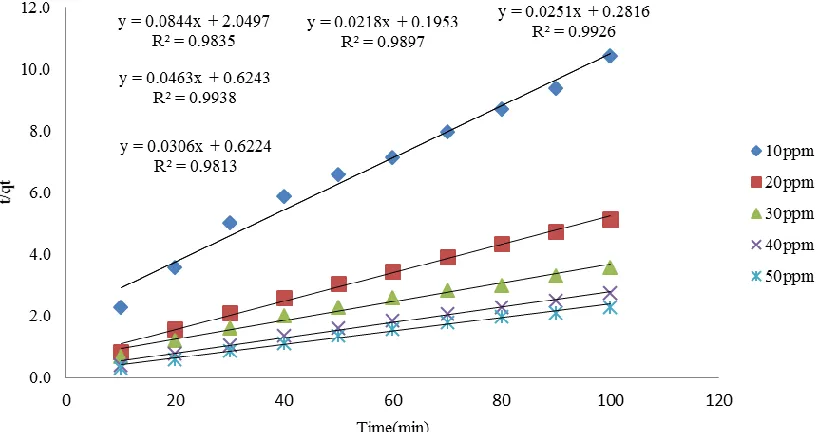
The figure.2 shows differing initial dye concentration of pseudo second order kinetic model. 𝑘2 and 𝑞𝑒 values can be governed from the slope and intercept of the plot of
𝑡 𝑞𝑡versus
t. The results are given in in table.1. From the table 1, it was observed that R2 values for the pseudo second order kinetic model is higher (R2 = 0.981 – 0.993) than that of the pseudo first order kinetic model (R2 = 0.778 – 0.930) for all initial dye concentrations. The calculated 𝑞
𝑒
values obtained from the pseudo second order kinetics model are good agreement with the experimental 𝑞𝑒 values (Gupta, et al., 2004; Hameed et al., 2006). Values of k2 for dissimilation of methylene blue dye by copper pod flower were 0.1683,0.0033,0.0014,0.0450 and 0.0490.This shows that the adsorption of methylene blue dye on copper pod flower is well suitable for the pseudo second order kinetic model with compared to the pseudo first order kinetic model. It also proposes that chemisorption process could be the rate limiting step in the adsorption process.
Table 1: Pseudo first and pseudo second order kinetic parameters for different initial dye concentration
Initial Conc.(ppm) Pseudo-first order kinetic model Pseudo-second order kinetic model qeexp (ppm) qecal (ppm) k1
(ppm)
R2 q
eexp
(ppm)
qecal
(ppm)
k2
(ppm) R2
10 9.60 6.25 0.0230 0.778 9.60 9.34 0.1683 0.983 20 19.49 11.58 0.0276 0.93 19.49 21.73 0.0033 0.993 30 28.0 25.35 0.0322 0.915 28.0 33.46 0.0014 0.981 40 36.62 22.38 0.0322 0.910 36.62 38.46 0.0450 0.983 50 43.90 21.23 0.0253 0.878 43.90 47.61 0.0490 0.983
3.5.3 Intra particle diffusion studies
The Intraparticle diffusion model is used for confirming the mechanism of the adsorption process. Intraparticle diffusion (kd) given by weber morris and is indicated as follows
𝑞𝑡= 𝑘𝑑𝑡1/2 (3)
Where, 𝑞𝑡 is the amount adsorbed (mgg-1) at time t (min).
𝑘𝑑 is the rate constant of intraparticle diffusion(mgg-1min1/2).
The plot of amount adsorbed (qt) versus time gives straight line and is shown in figure.3.The rate constant of intraparticle diffusion (𝑘𝑑) can be determined from slope of the
straight line and the values are listed in table.2.The linear segment of the plot at each concentration did not pass through the origin suggesting that intraparticle diffusion was not the only rate controlling step (Vadivelan & Kumar, 2005; Shahbudeen & Syed, 2011).The high correlation coefficient (R2) values (R2 = 0.963 – 0.993) acquired at each concentration indicated that the pore diffusion plays a significant role for the adsorption of methylene blue dye onto the activated carbon prepared from copper pod flower.
Table 2: Intra Particle Diffusion model
Initial Concentration (ppm) Intra Particle Diffusion model C Kd (mg/g.min) R2
10 1.838 0.810 0.987
20 7.944 1.177 0.993
30 7.602 2.054 0.993
40 18.11 1.858 0.990
50 25.46 1.728 0.963
3.6. Adsorption isotherm
The adsorption isotherm traces the mechanism of the adsorption process between the adsorbate and the adsorb. The Langmuir and Freundlich isotherm were looked over to study the adsorption isotherm of dye.
3.6.1. Langmuir isotherm
The langmuir isotherm equation is revealed as follows. 𝐶𝑒
𝑞𝑒= 1 𝑄0𝑏+
𝐶𝑒
𝑄0 (6)
Where, 𝑞𝑒 is the amount of dye assimilated at equilibrium (mgg-1) 𝐶𝑒 is the concentration of dye solution at equilibrium (mgL-1)
𝑄0 is Langmuir constant related to adsorption capacity (mgg-1)
b is Langmuir constant related to rate of adsorption(Lmg-1)
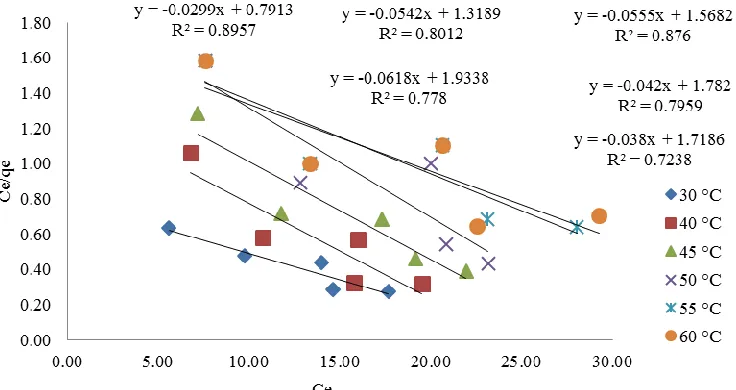
Values of 𝑄0 and b were calculated respectively from the slope and the obstruction
of the plot of 𝐶𝑒
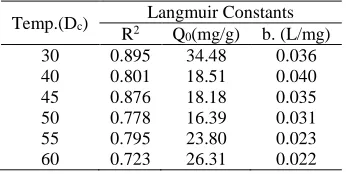
𝑞𝑒 versus 𝐶𝑒 gives a straight line and is shown in figure.5.Langmuir parameters
and correlation coefficient (R2) values were concluded in table.4.
Table 4: Langmuir isotherm parameters
Temp.(Dc) Langmuir Constants
R2 Q
0(mg/g) b. (L/mg)
30 0.895 34.48 0.036 40 0.801 18.51 0.040 45 0.876 18.18 0.035 50 0.778 16.39 0.031 55 0.795 23.80 0.023 60 0.723 26.31 0.022
From table 4. the Langmuir maximum adsorption capacity 𝑄0 are 34.48, 18.51, 18.18,
16.39, 23.80 and 26.31(mg/g) at 30,40,45,50,55 and 60οC respectively. The secured results from Langmuir isotherm indicate the exothermic nature process involved in the system. Table 4. clearly showed that lack of fit the data for Langmuir isotherm model(Rahman, et al., 2005; Ponnuchami, et al., 2007).
The essential characteristics of Langmuir isotherm equation can be conveyed in terms of dimensionless separation factor, RL, which is defined by the following equation.
𝑅𝐿= 1 1 + 𝑏𝑐0
Where C0 is the initial concentration of dye solution (mgL-1) and b is the Langmuir constant. The value of RL indicates that the type of the isotherm to be either linear (RL =1), favourable (0<RL<1), unfavourable (RL>1), or irreversible (RL=0). RL values for the present experiment data fall between 0 and 1, which clearly indicates the adsorption of methylene blue dye on activated carbon was commendary.
Table 5: RL values at various initial dye concentrations
Initial Dye RL Value
Concentration (ppm) 300C 400C 450C 500C 550C 600C
10 0.7317 0.7093 0.7403 0.7601 0.8092 0.8788 20 0.5769 0.5496 0.5877 0.6130 0.6796 0.6933 30 0.4762 0.4486 0.4872 0.5136 0.5858 0.6011 40 0.4054 0.3789 0.4161 0.4420 0.5147 0.5305 50 0.3529 0.3280 0.3631 0.3879 0.4590 0.4748
3.6.2. Freundlich Isotherm
The Freundlich isotherm equation was given by
𝑙𝑜𝑔 𝑞𝑒= 𝑙𝑜𝑔𝑘𝑓+ ( 1
𝑛)log𝐶𝑒 (7)
Where, 𝑞𝑒 is the amount of dye adsorbed (mg g-1) 𝐶𝑒 is the concentration of dye solution at equilibrium (mgL-1)
𝑘𝑓 is Freundlich constant related to the adsorption capacity of adsorbent
n is Freundlich constant related to the adsorption intensity
𝑘𝑓 and n values can be evaluated from the slope of the straight line which is shown in
Figure 6: Freundlich isotherm for the adsorption of methylene blue onto prepared activated carbon.
Table 6: Freundlich isotherm parameters
Temp.(0 0C) Statistical Parameters / Constants
R2 n K
f (mg/L)
300C 0.965 0.5851 2.264
400C 0.944 0.4821 8.072
450C 0.976 0.5055 8.790
500C 0.919 0.5136 10.864
550C 0.963 0.6112 5.714
600C 0.956 0.6277 5.105
the Freundlich isotherm model (R2= 0.919 to 0.976) compared to the Langmuir isotherm model. This demontrates that the adsorption of methylene blue dye on copper pod flower takes place as multilayer adsorption on the adsorbent surface (Wang, et al., 2005; Velmurugan, et al., 2011).
4. CONCLUSION
The adsorption of methylene blue dye from aqueous solution using copper pod flower as the low-cost adsorbent was enquired in batch process. The adsorption process was contact time, adsorbent dosage, pH, and initial metal ion concentration dependent. The equilibrium adsorption isotherm data was best portrayed by Freundlich isotherm model better than Langmuir isotherm model. From the kinetic data, it was established that adsorption of methylene blue dye using activated carbon is explained well by pseudo-second order kinetic model. Kinetic data results indicate that intraparticle diffusion is not only the rate limiting step of the adsorption process. RL values indicate beneficial adsorption process. From the experimental outcomes it was observed that the optimum pH was found to be pH = 7. Kinetic and equilibrium data revealed that dye removal by the studied adsorbents proceeded through physical adsorption and chemical adsorption mechanisms. Finally, the outcomes clearly demonstrates that copper pod flower could be used as an alternative to highly efficient low cost and abundant materials for removal of methylene blue dye from contaminated aqueous solutions.
ACKNOWLEDGMENT
Authors are thankful to principal PSG College of Arts and Science, Coimbatore, Tamil Nadu, India for providing laboratory facilities. I also thank all the faculty members for their help during the project.
REFERENCES
1. Gong R., Jin Y., Chen F., and Chen J., Enhanced malachite green removal from aqueous solution by citric acid modified rice straw, J. Hazard. Mater., 137: pp 865 – 870 (2006). 2. Grag V. K., Raksh Kumar., and Renuka Gupta., Removal of malachite green dye from
aqueous solution by adsorption using agroindustries waste, A case study of phosopisceneria. Dyes and Pigments., 62: pp 1 – 10 (2004).
3. Gupta N., Kushwaha A.K., and Chattopadhyaya M.C., Kinetics and thermodynamics of malachite green adsorption on banana pseudo-stem fibers, J.Chem. Pharm. Res., 3: pp 284–296 (2011).
5. Gupta V.K., Mittal A., Krishnan L., and Gajbe., V., Adsorption kinetics and column operations for the removal and recovery of malachite green from wastewater using bottom ash. Separa. Puri. Technol. 40: pp 87–96 (2004).
6. Hameed B.H., Ahmad A.L., and Latiff K. N.A., Adsorption of basic dye (methylene blue) onto activated carbon prepared from rattan sawdust, Dyes and Pigments., 75: pp 143-149 (2006). 7. Jain A.K., Gupta V.K., and Bhatnagar A et al., Utilization of industrial waste products as
adsorbents for the removal of dyes, J. Hazard Mater., B101: pp 31-42 (2003).
8. Jayaranjan M., Arunachalam R., and Annadurai G., Use of low cost nano – porous materials of pamelo fruit peel wastes in removal of textile dye, Research Journal of Environmental Sciences., 55: pp 434 – 443 (2011).
9. Khalid N., and Ahmad S., Removal of mercury from aqueous solutions by adsorption to rice husks, Separation Science and Technology., 34(16): pp 3139-3153 (1999).
10. Namasivayam C., and Kanchana N., Removal of Congo red from aqueous solution by waste banana pith, Pertanika J. Sci. & Techno.,1(1): pp 33-42 (1993).
11. Namasivayam C., Muniasamy N., Gayatri K., Rani M., and Ranganathan K., Removal of dyes from aqueous solution by cellulosic waste orange peel, Bioresource Technology., pp 37-43 (1996).
12. Papita Saha., Assessmant on the removal of methylene blue dye using tamarind fruit shell as biosorbent, Springer Science + Business Media., 213: pp 287-299 (2010).
13. Ponnusami V., Kritika V., Madhuram R., and Srivastava S. N., Biosorption of reactive dye using acid – treated rice husk, J Hazard Mater., 142: pp 397 – 403 (2007).
14. Praveen Sharma et al., COD reduction and colour removal of simulated textile mill wastewater by mixed bacterial consortium, Rasayan. J. Chem., 3: pp 731-735 (2010). 15. Rahman I. A., Saad B., Shaidan S., and SyaRizal E.S., Adsorption Characteristics of
malachite green on activated carbon derived from rice husks produced by chemical – thermal process, Bioresour. Technol., 96: pp 1578 – 1583 (2005).
16. Rajeshkannan R., Rajamahan N., and Rajasimman M., Removal of malachite green from aqueous solution by sorption on hyeilla verticllate biomass using response surface methodology, Fron. Chem. Eng. China, 3: pp 146 – 154 (2008).
17. Ranganathan K., Karunagaran K., and Sharma D.C., Recycling of wastewaters of textile dyeing industries using advanced treatment technology and cost analysis—Case studies, Resources, Conservation and Recycling., 50: pp 306–318 (2007).
18. Sarioglu M., and Atay U., Removal methylene blue by using biosolid, Global Nest Journal., 8: pp 113 -120 (2006).
19. Shahbudeen P.S., and Syed., Study of the removal malachite green from aqueous solution by using solid agriculture waste, Research Journal of Chemical Sciences., vol.1(1) (2011). 20. Tabrez A., Khan., Imran Ali., Ved Vati Singh., and Sangeeta Sharma., Studied the Utilization of Fly ash as Low-Cost Adsorbent for the Removal of Methylene Blue, Malachite Green and Rhodamine B Dyes from Textile Wastewater (2009).
22. Vadivelan V., and Kumar K.V., Equilibruim, kinetics, mechanism and process design for the sorption of methylene blue onto rice husk, J. Colloid Interf Sci., 286(1): pp 90-100 (2005).
23. Velmurugan P., Rathina Kumar V., and Dhinakaran G., Dye removal from aqueous solution using low cost adsorbent, International Journal of Environmental Sciences., 7: pp 1492-1503 (2011).
24. Wang S., Boyjoo Y., and Choueib A., A comparative study of dye removal using fly ash treated by different methods, Chemosphere., 60: pp 1401-1407 (2005).
25. Yavuz O., and Aydin H., Removal of direct dyes from aqueous solution using various adsorbents, Polish Journal of Environmental Studies., 15: pp 155-161 (2006).