Research Journal
Volume 10, No. 32, Dec. 2016, pages 40–46
DOI: 10.12913/22998624/65109 Research Article
RELIABILITY EVALUATION AS A MEANS OF INCREASING THE EFFICIENCY
OF EQUIPMENT MAINTENANCE
Vladimír Stuchlý1, Roman Poprocký1 , Małgorzata Kaczmarek2
1 University of Žilina, Faculty of Mechanical Engineering, Univerzitna 1, 010 26, Žilina, Slovakia, e-mail: vladimir. [email protected], [email protected]
2 Poznan University of Technology, Faculty of Management Engineering, Strzelecka St. 11, 60-965 Poznań Poland, e-mail: [email protected]
ABSTRACT
Quality assurance of production and the associated maintenance systems have changed a lot for recent decades and are subject to change requirements for reliability – Reli-ability and AvailReli-ability of machinery and equipment subject to the optimal mainte-nance costs. The paper deals with design options and assessment of the maintemainte-nance system intended method of reliability-oriented maintenance and maintenance costs. They use the methods of statistical and probabilistic analyzes of data on failure mode
of operation, as well as methods priori reliability. The emphasis is on cost-effective -ness evaluation.
Keywords: reliability model, centred maintenance, cost, consequences.
INTRODUCTION
In traditional maintenance approach the re-quirements on maintenance of each component were determined in accordance with its actual or assumed technical characteristics, without considering its failure consequences. The re-sulting schedules were used to all similar ob-jects without considering different consequenc-es coming from different operational contexts.
For utilization of reliability parameters in ma-chines and equipment maintenance it is necessary to answer also the questions such as:
• How the reliability parameters can be found out?
• Is there a reason for their determination? • Is there a reason to investigate components or
the whole systems?
• Which reliability parameters have the main importance for maintenance? And do they have any importance?
• How, when, where and in what extent should these reliability parameters be determined?
• How can the calculation of reliability param-eters help at creation of maintenance sys-tems?
Reliability of already operated machines and equipment (because these are in the focus of maintenance) was built in during the design and manufacture phase. Maintenance itself can not improve the built in (inherent) reliability. Then for overall quality of machines and equip-ment it should be distinguished [1].
Reliability, the decisive quality characteristic of a product:
• Design quality: ability of structure to fulfil the user requirements (also known as technical level).
• Production quality: measure of product qual-ity compliance in the moment of output check with quality prescribed in technical documen-tation.
• Utilisation quality: functional quality of a product under given working conditions.
From long-term experience in engineering it is evident that the machines reliability can be im-proved by:
• Selection of better (but more expensive) com-ponents,
• Increase of reliability of functionally linked components,
• Reducing the number of components that are functional in series (serial systems),
• By redundancy (component or total) of less reliable components,
• Running-in, avoiding the initial failures, • By protection against damaging effects
(trained operators, suitable operational condi-tions etc.).
Reliability theory studies rules of failure in objects (in general of machines an equipment) and methods of their prediction, it searches pos-sibilities of increasing reliability of objects in all stages of their designing and utilization. It deals with quantitative reliability parameters, economic and effectiveness characteristics.
In the paper procedures, solutions, reliability calculation methods and their use for maintenance are presented as they were elaborated at the Faculty of Mechanical Engineering, University of Zilina.
STATISTICAL AND PARAMETRIC
RELIABILITY OF ELEMENTS
In the reliability theory we look at failures in a mathematical-statistical way as random phenom-ena because we are not able to reliably determine in advance the moment of occurrence of a failure and its extent because of the complexity of phe-nomena related to failure. Reliability analyses are conducted especially in the stage of concept defi-nition, in the stage of designing and development and I the stage of operation and maintenance on different levels of structure breakdown for evalu-ation and estimevalu-ation of reliability parameters of an object (element or system).
Analytic methods enable evaluation of quali-tative characteristics and estimate parameters (for example failure rate, MTTF, MTBF, reliability probability (failure-free operation), coefficients of stabile availability) that characterise predicted long-term operational behaviour of objects. To en-sure proper elaboration of complex or multi func-tion systems it can be necessary to consider sev-eral complementary analytical methods. Among
of a system, determination of week points and unbalances, critical or high risky failure modes, consideration problems of system interfaces, fail-safe abilities and mechanisms etc. Development of alternative methods for reliability improve-ment (for example distribution of requireimprove-ments on redundancy, monitoring of parameters, failure detection, procedures of systems reconfiguration, maintainability, exchangeability of spare parts and procedures of repairs) should be considered as well. For alternative designs elaboration of optimisation studies from the costs and profit point of view and evaluation of proposed designs should be done.
For quantitative evaluation of reliability, cri-teria (quantitative indicators) were defined and their numerical values for a certain product we call as a reliability characteristic. Long term be-haviour in operation of repairable system is very much affected by system maintainability as well as by maintenance strategy. Availability indicator is suitable indicator for evaluation of influence of maintenance on system reliability.
Available stochastic reliability models can be expressed on the base of detailed knowledge of behaviour of given set of objects in operation. They must enable generalisation of the obtained findings also on other similar objects that were not directly subject of investigation [1].
Implementation of statistic methods has irre-placeable subsystems as follows:
• System of information collection on opera-tional reliability;
• System of selection, use and primary analysis of evaluated sample of objects;
• System of quantification of reliability indica-tors (parameters) of elements of objects; • System of quantification of object’s reliability
as a system;
• System of consequent technical analysis and implementation of obtained knowledge in op-eration, maintenance etc.
The most suitable theoretical model that op-timally characterises reliability of engineering products is Weibull model in particular because in its generality covers practically majority of possible courses of random quantities that can oc-cur during solution of objects reliability. Random quantity X will have Weibull distribution (three parameters).
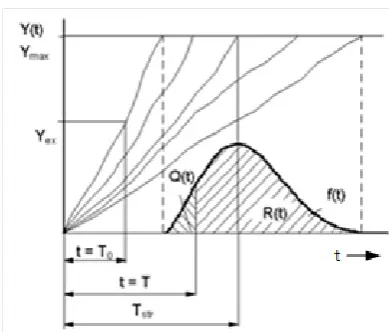
prob-rate λ(t), failure density f(t), Mean time to fail-ure. Indicators of parametric reliability are same as for statistic reliability and can be calculated in accordance with the selected model of parameter change course (Fig. 1, Fig. 2).
For calculations of indicators of parametric reliability, it is necessary to determine equation of parameter change with initial value and regres-sion coefficient as a velocity of its change by use of suitable method. Models and calculation of R(T) are presented in Table 1 [1].
Additional work load from data evaluation because of their extent, what nowadays cannot be done without information technology and in most cases it is again question of information system, automation of data collection, etc.
However, information collection can not be done for all machines and equipment and there must be criteria for selection of critical equipment. Analysis of operational and maintenance informa-tion reveals criticality of equipment from the point of view of production losses, maintenance costs, availability and low value of Tstr (MTTF).
Proposal of maintenance system can be di-vided into the individual steps:
1. Determination of reliability indicators of components.
2. Determination of the optimal times (intervals) of components operation between carrying out the planned maintenance work. This is
Fig. 1. Forming of time to failure distribution law
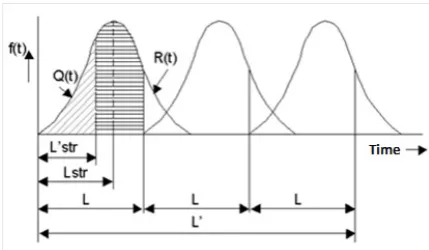
Fig. 2. Model of forming of gradual failure (generalised model)
Table 1. Formulae for calculation of parametric reliability according to equation of parameter change course
Equation of parameter change course Reliability probability (probability of failure-free operation)
1. + 2.
3.
4.
5.
6.
based on component’s reliability and costs for preventive and corrective maintenance works. 3. Proposal of the maintenance system. This
is based on determined times (intervals) of components’ operation and corresponding maintenance costs.
OPTIMISATION RELIABILITY MODEL OF
MAINTENANCE INTERVALS
Time to repair can be determined for com-ponents reliability of which we know, by dif-ferent approach for statistic or for parametric reliability.
To ensure the required reliability level, planned preventive repairs are carried out after predetermined mileage L (km) run? During these repairs preventive works, failure finding and re-storing of failed components. For simplifying the mathematical model we assume that duration of repair is small compared to up-time (operation without failures).
Because of carrying out the repairs operation time of components will have a cut distribution f’(l) with mean value L’str . Value L’str depends on degree of cut, that is value of selected interval between repairs L (Fig. 3).
Probability of failure of a component during the interval L (km), that is probability of correc-tive (unplanned) repair of the component is [1].
The task of determination of optimum interval between repairs leads to determination of such an interval L between planned repairs in which the total costs for keeping objects in failure-free state will be minimum.
We will determine overall costs connected with restoring failed components of i-th subsys-tem during the interval L’ (km); for this we will use designation:
CN – mean value of costs connected with restor-ing of failed component of i-th subsystem in corrective repair when besides costs for repair itself the production and other induced losses should be included.
CP – mean value of costs of component of i-th subsystem in preventive repair.
After using this designation for mean values, the costs for maintenance in intervals L’ (km) will be calculated using the following formula in such a way that M is a mean value of costs for restoring of one component of i-th subsystem for the inter-val Lstr (km) in the ratio of costs for preventive and corrective maintenance:
(1)
where: p = CP / CN – ratio of costs for compo-nents maintenance in preventive (planned) to corrective maintenance. Condition CP / CN is assumed; then values of p is within the interval 0 < p * 1.
From (1) it concludes that M is function of selected interval between repairs L and depend on the type and parameters of distribution of time to failure and also on ration of costs p. For analysis of solution of function M it is necessary to fund analytical expression for various types (most commonly used) of distribution of time to repair.
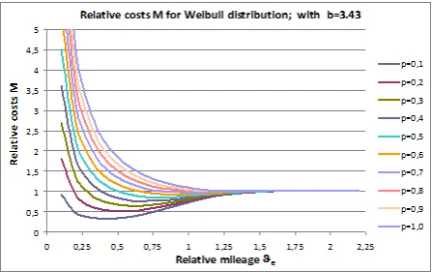
For Weibull distribution [7]:
(2)
For analysis of the formula (5) we use graphic interpretation of U = v(*e, p, b) in the Figure 4 for b = 3.43 and for various values of p.
RELIABILITY CENTERED MAINTENANCE
Because of inaccessibility of the data from operation of railway vehicles (but in general all machines) it is not possible to use fully the
tent and extent of maintenance. So for the deter-mination of content and extent of maintenance of bogie series GP 200 we used the method RCMII [7, 9, 10, 11].
Bogie GP 200
Main technical parameters of the bogie (Fig. 5): • Wheel base 2600 mm,
• Wight of the bogie (depending on variant) in the range of 5400 – 6035 kg,
• Years of manufacture 1984 –1990, • Rail gauge 1435 mm,
• Minimum curve radius R 150 m,
• Maximum speed 120 km/h, (200 km/h for spe-cial variants),
• Wheel sets with solid wheels, 0 920 mm,
• Minimum diameter of worn wheel 0 854 mm, • Diameter of disc brake 0 590 mm,
• Max load on the bogie 235 kN,
• Bogies on wagons without central electric supply are equipped with 3-phase alternator driven from axle.
We have worked-out FMEA of bogie series GP 200 in the software APIS PRO 6.0 with the criticality analysis, including functional and fail-ure nets. (The software is being used at the De-partment of transport and handling machines).
In total 178 failure modes of bogie GP 200 were analysed (faults – formally failure causes and consequences) using the RCM II decision sheets. From the analyses it concluded that dur-ing the functional loss caused by failure under operational conditions (evaluation in column H – Figure 6) the failure is evident (No Hidden) in 57 cases, (32.02%) and hidden failure is in 121 cases (67.98%).
From evident failures, 56 function failures (98,25%)can cause injury or death (failures in column S – Safety) and 1 function failure (1.75%) can cause operational consequences (column 0 in figure 6). The overall overview of failure modes distribution is in Fig. 6.
Further on, within the RCM decision sheets the preventive tasks were analysed in column H1/ S1/01/N1 used for an analysis whether appropri-ate task for technical condition identification can be used, which enables early prediction of failure occurrence and by that avoiding its consequenc-es. We found 162 tasks technically feasible (suit-able) for prediction (92.6%) and 13 which are not technically feasible (7.4%) out of 175 failures considered in this analysis.
Preventive tasks in column H2/S2/02/N2 that are used for analysis whether it is possible to find suitable restoration tasks that would prevent
fail-Fig. 4. Course of relative costs M for Weibull prob-ability distribution with b=3.43
Fig. 5. Bogie GP 200: Bogie frame (1 - longitudinal beam, 2 - crossbeam, 3 - stop for reduction transverse
clearance in curve), journal box and suspension (4
- primary suspension spring, 5 - longitudinal wheel set link, 6 - earthing FROST), support of the vehicle
body on a bogie (7 - side slide bearing, 8 - silent block for kingpin), secondary suspension (9 - bolster,
10 - secondary suspension springs, 11 - support of secondary suspension, 12 - longitudinal link of
ure occurrence – out of 14 tasks 12 are feasible (85,7 %) and 2 are not feasible (14,3 %).
Preventive tasks in column H3/S3/03/N3, used for analysis of possibility to find suitable discard task that prevents failure occurrence was found in 2 cases as technically feasible.
In complementary questions in column H4 in RCM II decision sheet, no technically feasible task that is reasonable to carry it out was found.
3 failure modes, out of total 178 recognised, require different solutions and they were not con-sidered in this analysis – Fig. 7.
Based on FMEA analysis of bogie GP 200 and evaluation of RCM sheets for individual components of the bogie GP 200, the technical evaluation points in some case at insubstantial-ity of maintenance tasks during predetermined maintenance carried out according to current regulations given by the operator of railway ve-hicle with bogie GP 200. According to the FMEA and RCM II evaluation, safe operation ot boogie GP 200 provides space for extending the time
be-tween executions or maintenance tasks. This fact may significantly enable better utilisation of com-ponents of bogie GP 200 to their limit values and from the economic point of view can reduce the costs for maintenance of the bogie.
CONCLUSIONS
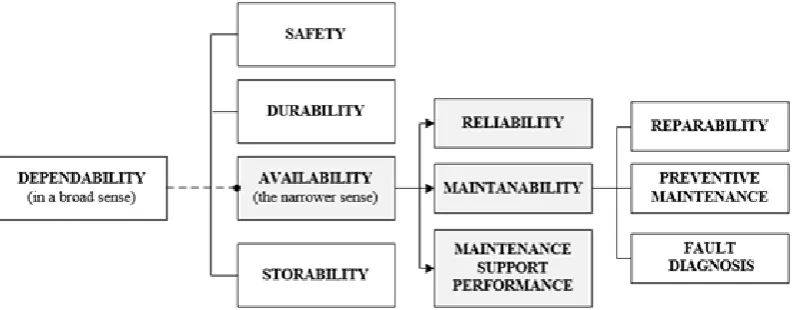
Reliability, in the general concept, is seen as stability of performance over a specified time and under given conditions of use. Dependability, in the narrower concept (Fig. 9) is an emergency as determined by three factors: reliability, maintain-ability and maintenance support. With the addition of security are referred to as RAMS [1, 3, 4, 5].
Great attention is dedicated to reliability and availability, maintenance, evaluation, maintain-ability, less maintenance and maintenance sup-port. The big downside is the assessment of these country-ness posteriori. Built negative values in the product cannot improve maintenance.
This loophole should largely eliminate main-tainability studies in the pre and post-stage small-scale product design and its relationship to other tasks to ensure maintainability and maintenance-tion. Maintainability studies objectives are: • manage the design decision;
• predict maintainability quantitative character-istics of the object;
• identify any changes in the building design or requirements, or both, if they are necessary to meet the operational requirements under the current restrictions.
Maintainability studies must be developed and combined with the design process, so that you hovel-established system operational ments. To ensure the satisfaction of those
ments, Maintainability studies carried out during all stages of design. Their results should provide input into decisions about design.
Maintainability studies form part of the pro-gram maintainability. Its aim is to ensure that supplied building meets the requirements for maintainability.
Maintainability analysis, which is an integral part of studies, maintainability, is why I-defin-ing operational requirements for qualitative and quantitative requirements for maintainability, and design criteria. Maybe this direction will produce results for improved maintenance.
Acknowledgements
This article was made under support projects KEGA 037ŽU-4/2014 – The Development of Complex Interactive Educational Portal for Sup-port the Teaching of CNC Production Machines Programming.
REFERENCES
1. Stuchlý V. and Poprocký R. Maintenance of ma
-chines and equipment (Údržba strojov a zari
-adení). Žiline, Žilinská univerzita, 2014, 359.
2. Čuboňová N. and Kuric I. Software program for
training of control system sinumerik 840D. Aca-demic Journal of Manufacturing Engineering, 9(3), 2011, 80–83.
3. Jasiulewicz-Kaczmarek M. Sustainability: ori-entation in maintenance management-theoretical background. In: P. Golinska et al. (eds.):
Eco-Pro-duction and Logistics. Emerging Trends and
Busi-ness Practices, Springer - Verlag Berlin Heidelber,
2013, 117–134.
4. Jasiulewicz-Kaczmarek M. Sustainable
mainte-nance – the next generation of maintemainte-nance man -agement. International Conference on Innovative Technologies, Budapest, 10–12.09.2013, 193–196 5. Rudawska A., Čuboňová N., Pomaranska K.,
Stančeková D. and Gola A. Technical and orga -nizational improvements of packaging production process, In: Advances in Science And Technolo-gy-Research Journal, 10, 2016, 182–192.
6. STN EN 60300-3-11 (01 0690) Manazerstvo
spoľahlivosti. Cast’ 3–11, Navod na pouzivanie.
Udrzba zamerana na bezporuchovost, Ucinnost Odl., 5, 2010.
7. Stuchly V. and Grencik J. Calculation of preven -tive maintenance tasks using RCM method.
Euro-maintenance 2010 Conference, Fiera di Verona
- Italy, 207–209.
8. Stuchly V. and Grencik J. Calculation of pre -ventive maintenance tasks using RCM method
(Výpočty intervalov preventívnych údržbových úloh v metóde RCM) Euromaintenance XX Inter -national Maintenance Conference, 2010, Fiera di
Verona, Italy.
9. SAE JA1011: Evaluation Criteria For RCM Pro-cesses, surface vehicle/aerospace standard, sae ja1011, 2009, http://www.sae.org, 2009.
10. Moubray J. Reliability centred maintenance II. In-dustrial Press, New York NY, United States, 2002. 11. Zssk V66: Predpis pre opravy zeleznicnych