Published online January 30, 2014 (http://www.sciencepublishinggroup.com/j/ijiis) doi: 10.11648/j.ijiis.20130206.11
Assessment of productivity of management systems of
the multiservice networks
Duravkin Evgen, Mohammed Khodayer Hassan Al-Dulaimi,
Aymen Mohammed Khodayer Al-Dulaimi
Kharkiv National University of Radio and Electronics, Kharkiv, Ukraine
Email address:
[email protected] (E. Duravkin), [email protected] (M. K. H. Al-Dulaimi)
To cite this article:
Duravkin Evgen, Mohammed Khodayer Hassan Al-Dulaimi, Aymen Mohammed Khodayer Al-Dulaimi. Assessment of Productivity of Management Systems of the Multiservice Networks.International Journal of Intelligent Information Systems.
Vol. 2, No. 6, 2013, pp. 94-99. doi: 10.11648/j.ijiis.20130206.11
Abstract:
This article is devoted to the assessment of different service-oriented architectures and development new web-oriented architecture. The current service-oriented architecture such as SOA, COBRA, MWEB considered in the ar-ticle, reviewed their main advantages and disadvantages in processing large amounts of data. In the range of article done analysis of the response time of distributed multi-service network for different data streams and proposed a new web-oriented architecture of distributed network management. Proposed architecture allows reducing the search time for applications stream that exceeds the service intensity.Keywords:
Architecture, Management, Intensity, Probable and Temporal Graph, Request, Service-Oriented1. Introduction
Now in the sphere of infocommunication systems inten-sive extension of a range of provided services and imple-mentation of new technologies of data transfer is watched. In this regard, the problems of increasing the effectiveness of control systems in telecommunication networks are be-coming more and more relevant. Their purpose is to pro-vide the specified quality of service to users in the provi-sion of services.
Today, there are several architectures implementing the concept of management of telecommunication systems of TMN [1]: SNMP [2], CMIP [2], etc. However, with the development of telecommunications networks and the in-troduction of new services, these technologies do not allow you to fully solve their problems of management and en-sure the specified quality of service. First of all this is due to increased heterogeneity of both hardware and software for the implementation of the introduced new services in telecommunications networks.
CORBA [3], SOA [4], WBEM [5] come to change to the specified technologies.
2. Main Part
The architecture on the basis of CORBA became one of
options of implementation of architecture of distributed control by a network in the concept of TMN. Distributed management framework of info-communication network based on CORBA is presented in Fig.1.
The introduction of technology controls CORBA, based on the idea of open distributed control allows flexibility provide interaction between geographically distributed control system components [6].
It should be noted the focus of these technology on soft-ware-implemented components of a distributed control system, that narrows its range of applications. One of the main drawbacks of this technology is that with increase in number of interacting objects (the list of provided services) complexity of implementation of IIOP sharply increases.
WBEM technology involves creation of an open envi-ronment for the administration tools that will allow services to interact freely with each other. In this technology is us-ing maximum of existus-ing technologies and standards [3].
WBEM consists of three main components (Figure 3.1) [66]:
1. CommonInformationModel (CIM), which provides a common format, language and methodology for data col-lection and management.
classes and examples.
3. Specification HTTP over CIM, CIM that defines the transformation operations in HTTP, which allows for inte-raction with CIM and technologies that support WBEM.(See Fig 3.)
Figure 1. Network structure on the basis of CORBA
The alternative management technology of ser-vice-oriented architecture is a Service Oriented Architec-ture [4, 7] (SOA) (Fig. 2).
Figure 2. Network structure on the basis of SOA
The main objective of the SOA technology is integration of heterogeneous services provided by a telecommunication network. The technology incorporates the use of a common transport medium (ESB) [6, 7]. Consequently, the perfor-mance of the system using this kind of architecture is largely determined by the capacity of the transport medium. In many cases, to achieve high performance of this system is hard enough just because of the heterogeneity of serviced services.
Increase of productivity SOA systems can be achieved in several ways:
by improving the characteristics of the ESB;
by combining the provided services to the group and the allocation of individual transport sub-systems for each of the groups.
Figure 3. Interaction principle of elements of technology WBEM
When choosing system architecture of control of tele-communication systems it is necessary to carry out com-parative an assessment of productivity of management sys-tems a multiservice network implemented on the CORBA, SOA, WBEM technologies.
As the parameter of efficiency of telecommunication systems it is possible to use average time of processing of request a network (TI) on receiving accidental service for the solution of problems of traffic management. Therefore, the management system shall distribute network resources so as to satisfy the following condition [8]:
min )
(r →
TI . (1)
where r - the distribution vector of network resources. The considered management system is provided in the form of a state graph, comprises V nodes (possible sta-tuses of system) and U channels (transitions between statuses). In everyone i node arise information flows of
requests between i and j nodes with intensity
λ
ij. Foreach flow it is necessary to select network resources to provide required quality of service. In each branch it is cessary to define required band pass range (C) and the ne-cessary capacity of the buffer storage device (B).
For carrying out the analysis of system it is necessary to define network management system model parameters.
Buffer capacity that is allocated to each node for each thread requests will be measured in queries. Performance management system is determined by time the processing of the request (T).
It is necessary to consider that the part of information can be lost. Then the quantity of the processed requests can be provided in the following look:
) 1 ( )
(t Isum Plos
Ipr = ⋅ − , (2)
where Isum - the number of incoming requests.
los
P - the probability of losing requests.
⋅
∑ = ∑
=
∈ij ∈
j
i i j ij ij losij j i j
i j
i Q
Р N T
T
,
, , , , ,
, ,
,
*
π π λ (3)
For determination of system effectiveness of control taking into account time of request processing and loss of arriving requests we will use a method of probable and temporal graphs [4]. Therefore, it is necessary to build a probabilistic-time graph that describes the control
algo-rithm telecommunication systems using different manage-ment architectures. Such graph will allow to evaluate de-pendence of time of processing of request of the user on receiving accidental (from among supported) services from intensity of arriving requests (network response time).
The structure of distributed network is presented in Fig.4
Figure 4. Structure of distributed network on the basis of the offered web-centric architecture
Carry out the comparative analysis of three offered ar-chitecture. Probability-time graph describing process of processing of request by distributed system of control on the basis of CORBA, will look like, provided in Fig. 5.
In this figure, indicated by:
p
P - probability of error-free delivery of the request;
f
Р - the probability of finding the requested service on
the server;
nf
Р - the probability that the requested service is not
found at the server;
п
Т - query processing time between nodes i and j.
Тn12
РpZ РpZТn23 РfZТn34 РfZТn45 РfZТn56
Т n37
Р nfZ
Figure 5. Probability-time graph of the query
The end view of Probability-time graph is presented in Fig.6.
Figure 6. The final form of the converted PTG
The time of servicing a request, provided that the re-quested service is found:
. 1 | dz
(z)
dff =
= z
Tsr (4)
Where
56 45 34 23 12 Т 3 2
f( ) z
f z =Рp ⋅Рnf ⋅ +Т +Т +Т +Т
.
Then the average request processing time, provided that the service is found for a distributed control system based on CORBA is:
56 45 34 23 12
56 45 34 23 12 3 2
56 45 34 23 12 3 nf 2 p
f
) (
dz
) Р
d(P
) 1 ( | dz
(z) df
T T T T T nf p
T T T T T sr
Z
T T T T T Р Р
z z T
+ + + +
+ + + +
+
+ + + + + ⋅ ⋅ =
= ⋅
⋅ =
= = =
Probability-time graph (PTG), describing the process of processing the request distributed control system based on
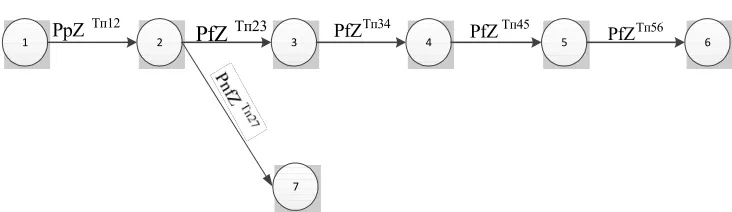
SOA, will have the form shown in Fig. 7.
1
Тп12 РpZ
2 3 4 5 6
Тп23
РfZ
РfZТп34 РfZТп45 Тп56РfZ
7
Figure 7. Probable and temporal processing graph of request
On figure variable indicated by:
р
P - probability of error-free delivery of the request;
f
Р - the probability of finding the requested service on
the server;
nf
Р - the probability that the requested service is not
found at the server;
п
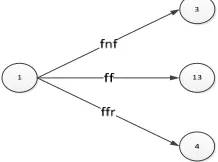
Т - query processing time between nodes i and j. The time of servicing a request, provided that the re-quested service is found (Fig.8):
1 6
7
ff
fnf
Figure 8. The final form of the converted PTG
. 1 | dz
(z)
dff =
= z
Tsr (6)
Where: 4 Т12 23 34 45 56
f ( ) z
f z = Рр⋅Рf ⋅ +Т +Т +Т +Т . Then the average request processing time, provided that
the service is found for a distributed control system based on SOA is:
56 45 34 23 12 56 45 34
23 12 4 f
)
( )
1 ( | dz
(z) df
T T T T T
f p sr
Z T T T
T T Р Р z
T
+ + + + + + + +
+ + ⋅ ⋅ = = =
(7)
Probability-time graph (PTG), describing the process of processing the request distributed control system based on WBEM, will have the form shown in Fig. 9.
Where:
р
P - the probability of error-free delivery of the request;
f
Р - the probability of finding the requested service on
the server;
nf
Р - the probability that the requested service is not
found at the server;
fr
Р - the probability of finding the requested service on a
remote server;
п
Т - query processing time between nodes i and j.
6 3
1 2 5 7
Отк
Отк 4
8
Отк Тп13
РpZ
Отк
9
11
Отк
Отк
Отк 10
Отк 12
Отк 13
6 -Тп РнZ
Тп57
Рр2Z Рр2ZТп7,10 Рр2ZТп10,12 РfZТn12,13
Тп56
Рp1Z
Тп69
Рр1Z
Тп58
Рр3Z
Тп11,12
Рр3Z
The end view of Probability-time graph is presented in Fig.10.
Figure 10. The final form of the transformed graph
The time of servicing a request, provided that the re-quested service is on the same server is:
. 1 | dz
(z)
dfp0 =
= z
Tsr (8)
where:
)
z
z
z
(
)
(
f
13 , 12 12 , 11 11 , 8 58 25 12 Т 3 3 13 , 12 12 , 10 10 , 7 57 25 12 Т 3 2 13 , 12 12 , 9 69 56 25 12 Т 3 1 1 p0 Т Т Т Т Т p Т Т Т Т Т p Т Т Т Т Т p f f pР
Р
Р
Р
Р
Р
z
+ + + + + + + + + + + + + + +⋅
+
+
⋅
+
+
⋅
⋅
⋅
⋅
⋅
=
(9)Then, based on (8), the average request processing time, provided that the service is found for a distributed control system based on WBEM is:
12 25 56 69 9 ,12 12 ,13
12 25 57 ?10 10 ,12
3 3
f
1 1 12 25 56 69 9,12 12,13 2 12 25 57
3
710 10,12 12,13 3 12 25 58 8,11 11,12 12,13
df (z)
| ( 1) ( ( ) (
dz
) ( ))
sr p f f р р
T T T T T T
р
T T T T T T
T z Р Р Р P T T T T T T P T T T
T T T P T T T T T T Z
Z
+ + + + +
+ + + + +
= = = ⋅ ⋅ ⋅ + + + + + + + + +
+ + + + + + + + + + + +
+ 12 ,13+ZT12+T25+T58+T8 ,11+T11,12+T12 ,13
(10)
3. Results
Graphic representation of the average response time of the load factor for the management multiservice networks (CORBA, SOA, WEB) based on probability-time graphs and generating functions (7,10) is shown in Fig.11.
Figure 11. The diagram of depending on the network response time of the load factor
Analysis of dependency showed that the proposed method has reduced the response time (RTT) of 2,5 times. The ad-vantage of the proposed method of managing user requests in multiservice networks based on WBEM for large values of load (load factor network > 0,5) provides features for constructing architectures .
In the network management system based on CORBA , after finding the requested service ORB redirects the
re-quest to the appropriate server serving. While the rest of the flow of requests in the queue for service.
Graphic representation of change of average time of re-quest processing with change of intensity of an entering flow for considered architecture is shown in Fig.12.
Figure 12. The diagram of dependence of time of response of a network from intensity of arriving requests
In the network management system based on SOA after the repository to locate services, ESB forwards the request to the selected server.
4. Conclusion
results that fact is confirmed that in case of value of inten-sity of an entering flow of requests bigger than inteninten-sity of service, increase in time of response of a network is much faster for architecture of CORBA, than for SOA and web-centric architecture. This is ensured by features of building architectures. In CORBA, after finding the re-quested service ORB, redirects the request to the appropri-ate server service. At the same time the rest of the flow of requests is in the queue for service. In SOA, after the repo-sitory has identified the location of service, ESB forwards the request to the selected server. In the offered web-centric architecture the scoring is reached at the expense of multi-sequencing of process of service of requests on some, in this case three, service servers. In case of arrival of request it redirected on the appropriate proxy-server, that is con-trolling server group, which provide the type of requested service. The Proxy-server connects to the server which is most suitable for processing of request, and receives an appropriate resource. Thanks to the parallelized processing of requests the architecture allows to service bigger quanti-ty of requests, is steady against failures on separate sections that, in turn, ensures stable functioning of all system at the moments of overloads. As such architecture is rather simply scalable as introduction of new services doesn't affect re-maining parts of system.
References
[1] ITU-T Recommendation M.3010. Principles for a telecom-munications management network.The Standish Group. The Scope of Software Development Project Failures: The
Stan-dish Group. Stanford, 2009,
http://www.cs.nmt.edu/~cs328/reading/Standish.pdf.
[2] E. Ramollari, D. Dranidis, and A. J. H. Simons, A survey of service oriented development methodologies. In: Proceed-ings of the 2nd European Young Researchers Workshop on Service Oriented Computing, Leicester, UK, June 2007.
[3] Finkel, F. Laroussinie, A. Petit, L. Petrucci, and P. Schnoe-belen, Systems and Software Verification: Model-Checking Techniques and Tools, 2009. ISBN 3-540-41523-8
[4] Common Object Request Broker Architecture (CORBA) Specification, Version 3.1 Part 1: CORBA Interfaces
[5] Nicloai M. Josuttis.SOA in Practice. O'Reilly, 2010.
[6] Web-Based Enterprise Management:
http://www.dmtf.org/standards/wbem.
[7] David A. Chappell Enterpsice Service Bus. — USA: O’Reilly & Associates, Inc., 2004. —27 p.