The Perception of the Autonomy Supportive
Behaviour as a Predictor of Perceived Effort
and Physical Self-esteem among School
Students from Four Nations
Vello Hein
1, Arunas Emeljanovas
2, Francis Ries
3, Irena Valantine
2, Judit H. Ekler
4, Pablo
Galán López
3Affiliations:1University of Tartu, Institute of Sport Sciences and Physiotherapy, Tartu, Estonia, 2Lithuanian Sports University, Kaunas, Lithuania, 3University of Seville, Department of Physical Education and Sport, Faculty of Educational Sciences, Seville, Spain, 4University of West Hungary, Department of Sport Science, Szombathely, Hungary
Correspondence: V. Hein, University of Tartu, Institute of Sport Sciences and Physiotherapy, 18 Ülikooli Street, EE 50090 Tartu, Estonia. E-mail: [email protected]
ABSTRACT Grounded in self-determination theory (SDT), this study tested a model of motivational sequence in which perceived autonomy support from teachers in a physical education (PE) context predicted the perceived effort and physical self-esteem via self-determined motivation in school students. School students aged 12 to 16 years from Estonia (N = 816), Lithuania (N = 706), Hungary (N = 664), and Spain (N = 922) completed measures of perceived autonomy support from PE teachers, need satisfaction for autonomy, competence, relatedness, self-determined motivation, perceived effort and physical self-esteem. The results of the structural equation model (SEM) of each sample indicated that the students’ perceived autonomy support from the teacher was directly related to effort and indirectly via autonomous motivation, whereas physical self-esteem was related indirectly. Confirmatory factor analyses and multi-sample structural equation revealed well-fitting models within each sample with the invariances of the measurement parameters across four nations. The findings support the generalizability of the measures in the motivational sequence model to predict perceived effort and physical self-esteem.
KEY WORDS perceived autonomy support, physical self-esteem, effort, physical education
Introduction
Self-determination theory (SDT; Deci & Ryan, 1985, 2000) has been extensively explored to predict various cognitive, affective, and behavioural outcomes in physical education (PE) settings (see Ntoumanis & Standage, 2009). SDT emphasizes that three inner needs are central to human growth and psychological development: the needs for autonomy, competence, and social relatedness. According to Vallerand’s motivational sequence model (1997), based on SDT, motivation is influenced by social factors (e.g. teacher behaviour, learning environment) via the satisfaction of the above-mentioned needs. The satisfaction of these psychological needs mediates the influence of social factors on motivation, which in turn will lead to cognitive, affective, and behavioural consequences of PE, such as leisure time physical activity (e.g. Hagger et al., 2009), body image and body mass (Markland & Ingledew, 2007).
In addition to encouraging a physically active lifestyle, PE also aims to promote and develop global self-esteem (Standage & Gillison, 2007; Standage, Gillison, Ntoumanis & Treasure, 2012). Self-esteem is enhanced when one’s actions are self-determined (Deci & Ryan, 1995), and its promotion is possible via volitional action and experiences during the action as an inner sense of efficacy. Several studies in physical activity (PA) settings have shown that self-determined motivation is related to physical self-esteem (Martín-Albo, Domínguez,
Accepted after revision: August 16 2017 | First published online: March 01 2018
© 2017 by the author(s). License MSA, Podgorica, Montenegro. This article is an open access article distributed under the terms and conditions of the Creative Commons Attribution (CC BY).
Conflict of interest: None declared. @MJSSMontenegro
León & Tomás, 2012; Standage et al., 2012; Standage & Gillson, 2007), but only a few studies have followed all components of the motivational sequence model. Garn, McCaughtry, Martin, Shen, and Fahlman (2012) found that the effect of autonomy supportive behaviour on self-concept was mediated via need satisfactions, but the effect of self-determined motivation on the self-concept was not investigated. In the same study, the model in which the mediation effect of need satisfaction between autonomy support and physical self-esteem was tested; the added direct effect from autonomy support to self-esteem was not significant. Standage et al. (2012) proposed a model in which the physical self-concept was predicted by the perceived autonomy support from the teacher, need satisfactions, and autonomous motivation.
The motivational sequence model has also been widely studied to explain the antecedents of effort. Zhang (2009) and Ntoumanis (2001) found that intrinsic and identified forms of motivation were the strongest predictors of students’ enjoyment and perceived effort. Moreover, Reeve, Jang, Hardre, and Omura (2002) stated that autonomy-supportive behaviour with a rational explanation of the importance of a learning activity facilitates students’ self-determined motivation, which in turn was associated with greater effort to learn. Standage, Duda, and Ntoumanis (2006) demonstrated that the perceived autonomy support from the teacher positively predicted needs for autonomy, competence and relatedness, which in turn predicted self-determined motivation and consequently teacher ratings of effort and persistence. Taylor, Ntoumanis, Standage, and Spray (2010) showed that students with higher scores on the psychological needs reported higher levels of effort and no change of these relationships over a three-month period. Gillison, Standage, and Skevington (2013) confirmed that the perceived autonomy support from the teacher and intrinsic motivation are predictive of perceived effort. Although the indirect and direct effects of psychological need satisfaction on adaptive outcomes have been explored (e.g., Cox, Smith & Williams, 2008; Standage, Duda & Ntoumanis, 2005), there is relatively little empirical work examining the role of the perceived autonomy support from the teacher in the motivational sequence model to predict physical self-esteem and perceived effort.
To date, the measurement invariances of different psychological constructs have been tested, comparing people from individualistic and collectivistic backgrounds (Hagger et al., 2003; 2009; Marsh, Marco & Asci, 2002; Vlachopoulos et al., 2013).Although the cross-cultural invariances of diverse instruments have been examined, the cross-cultural invariances of the constructs of the motivational sequence model in PA settings need to be clarified. Deci et al. (2001) investigated the equivalence of the motivational sequence model to predict anxiety, task engagement and general self-esteem in the USA and Bulgaria, and found that the model fits the data satisfactorily. However, some differences in the paths from autonomy support to need satisfaction and from latter to anxiety were observed. It is notable that the association between need satisfaction and general self-esteem was equivalent. Furthermore, Quested et al. (2013) using the motivational sequence model to predict dropout from sport, provided evidence of factor loading and structural path invariance across five European countries. More recently, Chen et al. (2015) have found that need satisfaction for autonomy and competence had unique associations with well-being, and individual differences in need valuation did not moderate these associations. Moreover, the effects of need satisfaction and need frustration were found to be equivalent across the samples from Belgium, China, USA, and Peru, and were not moderated by individual differences in the desire for need satisfaction. However, to our knowledge, no cross-cultural comparisons exist in which the equivalence of all components of the motivational sequence model in PE context in which the students’ perception of effort and physical self-esteem as outcomes were investigated. Consequently, the present research provides a comprehensive test of predicting physical self-esteem and perceived effort using SDT across four national groups (Estonia, Lithuania, Hungary, and Spain). Although their socio-political structure is currently similar, a generation previously, only Spain was not under the totalitarian Soviet regime, and Hungary had suffered less from the consequences of that regime. This allows assuming that the construction of students’ perception may be still influenced by the previous education system. Furthermore, education systems differ from country to country with respect to teacher education and school curriculum. Considering such ethnic differences, it will be reasonable to test whether the students’ perception of the psychological constructs of measurement models and structural models are acceptable across the four observed nation groups. It was expected that the measurement models of study variables and structural models will be appropriate within each sample and will exhibit little variation across cultures. This will provide evidence that the constructs measures from the hypothesized motivational sequence model to predict effort and physical self-esteem are applicable within each sample and offer valid measures of the proposed model across cultures. We also hypothesized that perceived autonomy support from the teacher is directly related to students’ perceived effort and physical self-esteem and, indirectly, via self-determined motivation.
Methods
Research Participants and Design
Measures
A modified version of Ryan and Connell’s (1989) perceived locus of causality scale by Standage, Duda, and Ntoumanis (2005) was used to measure different types of motivation (intrinsic motivation, identified regulation, introjected regulation, and external regulation) in PE. The four motivational constructs were integrated into a single index of autonomous motivation by calculating a relative autonomy index (RAI) (Vallerand & Ratelle, 2002). According to Guay, Mageau, and Vallerand (2003), the weights were assigned to each item from the intrinsic motivation (+2), identified regulation (+1), introjected regulation (-1), and extrinsic regulation (-2) scales. These items were used as indicators of a single latent relative autonomy index (RAI) factor. That is, RAI characterized autonomous motivation in subsequent analyses.
The participants’ perception of need satisfaction for autonomy (5 items), competence (5 items), and relatedness (5 items), was measured using scales proposed by Standage et al. (2005). Students’ perception of the importance of effort (4 items) in PE was measured with a subscale of the Intrinsic Motivation Inventory (McAuley, Duncan & Tammen, 1989). The six items from PSDQ (Marsh, Richards, Johnson, Roche & Tremayne, 1994) were used to measure physical self-esteem. The perceived autonomy support from the teacher was assessed by the six items presented by Reeve and Halusic (2009). All responses were made on a seven-point Likert scale except PSDQ, for which items were rated on a six-point scale. The items of the scales used in this study are presented in Appendix A.
Translation procedures
The questionnaires for use with the four national samples were developed using standardized back-translation procedures by three independent bi-lingual translators (Brislin, 1986). The back-translation procedure was repeated iteratively until the original and back-translated English versions of the questionnaires were virtually identical.
Data Analyses
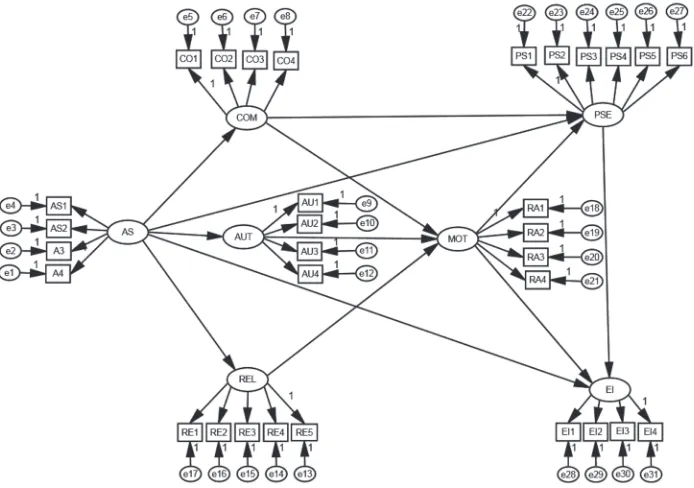
AMOS 21 software was employed for confirmatory factor analyses (CFA) and structural equation modelling (SEM). The adequacy of the CFA models was estimated by using recommended incremental goodness-of-fit indexes: CFI (comparative fit index), NNFI (non-normed fit index), and RMSEA (root mean square error of approximation). A cut-off value greater than 0.90 for the CFI, NNFI and less than or equal to 0.08 for the RMSEA were considered adequate for model fit (Hu & Bentler, 1999). The hypothesized relationships among the models’ constructs were tested using SEM (Figure 1). Model fit was evaluated using the goodness-of-fit indexes cited previously.
FIGURE 1 Hypothesised structural equation model of the motivational processes to predict physical self-esteem and effort
Note: AS = perceived autonomy support; AUT = need satisfaction for autonomy; COM = need satisfaction for competence; REL = need satisfaction for relatedness; MOT = autonomous motivation; PSE physical self-esteem; EI = perceived effort importance.
which will be used to ensure that the hypothesized model which consists of seven factors (perceived autonomy support, need satisfaction for autonomy, competence and relatedness, autonomous motivation index, physical self-esteem and effort/importance) fits well for all observed groups (Byrne, 2010). If this model fits the data well for all samples, the hypothesized model will remain under test for equivalence across the four groups. In contrast, should the hypothesized model exhibit a poor fit to the data even for one of the groups, it will be modified accordingly and become the hypothesized multigroup model under test.
The first step of the analysis included testing the data for each country using four independent CFA to validate the baseline model. The second step involved testing the fit of the configural model. This model incorporates the baseline models for four groups within the same file, allowing for invariance tests across the groups simultaneously. The configural model enables testing whether the same number of common factors would be present in each group and whether each factor would be associated with the same set of items. The fit of the configural model provides a baseline value against which all subsequently specified invariance models (measurement weight, structural weight, structural covariances and structural residuals) are compared. According to Cheung and Rensvold (2002), the evaluation of multigroup CFA nested models was based on the ΔCFI value between the two nested models. Values not exceeding .01 would indicate invariance. Scale reliability was calculated based on the composite reliability index for each used subscale that reflects the proportion of shared variance to error variance in a construct (Li, Harmer & Acock, 1996).
Results
Distributional properties of the responses to all the items were examined. The Mardia’s coefficient values ranging from 58.452 to 98.502 within the data of each sample indicated multivariate non-normality. Therefore, the bootstrapping procedure with 2000 bootstrap replications was used.
The initial results of the CFA for measurement model of each sample showed that goodness-of-fit indices
were not at an acceptable level. Inspection of the standardized residual matrixes of the observed samples re-vealed that multiple large residuals (exceeding ± 2.00) were detected for several items: “My teacher conveys
confidence in my ability to do well in the course” and “My PE teacher encourages me to ask questions” of the perceived autonomy support scale, “I have some choice in what I want to do” of the need satisfaction for autonomy scale, and “I cannot do PE very well” of the need satisfaction of competence scale. These items were removed from the subsequent analyses. Further, considering the large modification indices showed by
the Lagrange Multiplier test, thecovariances between several items were added: ”I am satisfied with the kind of person I am physically” and “Physically, I am happy with myself” of the physical self-esteem scale, ”With the other students in this PE class I feel supported” and ”With the other students in this PE class I feel understood” of the perceived need satisfaction relatedness scale, and “I can decide which activities I want to practice” and “I have a say regarding what skills I want to practice” of the perceived need satisfaction for
autonomy scale.
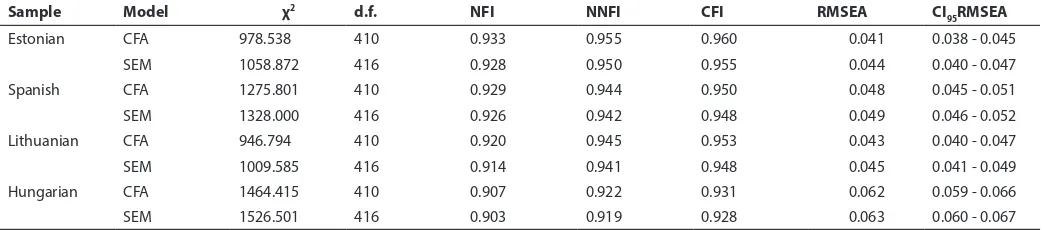
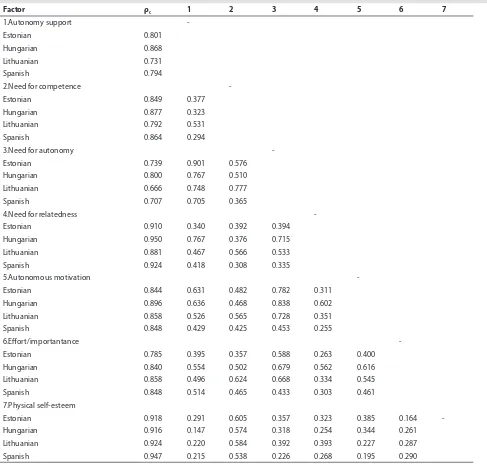
Goodness-of-fit indices for the modified measurement model of each sample are given in Table 1. In all cases, the measurement models approached the more stringent cut-off value for a well-fitting model, suggesting that the model adequately accounted for the covariance matrices of the data from all four samples. Furthermore, standardized factor loadings for the latent factor on each of its indicators were all positive and statistically significant. Factor correlations and composite reliability coefficient indexes for the CFA models of the measured constructs in each sample are presented in Table 2. All factor correlations were statistically significant, and the difference between unity and the value of the correlations exceeded 1.96 multiplied by the standard error of the correlation and therefore supporting discriminant validity of the scale. Composite reliability coefficients exceeded the recommended value of 0.70, except for the scale of perceived need satisfaction for autonomy in the Lithuanian sample.
TABLE 1 Goodness-of-fit Statistics for Single-sample Confirmatory Factor Analytic and Structural Equation Models for Each National Sample
Sample Model χ2 d.f. NFI NNFI CFI RMSEA CI 95RMSEA
Estonian CFA 978.538 410 0.933 0.955 0.960 0.041 0.038 - 0.045
SEM 1058.872 416 0.928 0.950 0.955 0.044 0.040 - 0.047
Spanish CFA 1275.801 410 0.929 0.944 0.950 0.048 0.045 - 0.051
SEM 1328.000 416 0.926 0.942 0.948 0.049 0.046 - 0.052
Lithuanian CFA 946.794 410 0.920 0.945 0.953 0.043 0.040 - 0.047
SEM 1009.585 416 0.914 0.941 0.948 0.045 0.041 - 0.049
Hungarian CFA 1464.415 410 0.907 0.922 0.931 0.062 0.059 - 0.066
SEM 1526.501 416 0.903 0.919 0.928 0.063 0.060 - 0.067
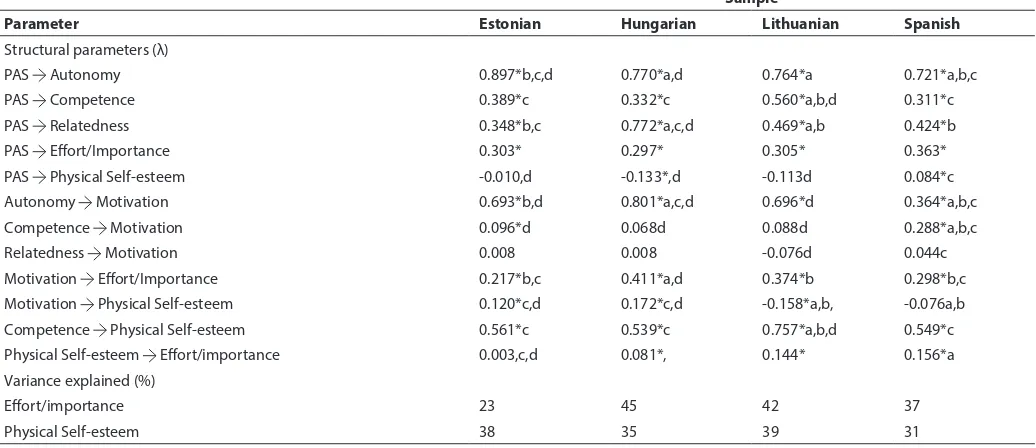
Given the adequacy of the measurement models a SEM was estimated independently for each sample (Table 1). The purpose of the SEM model (Figure 1) was to examine the influence of the perceived autonomy support from teachers on perceived effort and the physical self-esteem in the PE context directly and indirectly via the constructs of the three need satisfactions and autonomous motivation. Although the initial fit indices for the single-sample models were on an acceptable level, the modification indices shown by the Lagrange Multiplier test suggested adding the path from the perceived need for competence to physical self-esteem. Goodness-of-fit indices for the modified single-sample SEM models are presented in Table 1. Standardized parameter estimates for the structural relations among the latent constructs in the model in each sample are presented in Table 3.
In general, the relationships between the constructs of the models were similar, but some differences were followed in the coefficient values between groups. The values of the relationships between perceived autonomy support and perceived effort/importance were all statistically significant and not different among the groups. For all groups, the relationships between need satisfaction for relatedness and autonomous motivation were not statistically significant. The perceived autonomy support directly and indirectly via constructs of need satisfactions and autonomous motivation predicted perceived effort/importance, whereas physical self-esteem was related only indirectly (Table 4).
Given that the SEM models were replicable in each individual sample, a series of the multi-sample SEM model to identify variation in the measurement and structural parameters among the constructs in the hypothesized
TABLE 2 Factor Correlations for the Latent Factors from the Confirmatory Factor Analysis of the Measurement Model
Factor ρc 1 2 3 4 5 6 7
1.Autonomy support
-Estonian 0.801
Hungarian 0.868
Lithuanian 0.731
Spanish 0.794
2.Need for competence
-Estonian 0.849 0.377
Hungarian 0.877 0.323
Lithuanian 0.792 0.531
Spanish 0.864 0.294
3.Need for autonomy
-Estonian 0.739 0.901 0.576
Hungarian 0.800 0.767 0.510
Lithuanian 0.666 0.748 0.777
Spanish 0.707 0.705 0.365
4.Need for relatedness
-Estonian 0.910 0.340 0.392 0.394
Hungarian 0.950 0.767 0.376 0.715
Lithuanian 0.881 0.467 0.566 0.533
Spanish 0.924 0.418 0.308 0.335
5.Autonomous motivation
-Estonian 0.844 0.631 0.482 0.782 0.311
Hungarian 0.896 0.636 0.468 0.838 0.602
Lithuanian 0.858 0.526 0.565 0.728 0.351
Spanish 0.848 0.429 0.425 0.453 0.255
6.Effort/importantance
-Estonian 0.785 0.395 0.357 0.588 0.263 0.400
Hungarian 0.840 0.554 0.502 0.679 0.562 0.616
Lithuanian 0.858 0.496 0.624 0.668 0.334 0.545
Spanish 0.848 0.514 0.465 0.433 0.303 0.461
7.Physical self-esteem
Estonian 0.918 0.291 0.605 0.357 0.323 0.385 0.164
-Hungarian 0.916 0.147 0.574 0.318 0.254 0.344 0.261
Lithuanian 0.924 0.220 0.584 0.392 0.393 0.227 0.287
Spanish 0.947 0.215 0.538 0.226 0.268 0.195 0.290
model across the four samples was conducted following the recommendation of Byrne (2010). In terms of the measurement invariance models, a multi-group comparison between the configural model and the models testing for the invariance of measurement weight, structural weight, structural covariances and structural residuals was based on the ΔCFI value which was expected to be 0.01 or less to indicate no difference between the tested models. Goodness-of-fit indices for each model in invariance routine are presented in Table 5. At first, the configural (unconstrained) model was estimated to test whether the pattern of items and factors was feasible across the samples. This model demonstrated a good fit with the data according to the multiple
criteria adopted (Table 5). Subsequently, to test the invariance of the measurement weight, the factor loadings were constrained to be invariant across the four samples. Invariance of the factor loadings is considered the minimum acceptable criterion for measurement invariance (Byrne, 2010). The difference of the incremental fit indices (ΔCFI; 0.944 - 0.939 = 0.005) did not exceed the value of 0.01, indicating the existence of the invariance of measurement weight. In the subsequent nested model in which the invariance of the structural weights was tested beyond the constraints of factor loadings, the structural paths were constrained to be equal. The result of ΔCFI also indicated the invariance of structural weights. Finally, the ΔCFI values of the models testing the invariance of structural covariances and structural residuals (error variance associated with dependent factors) showed the equality of these parameters across the four nations.
TABLE 3 Standardized Parameter Estimates among Latent Factors and Explained Variance in (%) in Physical Self-esteem and Effort/ importance for the Structural Model for Each National Sample
Sample
Parameter Estonian Hungarian Lithuanian Spanish Structural parameters (λ)
PAS Autonomy 0.897*b,c,d 0.770*a,d 0.764*a 0.721*a,b,c
PAS Competence 0.389*c 0.332*c 0.560*a,b,d 0.311*c
PAS Relatedness 0.348*b,c 0.772*a,c,d 0.469*a,b 0.424*b
PAS Effort/Importance 0.303* 0.297* 0.305* 0.363*
PAS Physical Self-esteem -0.010,d -0.133*,d -0.113d 0.084*c
Autonomy Motivation 0.693*b,d 0.801*a,c,d 0.696*d 0.364*a,b,c
Competence Motivation 0.096*d 0.068d 0.088d 0.288*a,b,c
Relatedness Motivation 0.008 0.008 -0.076d 0.044c
Motivation Effort/Importance 0.217*b,c 0.411*a,d 0.374*b 0.298*b,c
Motivation Physical Self-esteem 0.120*c,d 0.172*c,d -0.158*a,b, -0.076a,b
Competence Physical Self-esteem 0.561*c 0.539*c 0.757*a,b,d 0.549*c
Physical Self-esteem Effort/importance 0.003,c,d 0.081*, 0.144* 0.156*a
Variance explained (%)
Effort/importance 23 45 42 37
Physical Self-esteem 38 35 39 31
Note: * p<0.05. Significantly different (p<0.05) from the respective value: a - in Estonia, b - in Hungary, c - in Lithuania, d - in Spain.
TABLE 4 Indirect Effects of Perceived Autonomy Support on Physical Self-esteem and Effort/importance
Sample
Parameter Estonian Hungarian Lithuanian Spanish Indirect effect
PAS Physical Self-Esteem 0.294 (0.182-0.344)
0.290 (0.147-0.289)
0.337 (0.235-0.529)
0.142 (0.083-0.194) PAS Effort/Importance 0.144
(0.072-0.292)
.278 (0.175-0.302)
0.237 (0.295-0.473)
0.146 (0.112-0.211) Note: Standardized coefficients are presented with bootstrap-generated bias-corrected 95% confident intervals. PAS - perceived autonomy support from teacher.
TABLE 5 Goodness-of-Fit statistics and Model Comparisons for Multisample Structural Equation Models
Models χ2 d.f. NFI NNFI CFI RMSEA CI 95RMSEA
Unconstrained model 4922.958 1664 0.918 0.938 0.944 0.025 0.025 - 0.027
Measurement weight 5301.435 1736 0.912 0.935 0.939 0.026 0.025 - 0.027
Structural weight 5595.844 1772 0.907 0.931 0.934 0.026 0.026 - 0.027
Structural covariances 5681.868 1775 0.906 0.930 0.933 0.027 0.026 - 0.027
Discussion
The aim of the present study was to test the cross-cultural generalizability of the model based on SDT in which students’ perception of autonomy support from teachers, basic psychological needs and self-determined motivation in PE predict physical self-esteem and effort across four national samples with different cultural backgrounds. It was expected that the measurement aspects of the proposed models (measurement weight, structural weight, structural covariances and structural residuals) would be appropriate within each sample and would exhibit little variation across samples.
The initial results of the CFA for measurement model of each sample indicated the inadequate fit and, therefore, the models were re-analysed using the modification indices and considering the high values of standardized residuals of some items. The item “My teacher conveys confidence in my ability to do well in the course” was removed from the perceived autonomy support scale. This item was worded slightly differently in the study of Standage et al. (2006) among British students, and no reason for exclusion from the scale was fixed. Obviously, the formulation this item is sensitive to ethnic differences. The item “My PE teacher encourages me to ask questions” was also removed from the same subscale as PE teachers from the observed countries are perhaps not often asking questions during instruction and, consequently, the students have not experienced such kind of teacher behaviour. The items “I have some choice in what I want to do” of the need satisfaction for autonomy scale, and “I cannot do PE very well” of the need satisfaction of competence scale also did not reflect the students’ perception of teachers’ behaviour adequately. Ntoumanis (2001) noted that PE teachers are usually following a prescriptive school curriculum that does not allow them to provide opportunities for students’ initiatives. This is probably the case in all observed countries and may explain why the students did not perceive this item as exactly reflecting teachers’ behaviour as satisfying their need for autonomy. Another reason may be that PE teachers do not feel skilled using supportive instructional behaviours. This statement is also reinforced by previous research in which the preference for using controlling teaching styles (reproductive) in respect of students’ autonomy supportive teaching styles (productive) among teachers from these countries was reported by Hein et al. (2012). The item, “I cannot do PE very well” may be interpreted by students very differently: the general skill level, physical fitness or ability, health problems, etc. This negatively worded item of the need satisfaction for competence scale was not used in the cross-cultural study of Chen et al. (2015). Therefore, this item can be considered to be unsuitable for measuring the need satisfaction for competence. In the final CFA models for each sample, based on the modification indexes the error covariance between several items was set to be free, although the error terms for any pairs of items are usually assumed to be uncorrelated. However, Bentler and Chou, (1987) noted that incorporating error terms into a CFA model does not undermine the factorial validity of the data obtained, but enables a more realistic factorial representation of the observed data. In general, the results of the SEM model (Figure 1) provided support for the proposed relations between the observed variables, which were guided by SDT. Furthermore, the psychometric parameters were on an acceptable level. To some extent, this model is similar to the models presented previously by Standage and Gillson (2007) in which instead of physical self-esteem the global self-esteem was observed and with the recently proposed model (Standage et al., 2012) where the physical self-esteem was measured by the scale used in the present study. However, in the latter model, the effect of self-determined motivation in PE on physical self-esteem was estimated via self-determined motivation in a leisure-time context. Moreover, it is noteworthy that in a study of Garn et al. (2012) the direct effect of autonomy support on physical self-esteem was not significant in a similar model. The direct effect of autonomous motivation on effort in the model of each sample provides support to earlier studies (Ntoumanis, 2001; Martin-Albo et al., 2012), which reported that intrinsic motivation was the strongest predictor of effort. Autonomous motivation was a stronger predictor of effort for Hungarian and Lithuanian students than for Estonian and Spanish students. Students’ high self-determined motivation means that they experience PE as exciting and are, therefore, willing to exert high effort to learn new skills.
This model demonstrated that the direct effect from perceived autonomy support on effort was significant in each sample. This finding is consistent to some extent with several previous studies (Ntoumanis, 2001; Reeve, Jang, Hardre & Omura, 2002) that reported a positive relationship between perceived autonomy support and effort. Indeed, a significant direct effect from autonomy support on self-esteem was not followed in each sample. The results of the proposed motivational sequence model confirmed the hypothesis that the effect of the perceived autonomy support on physical self-esteem and effort is influenced via psychological needs satisfaction and autonomous motivation.
The most prominent finding in the present study is the relatively consistent pattern of influence among the model constructs across the four cultural groups. There were only a few structural parameters that varied significantly across the samples. An explanation for a non-significant path from need satisfaction for relatedness to self-determined motivation among the Estonian and Lithuanian samples may be that they have relatively stronger individualism values in comparison to Hungarians and Spaniards. However, such statement is in contrast with several previous reports (Markus & Kitayama, 1991; Oyserman, Coon & Kemmelmeier, 2002), in which these nations are characterized as endorsing more collectivist values.
The results of the presented motivational sequence model suggest that more autonomy supportive behaviour from the teacher facilitates students to feel physically well and to put more effort into exercising. Students who perceive the effort as an integral component of physical activity do not need to force themselves to engage in physical exercise. In this case, they can easily engage in exercise during leisure time.
In conclusion, these results suggest that teachers’ autonomy supportive behaviour will help foster effort directly and indirectly via autonomous motivation, whereas the effect on physical self-esteem is mainly indirect. The present research makes a unique contribution to the literature providing a comprehensive test of the prediction the physical self-esteem and importance of perceived effort on the basis of SDT across four national groups with diverse cultural backgrounds. The findings support the generalizability of the measures in the motivational sequence model to predict perceived effort and physical self-esteem.
The information provided could inform teachers’ practice by showing how their behaviour is related to perceived physical self-esteem and effort, which in turn may be related to PA outside of school. Also, the information about the differences in the students’ cognition may be valuable for those who have the intention to teach PE in different countries.
APPENDIX A Questionnaire items used in the study
Autonomy support Physical self esteem
I feel that my teacher provides me with choices and options. I am satisfied with the kind of person I am physically. I feel understood by my teacher. Physically, I am happy with myself.
My teacher conveys confidence in my ability to do well in the course. I feel good about the way I look and what I can do physically. My teacher encourages me to ask questions. Physically I feel good about myself.
My teacher listens to how I would like to do things. I feel good about who I am and what I can do physically. My teacher tries to understand how I see things before suggesting a new
way to do things. I feel good about who I am physically.
Need satisfaction for autonomy Motivation
I can decide which activities I want to practice. I take part in PE classes… I have a say regarding what skills I want to practice. Intrinsic motivation
I feel that I do PE because I want to. because PE is fun.
I feel a certain freedom of action. because I enjoy learning new skills. I have some choice in what I want to do. because PE is exciting.
Need satisfaction for competence because of the enjoyment that I feel while learning new skills/techniques.
I think I am pretty good in PE. Identified regulation
I am satisfied with my performance in PE. because I want to learn sport skills.
When I have participated in PE for a while, I feel pretty competent. because it is important for me to do well in PE.
I am pretty skilled in PE. because I want to improve in sport.
I cannot do PE very well. because I can learn skills which I could use in other areas of my life.
Need satisfaction for relatedness Introjected regulation
With other students in PE classes I feel… because I want the teacher to think I’m a good student.
Supported. because I would feel bad about myself if I didn’t.
Understood. because I want the other students to think I’m skilful.
Listened to because it bothers me when I don’t.
Valued. External regulation
Safe. because I’ll get into trouble if I don’t.
Effort/Importance because that’s what I am supposed to do.
I put a lot of effort into PE. so that the teacher won’t yell at me.
I didn’t try very hard to do well in PE. (R) because that’s the rule. I tried very hard on PE.
R E F E R E N C E S
Bentler, P. M., & Chou,C. (1987). Practical issues in structural modelling. Sociological Methods and Research, 6, 78 – 117.
Brislin, R. W. (1986). The wording and translation of research instruments. In W. J. Lonner & J. W Berry (Eds), Field methods in educational research (pp. 137–164). Newbury Park, CA: Sage.
Byrne, B. M. (2010). Structural equation modeling with Amos: Basic concepts, applications, and programming (2nd edition). New York, NY: Taylor and Francis Group.
Chen, B., Vansteenkiste, M., Beyers, W., Deci, E. L., Van der Kaap-Deeder, J., Duriez, B., Lens, W. Matos, L, Mouratidis, A., Ryan, R. M., Sheldon, K.M., Soenens, B., Van Petegem, S., & Verstuyf, J. (2015). Basic psychological need satisfaction, need frustration, and need strength across four cultures. Motivation and Emotion, 39, 216–236.
Cheung, G. W., & Rensvold, R. B. (2002). Evaluating goodness-of-fit indexes for testing measurement invariance. Structural Equation Modeling 9, 233 – 255.
Cox, A. E., Smith, A. L., & Williams, L. (2008). Change in physical education motivation and physical activity behavior during middle school. The Journal of Adolescent Health, 43, 506 – 513.
Deci, E. L., & Ryan, R. M. (1985). The general causality orientations scale: Self-determination in personality. Journal of Research in Personality, 19, 109 – 134.
Deci, E. L., & Ryan, R. M. (1995). Human autonomy: The basis for true self-esteem. In: M. Kernis (Ed), Efficacy, agency, and self-esteem (pp. 31–49). New York: Plenum.
Deci, E. L., & Ryan, R. M. (2000).The “what” and “why” of goal pursuits: Human needs and the self-determination of behavior. Psychological Inquiry, 11, 227 – 268.
Deci, E. L., Ryan, R. M., Gagné, M., Leone, D. R., Usunov, J., & Kornazheva, B. P. (2001). Need satisfaction, motivation, and well-being in the work organizations of a former Eastern Bloc country. Personality and Social Psychology Bulletin, 27, 930-942.
Garn, A. C., McCaughtry, N., Martin, J., Shen, B., & Fahlman, M. (2012). A basic needs theory investigation of adolescents’ physical self-concept and global self-esteem. International Journal of Sport and Exercise Psychology, 10, 314 – 328.
Gillison, F. B., Standage, M., & Skevington, S. M. (2013). The effects of manipulating goal content and auton
-omy support climate on outcomes of a PE fitness class. Psychology of Sport and Exercise,14, 342 – 352. Guay, F., Mageau, G. A., & Vallerand, R. J. (2003). On the hierarchical structure of self-determined motiva -tion: A test of top-down, bottom-up, reciprocal, and horizontal effects. Personality and Social Psychol-ogy Bulletin, 29, 992 – 1004.
Hagger, M. S., Biddle, S. J.H., Chow, E, W., Stambulova, N. and Kavussan, M. (2003). Physical self-perceptions in adolescence: Generalizability of a hierarchical multidimensional model across three cultures. Journal of Cross-Cultural Psychology, 34, 611 – 628.
Hagger, M. S., Chatzisarantis N. L. D., Hein, V., Soós ,I., Karsai, I., Lintunen, T., & Leemans, S. (2009). Teacher, peer, and parent autonomy support in physical education and leisure time physical activity: a trans-contextual model of motivation in four nations. Psychology and Health,24, 689 – 711.
Hein, V., Ries, F., Pires, F., Caune, A., Emeljanovas, A., Ekler, J.H., & Valantiniene, I. (2012). The relationship between teaching styles and motivation to teach among physical education teachers. Journal of Sports Science and Medicine, 11,123 – 130.
Hu, L. & Bentler, P. M. (1999. Cut-off criteria for fit indexes in covariance structure analysis: Conventional criteria versus new alternatives. Structural Equation Modelling, 6, 1 – 55.
Li, F., Harmer, P., & Acock, A. (1996). The task and ego orientation in sport questionnaire: construct equivalence and mean differences across gender. Research Quarterly for Exercise and Sport, 68, 228 – 238. Markus, H. R., & Kitayama, S. (1991). Culture and the self: Implications for cognition, emotion and motivation.
Psychological Review, 98, 224 – 253.
Markland, D. A., & Ingledew, D. K. (2007). The relationships between body mass and body image and relative autonomy for exercise among adolescent males and females. Psychology of Sport and Exercise, 8, 836 – 853. Martín-Albo, J., Núñez, J. L., Domínguez, E., León, J., & Tomás, J. M. (2012). Relationships between intrinsic
motivation, physical self-concept and satisfaction with life: A longitudinal study. Journal of Sports Sciences, 30, 337 – 347.
Marsh, H. W., Marco, I. T., & Asci, F. H. (2002). Cross-cultural validity of the physical self-description questionnaire: Comparison of factor structures in Australia, Spain and Turkey. Research Quarterly for Exercise and Sport, 73, 257 – 270.
Marsh, H. W., Richards, G. E., Johnson, S., Roche, L., & Tremayne, P. (1994). Physical Self-Description Questionnaire: Psychometric properties and a multitrait-multimethod analysis of relations to existing instruments. Journal of Sport and Exercise Psychology, 16, 270 – 305.
McAuley, E., Duncan, T., & Tammen, V. V. (1989). Psychometric properties of the Intrinsic Motivation Inventory in a competitive sport setting: A confirmatory factor analysis. Research Quarterly for Exercise and Sport, 60, 48 – 58.
Ntoumanis, N. (2001). A self-determination approach to the understanding of motivation in physical education. British Journal of Educational Psychology, 71, 225 – 242.
Oyserman, D., Coon, H. M., & Kemmelmeier, M. (2002). Rethinking individualism and collectivism: Evaluation of theoretical assumptions and meta-analyses. Psychological Bulletin,128, 3–52.
Quested, E., Ntoumanis, N., Viladrich, C., Haug, E., Ommundsen, Y., Van Hoye, A., & Duda, J.L. (2013). Intentions to drop-out of youth soccer: A test of the basic needs theory amount European youth from five countries. International Journal of Sport and Exercise Psychology, 11, 395-407.
Reeve, J., & Halusic, M. (2009). How K-12 teachers can put self-determination theory principles into practice. Theory and Research in Education,7, 145 – 154.
Reeve, J., Jang, H., Hardre, P., & Omura, M. (2002). Providing a rationale in an autonomy-supportive way as a strategy to motivate others during an uninteresting activity. Motivation and Emotion, 26, 183 – 207. Ryan, R. M., & Connell, J. P. (1989). Perceived locus of causality and internalization: Examining reasons for
acting in two domains. Journal of Personality and Social Psychology,5, 749 –761.
Standage, M., & Gillison, F. (2007). Students’ motivational responses toward school physical education and their relationship to general self–esteem and health–related quality of life. Psychology of Sport and Exercise,8, 704 – 721.
Standage, M., Duda, J. L., & Ntoumanis, N. (2005). A test of self-determination theory in school physical education. British Journal of Educational Psychology, 75, 411 – 433.
Standage, M., Duda, J. L., & Ntoumanis, N. (2006). Students’ motivational processes and their relationship to teacher ratings in school physical education: A self-determination theory approach. Research Quarterly for Exercise and Sport,77, 100 – 110.
Standage, M., Gillison, F., Ntoumanis, N., & Treasure, D. C. (2012). Predicting students’ physical activity and
health-related well-being: A prospective cross-domain investigation of motivation across school physical education and exercise settings. Journal of Sport and Exercise Psychology, 34, 37–60.
Taylor, I. M., Ntoumanis, N., Standage, M., & Spray, C. M. (2010). Motivational predictors of physical education students’ effort, exercise intentions, and leisure-time physical activity: A multilevel linear growth analysis. Journal of Sport and Exercise Psychology,32, 99 – 120.
Zhang, T. (2009). Relations among school students’ self-determined motivation, perceived enjoyment, effort, and physical activity behaviors. Perceptual and Motor Skills, 109, 783 – 790.
Vallerand, R. J. (1997) Towards a hierarchical model of intrinsic and extrinsic motivation. In M. P Zanna (Ed), Advances in experimental social psychology (pp.271 – 359). New York: Academic Press.
Vallerand, R. J., & Ratelle, C. F. (2002). Intrinsic and extrinsic motivation: A hierarchical model. In E.I. Deci, & R.M. Ryan, R. (Eds), Handbook of self-determination research (pp. 37 – 63). Rochester, NY: University of Rochester Press.
Vlachopoulos, S. P, Asci, F. H., Cid, L., Ersoz, G., Conzăles-Cutre, D., Moreno-Murcia, J. A., & Moutao, J. (2013) Cross-cultural invariance of the basic psychological needs in exercise scale and need satisfaction