INTRODUCTION
Space flight hardware can be exposed to different loading conditions resulting from manufacturing, transportation, and lunch and in-orbit operation. During the launch, the spacecraft will be exposed to random loads of both mechanical and acoustic nature. Mechanical random loads are the base acceleration at the interface between the
Frequency response analysis of a small satellite
structure under random vibration acceleration
loads using Mode superposition method
HAMID EMAMI and FOAD FARHANI
Department of Mechanical Engineering, Iranian Research Organization for Science and Technology (I.R.O.S.T), P.O. Box: 15815-3538, Tehran (Iran).
(Received: January 12, 2009; Accepted: April 10, 2009)
ABSTRACT
Launch event imposes critical loading conditions on the space flight hardware. Space structures are exposed to different environments and consequently the space vehicle experiences various loading conditions. The random vibration load, which is inputted mechanically and acoustically from rocket engines, is one of the major loads which must be considered in payload flight hardware structures. In this study two different approaches for calculating the frequency response of a small satellite structure under random vibration acceleration loads have been considered. These approaches are based on frequency response analysis using modal effective modes and effective masses related to these modes, and finite element spectrum analysis. The first approach considers the overall behavior of the structure. On the other hand, the second approach reveals the response of the structure on each desired node. The results of the first approach are dependent on the number of selected modes, and effective masses related to the modes. The analyses for small satellites show that the application of superposition technique can result in an appreciable reduction in the calculation time, and helps in finding points on the structure, which show the behavior of the center of gravity during the tests. In addition, it may also be used as approximation for modeling of satellite behavior, treated as concentrated mass, during the quick analyses at the preliminary design, and for the satellite and launcher coupled analyses. The analyses show that the satellite behavior under the effect of local modes can be different. This increases the error in this approach, especially for larger structures, which have structure elements with greater inertial effects and consequently higher local effective masses. This approach also predicts the equivalent static load based on root mean square (rms) calculation of power spectral density response. This paper also considers the influence of effective mode selection criteria on the rms value of the response.
Key words: Random vibration, modal effective mass, structural dynamics, space structures.
launch vehicle and the spacecraft. The random loads are due to several sources such as the interaction between the launch vehicle structure and the engine exhaust noise combination. Additionally, turbulent boundary layers and tank sloshing of launcher will introduce random loads.
random loads and structural response of the launcher str ucture. These high frequency disturbances result in both mechanical and acoustic borne excitation, and occur during the launch phase only (lift-off and ascent), while the main engines are operating. Random vibration loads do not occur at regular intervals for a defined period of time; and as the name implies, they are random in time of application and duration. Vibro-acoustic data has been acquired from static firings, flight measurements, as well as acoustic tests and large-scale random vibration tests in many space programs. The random vibration design environments for space flight hardware must be presented, in the appropriate launcher documents, for several mounting locations1. This method requires the experimenter to have a detailed finite element model of the component. The method can be used to take the flexibility of the supporting structure into account. A dynamic response analysis is performed using NASTRAN software. This approach can be used to determine random load factors for use in subsequent static analyses. In this study, the spectr um analysis based on finite element method and the superpositions of effective modes are considered.
Application of superposition method is based on the use of effective masses concept for systems with one degree of freedom², and extension of this method to systems with n degrees of freedom in a special normal modes system for calculation of reaction forces as the result of loads due to random vibration3.
Results show that the mode superposition method is a cost effective approach to calculate the overall behavior of structure. Also this method is a quick method to evaluate the response of structure, and the overall parameters like damping value can be corrected easily during the test stages. This study also concerns the criteria of selecting effective modes to get better results. The results of response and rms (root mean square) value of response are compared with the spectr um analysis based on finite element method. Because of the fact that the superposition method calculates the center of gravity (COG) response of structure, this method
can be used to find appropriate measuring points for performing environmental tests.
Spectrum response analysis
Random response analysis is treated as a data reduction procedure, which is applied to the results of a frequency response analysis. First, the frequency response analysis is performed for sinusoidal loading conditions
{ }
P
, at a sequence of frequenciesω
i. Nor mal data reduction procedures are then applied to the output of the frequency response analysis module, resulting in a set of output quantitiesu
j(
ω
i)
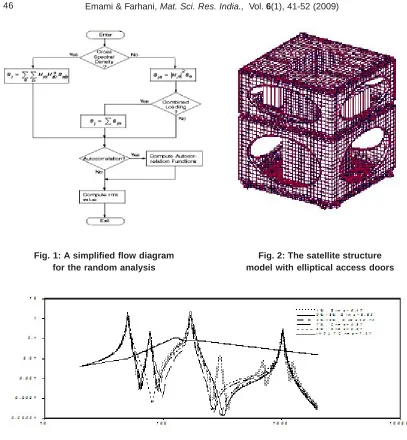
, corresponding to an output j. The calculations of power spectral densities and autocorrelation functions for the output quantities are performed in the random analysis module of NASTRAN software4.Figure 1 is a simplified flow diagram for the random analysis module. The inputs to the module are the frequency responses
H
j(
ω
i)
of quantities to loading conditions{ }
Pa atfrequencies
ω
i, and the auto- and cross-spectral densities of the loading conditionsS
a andS
ab . The response quantitiesS
j may be displacements, velocities, accelerations, internal forces, or stresses. In this study the responses are presented by acceleration.Application of these frequency response techniques to the analysis of random processes requires that the system be linear and that the excitation be stationary with respect to time. The theory includes a few important theorems which will be reviewed [5].
An important quantity in random analysis theory is the autocorrelation function
R
j(
τ
)
of a physical variableu
j, and is defined by:...(1)
...(2)
It may be shown (using the theory of Fourier integrals) that the autocorrelation function and the power spectral density are Fourier transforms of one another. Thus, the autocorrelation function can be defined in terms of frequency response functions as:
...(3)
From the mean-square theorem, the rms value
u
j is given as:...(4)
According to this correlation, the rms value can be obtained from the area under the spectral density curve. This quantity is a suitable criterion for approximation of the destructive energy due to the random vibrations in the system response.
The transfer function theorem states that, if Hj(
ω
i) is the frequency response of any physical variableu
j, due to an excitation source,Q(ω), which may be a point force, a loading condition or some other form of excitation, i.e., if:...(5)
where uj(ω) and Q(ω) are the Fourier transfor ms of
u
j and Q(ω
), then the power spectral density of the response Sj(ω), is relatedto the power spectral density of the source
S
a(
ω
)
, by the relation:...(6)
Equation (6) is an important result because it allows the statistical proper ties (e.g., the autocorrelation function) of the response of a
system to random excitation to be evaluated through the technique of frequency response.
In our analyses, performed on basis of the above discussion, the frequency response of the satellite for a steady random vibration excitation, with unity spectral density in the whole range of interest in this study, is estimated. In this manner the response for each structure node can be observed. In view of linear nature of Eq. (6), the response of each node can be determined through the multiplication of this response with the input spectral density.
Superposition Technique
For a one-oscillator system with a resonance
f
i the frequency response function (FRF) representing the transmissibility of the base acceleration to the COG Acceleration is given by [6]:...(7)
A base accelerated structure (of mass M) can be represented exactly by oscillators in parallel with accordingly adjusted mass stiffness and damping. For each resonant frequency
f
i the transmissibility factor is calculated over a specified frequency range (i.ef
varies from 20Hz to 2000Hz) with Eq. (7) split into its real and imaginary parts:With the effective mass
m
i of each resonant frequencyf
i the frequency response is then determined over the specified frequency range with the summation over all resonant frequenciesi
f
:...(9)
This means that real and imaginary parts are summed separately after which these results are Root Sum Squared.
The Power Spectral Density output representing the CoG accelerations is determined over the specified frequency range using the following relation:
...(10)
Model Description
In this work, double-module cubical satellite structures with elliptical doors on all sides of the upper and lower modules, having access to the structure internal space, have been s t u d i e d ( s e e F i g . 2 ) . T h e d o u bl e - m o d u l e configuration provides a suitable layout for the gravity gradient boom (GG boom), and the two batter y packs placed in the upper module. Placement of battery packs in the upper module helps in thermal control of the sensitive batteries. V i b r a t i o n s e n s i t i ve c o m p o n e n t s s u c h a s electronic boards are packed in an electronic box, in contact with the base plate, in the lower module. In this location, the electronic boards withstand the minimum vibrations transmitted from the launcher. In addition, due to the access doors placed on the upper and lower module, the str ucture has the required flexibility for optimum component lay-out and easy access to the components in various stages of assembly, integration and test.
On basis of results from previous study [7], suitable distribution of effective masses in the elliptical access doors produces the best response
for reduction of dynamic loads resulting from random vibration and shock phenomenon.
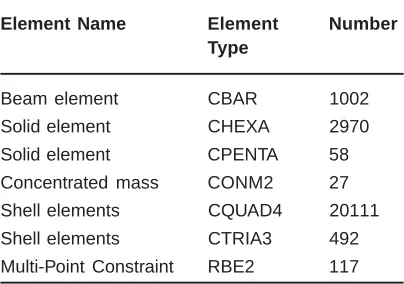
This structure is modeled using Patran pre/ post analysis software and Nastran for FEM solver. The modeling consists of both structural and non-structural components, so the mass budget of satellite is applied along with the structural modeling. A summary of types of elements used in this modeling is listed in Table 1. Beam elements are used for modeling of both stiffeners and bolted joints, solid elements are implemented in the pocketing and thick regions, shell element are used for modeling of plate components, the concentrated mass and MPC’s are used for considering the point mass and connections, respectively.
RESULTS AND DISCUSSIONS
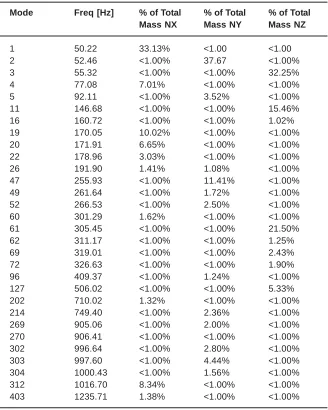
In order to calculate the response, the constrained modal analysis is applied. The interface at the supporting region is fixed by fixing six degrees of freedom through the connecting points. The modal analysis results show that the first mode occurs in the lateral direction. The first modes in three directions are approximately 50 Hz. The modal effective masses are extracted based on Guyan [8] reduction technique. Table 2 lists the effective modes in translational directions, which are calculated from the finite element analysis.
In order to compare the results of the satellite structure response, obtained from the two methods
Table 1: Type and number of elements used in the finite element model
Element Name Element Number
Type
Beam element CBAR 1002
Solid element CHEXA 2970
Solid element CPENTA 58
Concentrated mass CONM2 27
Shell elements CQUAD4 20111
Shell elements CTRIA3 492
Table 2: Summery of effective modes
Mode Freq [Hz] % of Total % of Total % of Total
Mass NX Mass NY Mass NZ
1 50.22 33.13% <1.00 <1.00
2 52.46 <1.00% 37.67 <1.00%
3 55.32 <1.00% <1.00% 32.25%
4 77.08 7.01% <1.00% <1.00%
5 92.11 <1.00% 3.52% <1.00%
11 146.68 <1.00% <1.00% 15.46%
16 160.72 <1.00% <1.00% 1.02%
19 170.05 10.02% <1.00% <1.00%
20 171.91 6.65% <1.00% <1.00%
22 178.96 3.03% <1.00% <1.00%
26 191.90 1.41% 1.08% <1.00%
47 255.93 <1.00% 11.41% <1.00%
49 261.64 <1.00% 1.72% <1.00%
52 266.53 <1.00% 2.50% <1.00%
60 301.29 1.62% <1.00% <1.00%
61 305.45 <1.00% <1.00% 21.50%
62 311.17 <1.00% <1.00% 1.25%
69 319.01 <1.00% <1.00% 2.43%
72 326.63 <1.00% <1.00% 1.90%
96 409.37 <1.00% 1.24% <1.00%
127 506.02 <1.00% <1.00% 5.33%
202 710.02 1.32% <1.00% <1.00%
214 749.40 <1.00% 2.36% <1.00%
269 905.06 <1.00% 2.00% <1.00%
270 906.41 <1.00% <1.00% <1.00%
302 996.64 <1.00% 2.80% <1.00%
303 997.60 <1.00% 4.44% <1.00%
304 1000.43 <1.00% 1.56% <1.00%
312 1016.70 8.34% <1.00% <1.00%
403 1235.71 1.38% <1.00% <1.00%
considered in this study, input data on random vibrations from Cosmos launcher Interface Compatibility Document (ICD) [9] has been used. The proposed value and spectrum for this load case is presented for launcher as given in Table 3. The rms value (area under PSD curve) of the excitation is 7.97g.
The superposition technique has been used to evaluate the frequency response function of the satellite structure due to launcher input. The criteria for selection of effective masses are varied from 1 to 8% of whole structures.
Fig. 2: The satellite structure model with elliptical access doors Fig. 1: A simplified flow diagram
for the random analysis
Fig. 3: Response of the CoG (using the superposition method in X-direction)
Fig. 5: Response of the CoG (using the superposition method in Y-direction)
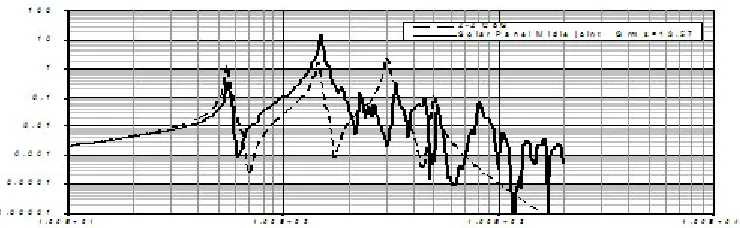
Fig. 6: Response in X-direction due to excitation in X-direction at middle solar panels joint
Fig. 9: Response in X-direction due to excitation in X-direction at the boom joint
Fig. 10: Response in Y-direction due to excitation in Y-direction at the boom joint
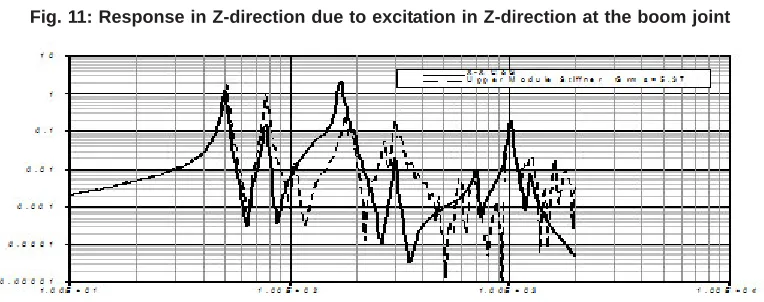
Fig. 11: Response in Z-direction due to excitation in Z-direction at the boom joint
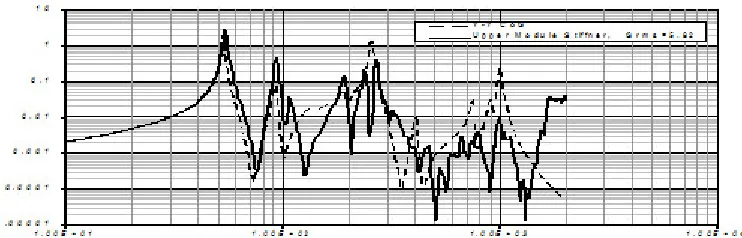
Fig. 13: Response in Y-direction due to excitation in Y-direction at upper module stiffeners
Fig. 14: Response in Z-direction due to excitation in Z-direction at upper module stiffeners
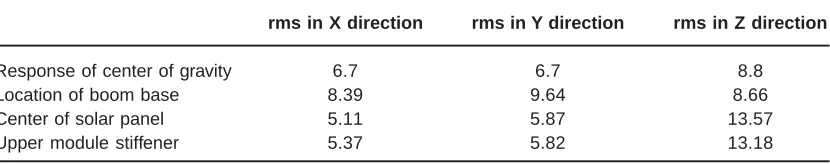
Figures 6 through 14 present response of satellite structure under random loading, at three measuring points in finite element model. One of the points is on the lateral side of the satellite on the solar panels, the other is placed on the gravitational gradient boom, and the last is on the upper module stiffener. These results are compared with the results of superposition technique. Table 4 presents the results at different points and center of gravity.
Considering Patran software results and the shape of main structure modes reveal the followings:
· Response in X direction: Table 2 shows that modes 1, 4, 19, 20 are the structure modes with high effective mass. Mode 1, with the maximum effective mass, is the global mode of the structure in the X direction. At this mode, the complete structure vibrates around the joint to the launcher in the X direction. Mode 4 is related to the boom
vibration on the middle plate, and modes 19 and 20 are related to the vibration of electronic box on the base plate. Because of higher mass, the boom and electronic box produce the maximum effect on the modal behavior of the satellite structure.
· Response in Y direction: modes 2 and 47 are the modes with high effective mass of the structure. Mode 2, with highest effective mode, is the global mode of the structure in Y direction. Mode 47 is related to the boom vibration on the middle plate.
is due to the local modes of the lateral plates, which is described in detail in Ref. [9].
Figures 3 through 5 show that the superposition method takes into account the main structure modes.
Consideration of local responses from Nastran-Patran software reveal the followings:
´ Response at the solar panels( at the joint to the top plate): In X and Y directions, behavior of the plates is similar to behavior of the center of gravity (with a smaller amplification factor). However, in Z direction, due to deformation of the lower module under the weight of the upper module, the solar panels experience large deformation at mode 11, which results in appreciable difference in the equivalent rms in this direction, which is in fact because of local behavior of the solar panels.
´ Response at the upper module stiffeners: Here again, a behavior similar to the center of gravity can be seen in X and Y directions. However, in Z direction, due to position of
Table 3: Power Spectral Density (PSD) of input in all
the three directions Freq (Hz) PSD X (g²/Hz)
20 0.008 50 0.02 125 0.22 135 0.22 145 0.16 200 0.16 2000 0.032 5000 0.032
Table 4: Results at different points and center of gravity
rms in X direction rms in Y direction rms in Z direction
Response of center of gravity 6.7 6.7 8.8
Location of boom base 8.39 9.64 8.66
Center of solar panel 5.11 5.87 13.57
Upper module stiffener 5.37 5.82 13.18
Response at the boom base
Consideration of response at the boom base indicates that behavior of this point provides a good approximation for behavior of the satellite at the center of gravity.
The analyses results show that behavior of center of gravity for this structure provides a good approximation for the overall behavior of the structure. However, slight local differences for this structure (such as difference at the solar panels) must be considered at the critical design stage, to
determine the applied loads on the installed components such as the satellite solar panels. These loads are the initial interface compatibility Document (ICD) between the satellite manufacturer and the producer of satellite equipment.
design stage, the results will not be radically different from the primary results.
Additionally, the analyses results show that a comparison of responses for the two methods can be used to determine suitable position for installation of the accelerometers for showing the frequency response (FRF) of the structure. For the structure under consideration, the results also indicate that the boom base is positioned at a suitable point on the structure. The test results and model updating at the later stages validate these results [10].
It is seen that responses of each node, derived from superposition technique and finite element method, are in good agreement. A survey through the mode shapes shows that major differences occur when the nodes behave as neutral modes at the specified frequency. The effect of localization of response can follow specially at higher modes. These fluctuations show that the selected node has its local mode shapes, which can vary due to the mesh distribution and element selection. And these results are directly related to the location of measurement points. The overall COG behavior of structure can be calculated using this simplified technique.
CONCLUSIONS
The mode superposition techniques are applied to calculate the frequency response of satellite structure. The effective mode selection criteria are applied based on the percentage of modal effective mass to extract the optimum selection criterion. The results are compared with finite element analysis of the structure in selected region. It is seen that the results of superposition technique are close to those calculating point that are placed near the center of gravity of structure. It means that the superposition technique can represent the overall behavior of structure in CoG. These results can be applied as an equivalent static load due to random excitation to the structures and can be reported as the overall behavior of structure to the launcher that can consider the small satellite as a concentrated mass with overall behavior like what is derived from the superposition technique.
The results can also be used for approximation of applied loads on the satellite structure at early stages of design and selection of suitable locations for installation of sensors for obtaining the frequency response function of the structure at the testing phase. For bigger structures, the local behavior can cause strong forces on the structural elements. Therefore, behavior of center of gravity will be a weaker approximation.
REFERENCES
1. Safarin, T.P., “Spacecraft Structures and
Mechanisms from Concept to launch”,
Microcosm, Inc.,(1997).
2. Miles, G.W., “On Structural Fatigue under
Random Loading”, J. Aeronautical Sciences, 753 (1954).
3. Plesseria, J.Y, Rochus, P. and Defise, J.M.,
“Effective modal masses”, 5th International
Congress of Theoretical and Applicational
Mechanics, France (2000).
4. Microsoft NASTRAN Theoretical Manual
(2005).
5. De Silva, “Vibration Fundamentals and
practice”, CRC Press (1999).
6. Wijker, J., “Mechanical Vibrations in
Spacecraft Design”, Springer (2004).
7. Emami, H., Farhani, F. and Safarabadi, M.,
“Influence of modal effective mass
distribution on the static and dynamic
behavior of a satellite structure under base
8. Guyan, J., “Reduction of stiffness and mass
matrices”, AIAA J., 3: 380 (1965).
9. “Cosmos Launch System”, Payload User’s
Manual 2.1 (1999).
10. Safarabadi, M. and Emami, H., “Study on the
validity of updating of finite element for a
micro satellite structure using random