http://www.sciencepublishinggroup.com/j/ijefm doi: 10.11648/j.ijefm.20180602.11
ISSN: 2326-9553 (Print); ISSN: 2326-9561 (Online)
A Longitudinal Categorization of US Airline Industry via
Dynamic Stock Return Method
Seong-Ho Cho
School of Business Administration, Hongik University, Seoul, Korea
Email address:
To cite this article:
Seong-Ho Cho. A Longitudinal Categorization of US Airline Industry via Dynamic Stock Return Method. International Journal of Economics, Finance and Management Sciences. Vol. 6, No. 2, 2018, pp. 35-42. doi: 10.11648/j.ijefm.20180602.11
Received: February 20, 2018; Accepted: March 11, 2018; Published: April 2, 2018
Abstract:
In this exploratory paper, the dynamic stock return method (DSRM) initially proposed as an effective and replicable method by [14], [4], [5], [6] is deliberately applied to the US airline industry over the period from 1979 to 1992 (14 years). The longitudinal categorization or strategic group (SG) results from the DSRM show good face validity. They are consistent with the industry’s fact-based historical progress. We also observe that the operational measures such as market share or productivity tend to support the grouping results. Furthermore, the results of 15- and 7-year analysis of relative closeness of stock responsive movements between two representative airline firms (American and Hawaiian airlines, respectively) could be inferred that the SGs derived from the DSRM are valid and robust over a longer time span. We conclude that the DSRM could be a good alternative instrument for the longitudinal study of industry substructure.Keywords:
Categorization, Strategic Group, Niche, Industry Substructure, Cluster, US Airline Industry, Longitudinal Structural Dynamics, Longitudinal Study1. Introduction
Although several empirical attempts have been made to analyze longitudinal dynamics of strategic groups (SGs) or distinctive categories within an industry [7]; [10], [11]; [12]; [8]; [3]; [15]; [16], their methods have been attacked by their known limitations such as statistical artifact and subjectivity [1]; [4], [5], [6]; [3]; [16]. In fact, the arbitrary choice of some critical strategic behaviors is not likely to produce objective and replicable categories or SG groupings. While the longitudinal analysis is required to capture and reflect any dynamic changes over time in critical strategic behaviors among member firms, furthermore, the conventional methods appear to fail to accommodate them properly [1]; [6]; [3]; [16]. Specifically, in the conventional methods it may not be easy to reconfigure persuasively the crucial strategic dimensions across different stable strategic time periods (SSTPs).
In this exploratory paper, the dynamic stock return method (DSRM) initially proposed as an effective and replicable method by [14], [4], [5], [6] is deliberately applied to the US airline industry over the period from 1979 to 1992 (14 years). There are three reasons for this. First, the US airline firms are
doing single business due to regulatory requirement. Second, the industry’s historical progress is well documented especially post to the critical event of its deregulation in 1978. Third, since deregulation the US airline industry has been very competitive and variant players have tried to survive in their own ways. Therefore, there could be various categories, SGs or niches within the industry.
In order to check the face validity, the SG clustering results derived from the DSRM are referenced to the industry’s historical progress over the 14 years of time period. As for the post analysis to see whether the categories found are supported, the operational measures such as market share and productivity are analyzed. As a case study of two representative airline firms (American and Hawaiian Airlines), their longitudinal relative closeness in their stock movements is measured over 15 and 7 years, respectively (due to data availability). The statistical results of 15- and 7-year analysis of relative closeness between two airlines could be inferred as the categories or SGs derived from the DSRM are valid and robust over a longer time span.
presented in section 4.
2. Method
2.1. Sample: US Airline Industry
The sample firms represent all the firms with SIC designation of 4511 or 4512 during the study period between 1979 and 1992. The sample of 30 airline firms is highly specialized in the airline business mainly because of legal constraints (although Worldcorp Inc. is obviously not an airline company, we decide to include it in the sample for the test purpose). The airline industry is particularly chosen because the industry’s historical progress is well documented post to its deregulation in 1978. The sample firms are listed in the New York or American Stock Exchanges and have complete stock returns of one year or 50 weeks over the sample period from 1979 to 1992 in the University of Chicago's Center for Research in Security Prices (CRSP) data tapes. The sample period of this study includes 171-month periods (1979-1992) after the signing of the Airline Deregulation Act in October 1978 when business environment became increasingly less regulated.
With gradual deregulation of the domestic US air transportation beginning in 1978, and the reduced involvement of the Civil Aeronautics Board in the industry, airlines have adopted quite different growth strategies and have adjusted their structures according to the new environment. Thus, we expect to observe industry-wide structural changes due to environmental changes in the years following the deregulation decision. For example, United Airlines has extended its route structure to nationwide resulting in significant changes in its route structure by mid-1979 (Business Week, 1980). In 1978, Alaska Airlines served only 10 Alaskan cities and Seattle, but shortly after the Deregulation, Alaska extended operations into California.
The first half of 1980s could be described as a period of tense competition amongst incumbents. Firms in the industry have explored various possibilities for survival in face of fierce competition and uncertainty. While new firms entered into the industry seeking for niches (i.e. geographical), existing firms (incumbents) tried to outperform though creative services and products. However, the successfully invented services and products were easily replicated by major competitors. An example would be the frequent fliers’ mileage program launched first by American Airlines in 1981. In the same year, United counters with its own program, followed by TWA, Delta, Northwest, and Continental. During the second half of the 1980s, on the other hand, there were a significant number of mergers and acquisitions in the airline industry. In 1986, the acquisition activities were especially significant. It can be referred as a period of consolidation from diversified variation during the first half of 1980s.
2.2. Variables
As suggested by [6], the variables used for clustering are the correlation coefficients of stock return residuals for each firm in the sample. Once the weekly stock return residuals (WARs) after eliminating systematic risk are obtained via market model, they are correlated between the sample firms each week to produce the correlation coefficient matrix between firms. Therefore, the between-firm correlation coefficient or rij
is a measure that summarizes the closeness of WAR movements between firm i and firm j over the time span.
The variables are regarded to capture magnitudes and directions of instaneous stock return movements reflecting disturbances over each sample year (s). In the sample of 30 firms, a complete set of 50, 100, 150, 250 weekly stock returns in the sample period from 1979 to 1992 are used for study.
2.3. Cluster Identification
Table 1. List of Sample firms (N=30).
COMPANY NAME BEG-END* SIC
AIRCAL INC 850102-870429 4511
AMERICAN AIR LINES INC 620702-921231 4511
ALASKA AIRGROUP INC 620702-921231 4511
ALOHA AIRLINES INC 791214-861226 4511
BRANIFF INT'L CORP 620702-820527 4511
BRITISH AIRWAYS PLC 870211-921231 4511
CONTINENTAL ARLNS HLDGS 780406-920320 4512
DELTA AIRLINES INC DE 620702-921231 4511
EASTERN AIRLINES INC 620702-861123 4511
FRONTIER AIRLINES INC 640415-851121 4511
HAWAIIAN AIRLINES INC 740523-921231 4511
JET AMERICAN ARLNS INC 841003-861226 4511
KLM ROYAL DUTCH ARLNS 620702-921231 4511
MGM GRAND INC 891213-921231 4512
MIDWAY AIRLINES INC 880609-911001 4512
NORTHWESTERN ARLNS INC 620702-890726 4511
OZARK AIRLINES INC 670508-860915 4511
PAN AM CORP 620702-910925 4511
PIEDMONT AVIATION INC 780925-871104 4511
COMPANY NAME BEG-END* SIC
SEABOARD WORLD ARLNS INC 620702-800930 4511
SOUTHWEST AIRLINES CO 751024-921231 4511
TIGER INT'L INC 620702-890215 4511
TRANS WORLD ARLNS INC 830303-881024 4511
UNITED AIR LINES CORP 620702-921231 4512
US AIR GROUP INC 620702-921231 4511
W T C INT'L NV 700709-870903 4511
WESTAIR HOLDING INC 881025-920529 4512
WESTERN AIRLINES INC 620702-861218 4511
WORLDCORP INC 670424-921231 4511
* BEG-END is the beginning and ending dates of CRSP’s available data. For instance, AirCal’s CRSP data is available from January 2, 1985 through April 29, 1987.
As suggested by the DSRM, Ward's minimum variance method is used for cluster analysis due to its superior performance. In order to evaluate its robustness against outliers, the outliers exceeding the 1, 3, 5, 7 percent limits were respectively deleted. Ward’s method produced the same SG results up to 5 percent deletions.1 As also proposed by the DSRM, we apply stopping rules of both Pseudo F statistic [2] and Pseudo T2 statistic [9].
2.4. Longitudinal SSTPsin the US Airline Industry
An SSTP is defined as time periods of homogeneity with regard to competitive strategic behavior [10]. As suggested by [6], in the DSRM an SSTP could be determined and identified by comparing pooled and unpooled clustering results over time. If the grouping structure of 1-year window, say, 1979 (unpooled) is similar with that of 2-year window or 1979-1980 (pooled), we use 1979-1980 as an SSTP. Otherwise, 1979 is regarded as a separate SSTP. As suggested by Cho [6], Bartlett’s test and Hoteling’s T2 test are used to check whether the pooled and unpooled clustering matrices are similar.
In our sample of US airline firms in 1979-1992, SSTP 1979-83,
SSTP 1984-88, SSTP 1988-92, and SSTP 1981-85 are further analyzed to
examine the evolutionary paths of SGs or niches within the industry. It is well known that the industry has gone through volatile structural changes including fierce competition due to regulatory deregulation (the first half of 1980s) and industry-wide mergers and acquisitions for consolidation (peak at 1986). During the period 1979-1983, the average number of firms in the industry was 16 which are 4 less than that of 1981-1985. In 1988-1992, there were only 10 airline firms in the industry after all. Around 1986, its industry-wide consolidation has been made through mergers and acquisitions. A comparison of the mean vectors using Hotelling’s T2 tests and variance-covariance matrices using Bartlett’s test shows statistically significant differences among the SSTP 1979-83, SSTP 1984-88, SSTP 1988-92, and
SSTP 1981-85. In Table 2, the longitudinal strategic groups in
SSTP 1979-83, SSTP 1984-88, SSTP 1988-92, and SSTP 1981-85 are
respectively presented.
1 With 1, 3, 5% deletions of outliers, the SG results are robust and classification power increases. Although they becomes less robust with 7% deletion, but the SG outcome is the same.
2.5. Post Analysis
As for post analysis, some representative firms are chosen from the evolutionarily persistent three strategic groups, namely, domestic leading group (American, United, Delta), foreign leading group (British, KLM), and niche group (Alaska, Hawaiian). Although the group memberships already show a high level of face validity, we would like to examine each group’s characteristics in terms of operational measures such as revenue, net income, and productivity. Further, this paper attempts to explore to measure the closeness of the evolutionary paths of two firms within an industry by analyzing the closeness of stock return movements as shown in the Method section.
In our exploratory paper, American Airlines and Hawaiian Airlines will be examined as representative firms mainly because they are distinguishable from the stand point of face validity. In order to analyze the longitudinal movements of other airline companies (i.e. Delta) relative to a representative firm, say, American Airlines (see table 6), we develop a grand summary statistic which summarizes stock movements between an airline company (i.e. Delta) and a representative firm (i.e. American) over the period of 1978 through 1992 or 15 years. A grand summary statistic is an average of annual coefficients for the 15 years, which measure the closeness of stock return movements over 50 weeks or one year. We use the average of annual coefficients for 15 years as a proxy for the closeness of the evolutionary paths of two firms. Similarly, Table 7 shows the result of the grand summary statistic of Hawaiian Airlines with respect to other airlines including Aloha.
3. Results
3.1. The Nature of the Clusters
According to the DSRM, there are 3 SSTPs in the 1979-1992 time horizon in the US airline industry, say, SSTP 1979-83, SSTP 1984-88, SSTP 1988-92 as exhibited in Table 2. These
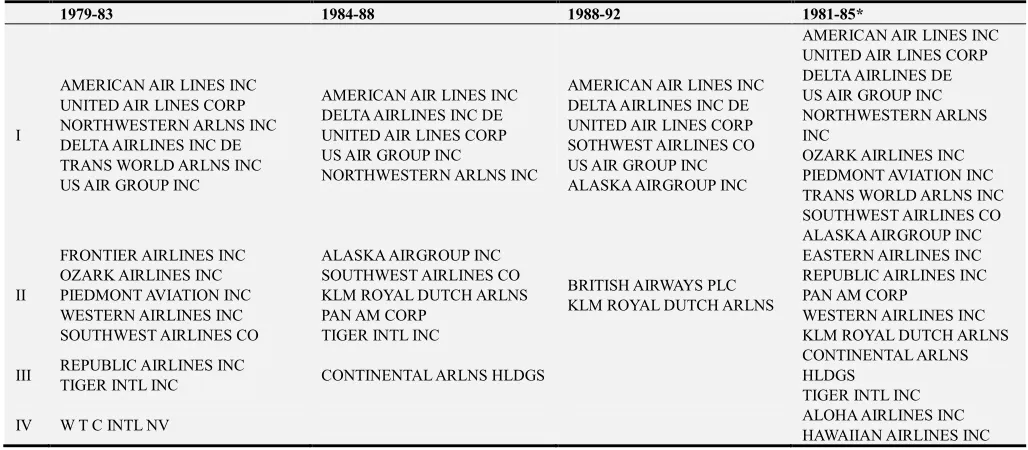
Table 2. Composition of the Derived Categories or SGs.
1979-83 1984-88 1988-92 1981-85*
I
AMERICAN AIR LINES INC UNITED AIR LINES CORP NORTHWESTERN ARLNS INC DELTA AIRLINES INC DE TRANS WORLD ARLNS INC US AIR GROUP INC
AMERICAN AIR LINES INC DELTA AIRLINES INC DE UNITED AIR LINES CORP US AIR GROUP INC
NORTHWESTERN ARLNS INC
AMERICAN AIR LINES INC DELTA AIRLINES INC DE UNITED AIR LINES CORP SOTHWEST AIRLINES CO US AIR GROUP INC ALASKA AIRGROUP INC
AMERICAN AIR LINES INC UNITED AIR LINES CORP DELTA AIRLINES DE US AIR GROUP INC NORTHWESTERN ARLNS INC
OZARK AIRLINES INC PIEDMONT AVIATION INC TRANS WORLD ARLNS INC SOUTHWEST AIRLINES CO ALASKA AIRGROUP INC
II
FRONTIER AIRLINES INC OZARK AIRLINES INC PIEDMONT AVIATION INC WESTERN AIRLINES INC SOUTHWEST AIRLINES CO
ALASKA AIRGROUP INC SOUTHWEST AIRLINES CO KLM ROYAL DUTCH ARLNS PAN AM CORP
TIGER INTL INC
BRITISH AIRWAYS PLC KLM ROYAL DUTCH ARLNS
EASTERN AIRLINES INC REPUBLIC AIRLINES INC PAN AM CORP
WESTERN AIRLINES INC KLM ROYAL DUTCH ARLNS
III REPUBLIC AIRLINES INC
TIGER INTL INC CONTINENTAL ARLNS HLDGS
CONTINENTAL ARLNS HLDGS
TIGER INTL INC
IV W T C INTL NV ALOHA AIRLINES INC
HAWAIIAN AIRLINES INC
As shown Table 2, in the SSTP 1979-83 which represents post
5-year period since 1978’s liberalization in the airline industry, the leader group includes American, United, Northwest, Delta, TWA and US Air (Category I). Some non-market leaders like Frontier, Ozark, Pedimont, Western and Southwest Airlines are grouped together (Category II), while Tiger and Republic are classified as another group (Category III).
In the consolidating period of 1984-1988 or SSTP 1984-88,
the leader group becomes more obvious (American, Delta, United, US Air, and Northwest) and the number of firms in the industry decreases from 21 to 12. Since 1986, mergers and acquisitions have become prevalent in the industry; in 1986, Continental bought People Express and Frontier Airlines, and Delta bought Los Angeles based Western Airlines; Alaska bought Long Beach-based Jet America Airlines and Seattle-based Horizon Air Industry; Northwest acquired Republic Airlines in 1987; American acquired Nashville Eagle Commuter Airlines. This period can be inferred as a consolidating period in which competitors survive through mergers and acquisitions of less competitive airlines (k-type) [13]. By 1987, the number of firms diminishes from 22 to 13.
In SSTP 1988-92 which is a period post to consolidation, overall
industry substructure stays stable. There seem 3 categories or SGs in the industry, namely, domestic leading group (American, Delta, United), foreign leading group (British, KLM), and niche group (Southwest, Alaska). One notable category is the niche group where the newcomers like Southwest and Alaska become successful in their unique ways successfully to serve their own category of consumers like price-sensitive buyers.
SSTP 1981-85, the categories or SGs in the period of 1981 to
1985 is additionally exhibited in the last column of Table 2 in the hope of detecting possible industry substructure turmoil
before the blast of M&A waves. In the SSTP1981-85, SGs look
chaotic after industry liberalization. Significantly, the number of firms competing in the industry has been maximized and thus competition has become more intense. More firms have entered into the airline market which used to be lucrative but restricted. Among the incumbents including market leaders, the competition became fiercer in the fight to increase or maintain market share. For example, American was the first to launch the frequent flyer program in 1981, using the SABRE system to keep track of clients’ mileages. However, this successful program was soon replicated by major competitors, and in the same year or 1981, United countered with its own program followed by TWA, Delta, Northwest, and Continental. SSTP1981-85, could be inferred as r-type
suggested by [13] in which competing firms in the industry explore various possible ways for survival or success under the increasingly competitive and uncertain environment.
Table 3. Sales of Representative Airlines in 1984-1992.
1984 1985 1986 1987 1988 1989 1990 1991 1992 Mean
American Airlines 5,354 6,131 6,018 7,198 8,824 10,480 11,720 12,887 14,396 9,223
United Airlines 6,218 5,306 7,119 8,305 8,982 9,794 11,037 11,663 12,890 9,035
Delta Airlines 4,264 4,684 4,460 5,318 6,915 8,089 8,582 9,171 10,837 6,924
Northwest 2,445 2,655 3,589 5,142 5,650 6,576 7,426 7,683 8,128 5,477
US Air 1,630 1,765 1,835 3,001 5,707 6,252 6,559 6,514 6,686 4,439
Continental Airlines, Inc. 1,372 1,944 4,407 8,626 8,552 6,650 6,184 5,487 5,494 5,413
Trans World Airlines 3,657 3,867 3,185 4,056 4,361 4,507 4,606 3,660 3,634 3,948
5,749
British Airways PLC - 2,036 4,511 5,245 7,091 7,184 7,971 8,632 9,069
KLM 1,618 2,310 2,637 3,002 2,792 3,386 3,426 4,290 4,549 3,112
Southwest Airlines 536 680 769 778 860 1,058 1,237 1,379 1,803 1,011
Alaska Airlines 362 433 468 710 814 917 1,047 1,104 1,115 774
Table 4 displays net incomes over the period of 1984 to 1992 for selected firms. On average, British ($279 million), American ($137 million), and Delta ($110 million) realize the largest net income in the industry. Southwest ($53 million) stays profitable even in the 1990s when most domestic firms are not doing well. Although United and Northwest achieve the largest market share in revenues, United and Northwest realize average net income (loss) of
$57 million and ($213 million), respectively. Like other major domestic airlines, they suffered big losses since 1990. Comparing the firms in groups in the period of 1988-1992 (Table 2), British is obviously separated from American and Delta although it achieves comparable revenue and net income. On the other hand, United, Northwest, and Southwest are grouped together with American and Delta, although in the lowest hierarchy within the group.
Table 4. Net Incomes of Representative Airlines.
1984 1985 1986 1987 1988 1989 1990 1991 1992 Mean
American Airlines 234 346 279 198 477 455 (40) (240) (475) 137
United Airlines 282 (49) 12 (4) 600 324 94 (332) (417) 57
Delta Airlines 176 259 47 264 307 461 303 (324) (506) 110
Northwest 56 73 77 103 135 75 (465) (488) (1482) (213)
US Air 122 117 98 195 165 (63) (454) (305) (601) (81)
Continental Airlines, Inc. 28 49 42 (466) (719) (908) (2403) (306) (125) (534)
Trans World Airlines 30 (208) (106) 45 250 (287) (274) (11) (318) (98)
British Airways PLC 120 280 238 285 295 405 166 443 279
KLM 84 122 148 169 175 178 (330) 68 (311) 32
Southwest Airlines 50 47 50 20 58 75 51 33 97 53
Alaska Airlines 24 26 18 13 37 43 16 10 (80) 12
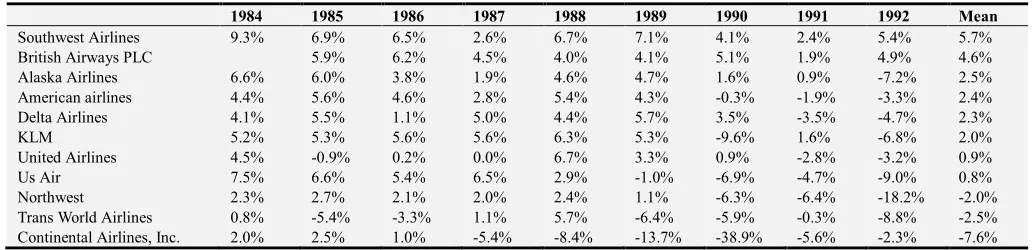
In order to see productivity in conjunction with net incomes, Table 5 presents Income as% of sales over the period of 1984 to 1992. Southwest (5.7%) and British (4.6%) are the most productive followed by Alaska (2.5%), American (2.4%), and Delta (2.3%). Other major domestic firms in the leader group show low to moderate productivity or less than 1%. Comparing the firms in groups in the period of 1988-1992 (Table 2), British is grouped together with KLM (2.0%), and is separated from Southwest.
Table 5. % Net Incomes of Revenues for Representative Airlines.
1984 1985 1986 1987 1988 1989 1990 1991 1992 Mean
Southwest Airlines 9.3% 6.9% 6.5% 2.6% 6.7% 7.1% 4.1% 2.4% 5.4% 5.7%
British Airways PLC 5.9% 6.2% 4.5% 4.0% 4.1% 5.1% 1.9% 4.9% 4.6%
Alaska Airlines 6.6% 6.0% 3.8% 1.9% 4.6% 4.7% 1.6% 0.9% -7.2% 2.5%
American airlines 4.4% 5.6% 4.6% 2.8% 5.4% 4.3% -0.3% -1.9% -3.3% 2.4%
Delta Airlines 4.1% 5.5% 1.1% 5.0% 4.4% 5.7% 3.5% -3.5% -4.7% 2.3%
KLM 5.2% 5.3% 5.6% 5.6% 6.3% 5.3% -9.6% 1.6% -6.8% 2.0%
United Airlines 4.5% -0.9% 0.2% 0.0% 6.7% 3.3% 0.9% -2.8% -3.2% 0.9%
Us Air 7.5% 6.6% 5.4% 6.5% 2.9% -1.0% -6.9% -4.7% -9.0% 0.8%
Northwest 2.3% 2.7% 2.1% 2.0% 2.4% 1.1% -6.3% -6.4% -18.2% -2.0%
Trans World Airlines 0.8% -5.4% -3.3% 1.1% 5.7% -6.4% -5.9% -0.3% -8.8% -2.5%
Continental Airlines, Inc. 2.0% 2.5% 1.0% -5.4% -8.4% -13.7% -38.9% -5.6% -2.3% -7.6%
3.2. Relative Closeness of Evolutionary Paths
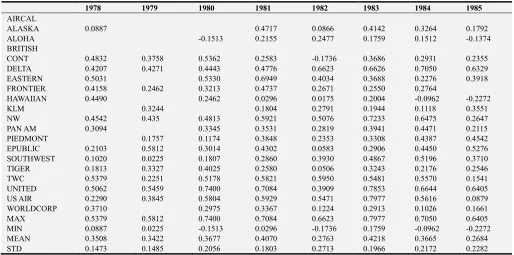
The closeness of the evolutionary paths of other airline firms relative to an anchor representative firm in the industry (American or Hawaiian Airlines) is examined over the
year. For example, 0.0887 in the first cell of the table is the correlation coefficient of stock returns between American Airlines and Alaska Airlines in 1978 (50 weeks). The coefficient is regarded as a measurement which summarizes closeness of stock return movements over 50 weeks or one
year. The last column in the table represents the average of the 15 annual coefficients. It can be interpreted as a grand summary statistic which summarizes stock movements between a firm and American Airlines over the period of 1978 through 1992 or 15 years.
Table 6. Summary Correlation Coefficients for Relative Closeness from the perspective of American Airlines (15 years).
1978 1979 1980 1981 1982 1983 1984 1985
AIRCAL
ALASKA 0.0887 0.4717 0.0866 0.4142 0.3264 0.1792
ALOHA -0.1513 0.2155 0.2477 0.1759 0.1512 -0.1374
BRITISH
CONT 0.4832 0.3758 0.5362 0.2583 -0.1736 0.3686 0.2931 0.2355
DELTA 0.4207 0.4271 0.4443 0.4776 0.6623 0.6626 0.7050 0.6329
EASTERN 0.5031 0.5330 0.6949 0.4034 0.3688 0.2276 0.3918
FRONTIER 0.4158 0.2462 0.3213 0.4737 0.2671 0.2550 0.2764
HAWAIIAN 0.4490 0.2462 0.0296 0.0175 0.2004 -0.0962 -0.2272
KLM 0.3244 0.1804 0.2791 0.1944 0.1118 0.3551
NW 0.4542 0.435 0.4813 0.5921 0.5076 0.7233 0.6475 0.2647
PAN AM 0.3094 0.3345 0.3531 0.2819 0.3941 0.4471 0.2115
PIEDMONT 0.1757 0.1174 0.3848 0.2353 0.3308 0.4387 0.4542
EPUBLIC 0.2103 0.5812 0.3014 0.4302 0.0583 0.2906 0.4450 0.5276
SOUTHWEST 0.1020 0.0225 0.1807 0.2860 0.3930 0.4867 0.5196 0.3710
TIGER 0.1813 0.3327 0.4025 0.2580 0.0506 0.3243 0.2176 0.2546
TWC 0.5379 0.2251 0.5178 0.5821 0.5950 0.5481 0.5570 0.1541
UNITED 0.5062 0.5459 0.7400 0.7084 0.3909 0.7853 0.6644 0.6405
US AIR 0.2290 0.3845 0.5804 0.5929 0.5471 0.7977 0.5616 0.0879
WORLDCORP 0.3710 0.2975 0.3367 0.1224 0.2913 0.1026 0.1661
MAX 0.5379 0.5812 0.7400 0.7084 0.6623 0.7977 0.7050 0.6405
MIN 0.0887 0.0225 -0.1513 0.0296 -0.1736 0.1759 -0.0962 -0.2272
MEAN 0.3508 0.3422 0.3677 0.4070 0.2763 0.4218 0.3665 0.2684
STD 0.1473 0.1485 0.2056 0.1803 0.2713 0.1966 0.2172 0.2282
Table 6. Continued.
1986 1987 1988 1989 1990 1991 1992 Mean
AIRCAL -0.0420 -0.0210
ALASKA 0.0681 0.2210 0.1913 0.3183 0.1516 0.1245 0.1319 0.2135
ALOHA 0.2764 0.1111
BRITISH 0.2767 -0.3479 0.2477 -0.0060 -0.0072 0.0327
CONT -0.0745 0.3856 0.2948 0.3337 0.0117 -0.0750 0.2324
DELTA 0.6026 0.5434 0.5996 0.5237 0.7729 0.5010 0.7178 0.5789
EASTERN 0.4461
FRONTIER 0.3222
HAWAIIAN 0.1133 -0.1641 0.0632
KLM 0.1858 0.2796 -0.0133 -0.0555 0.2727 0.0299 0.1752 0.1784
NW 0.6264 0.4355 0.4499 0.5107
PAN AM 0.1709 -0.0079 0.1674 0.2683 -0.0427 0.2406
PIEDMONT 0.4169 0.3192
EPUBLIC 0.3531
SOUTHWEST 0.0636 0.4576 0.3904 0.2533 0.1967 0.4366 0.3682 0.3019
TIGER 0.1232 0.0324 0.0825 0.1830
TWC 0.2624 -0.0315 0.3978
UNITED 0.7280 0.1496 0.4929 0.4710 0.2328 0.7025 0.7296 0.5659
US AIR 0.5038 0.4015 0.2889 0.1796 0.3155 0.4049 0.3937 0.4179
WORLDCORP 0.0940 -0.0076 -0.0327 -0.0379 -0.0179 -0.1066 0.0975 0.1197
MAX 0.7280 0.5334 0.5996 0.5237 0.7729 0.7025 0.7296 0.5789
MIN -0.1232 -0.0315 -0.0327 -0.3479 -0.0427 -0.1641 -0.0072 0.0327
MEAN 0.2610 0.2374 0.2657 0.1907 0.2141 0.1848 0.3258 0.2941
STD 0.2519 0.1976 0.1982 0.2528 0.2219 0.2860 0.2613 0.1590
From the perspective of American Airlines, as shown in Table 6, there are three firms, namely Delta, United, and Northwest, whose grand correlation coefficients are greater than 0.5, namely 0.5789, 0.5659 and 0.5107, respectively. Considering that it is a summary statistic over the 15 years,
United, nonetheless, the two airlines are clearly distinguishable from the large trunk airlines. Furthermore, American Airlines easily differentiates itself from small
regional airlines such as Alaska (grand coefficient of 0.2135), Aloha (0.1111), and Hawaiian (0.0632).
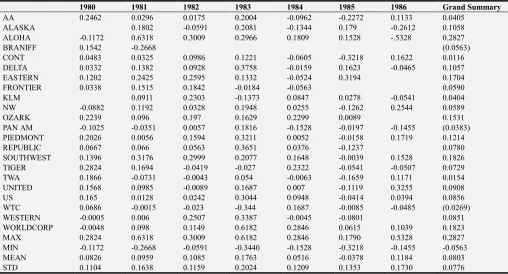
Table 7. Summary Correlation Coefficients for Relative Closeness from the perspective of Hawaiian Airlines (7 years).
1980 1981 1982 1983 1984 1985 1986 Grand Summary
AA 0.2462 0.0296 0.0175 0.2004 -0.0962 -0.2272 0.1133 0.0405
ALASKA 0.1802 -0.0591 0.2081 -0.1344 0.179 -0.2612 0.1058
ALOHA -0.1172 0.6318 0.3009 0.2966 0.1809 0.1528 -.5328 0.2827
BRANIFF 0.1542 -0.2668 (0.0563)
CONT 0.0483 0.0325 0.0986 0.1221 -0.0605 -0.3218 0.1622 0.0116
DELTA 0.0332 0.1382 0.0928 0.3758 -0.0159 0.1623 -0.0465 0.1057
EASTERN 0.1202 0.2425 0.2595 0.1332 -0.0524 0.3194 0.1704
FRONTIER 0.0338 0.1515 0.1842 -0.0184 -0.0563 0.0590
KLM 0.0911 0.2303 -0.1373 0.0847 0.0278 -0.0541 0.0404
NW -0.0882 0.1192 0.0328 0.1948 0.0255 -0.1262 0.2544 0.0589
OZARK 0.2239 0.096 0.197 0.1629 0.2299 0.0089 0.1531
PAN AM -0.1025 -0.0351 0.0057 0.1816 -0.1528 -0.0197 -0.1455 (0.0383)
PIEDMONT 0.2026 0.0056 0.1594 0.3211 0.0052 -0.0158 0.1719 0.1214
REPUBLIC 0.0667 0.066 0.0563 0.3651 0.0376 -0.1237 0.0780
SOUTHWEST 0.1396 0.3176 0.2999 0.2077 0.1648 -0.0039 0.1528 0.1826
TIGER 0.2824 0.1694 -0.0419 -0.027 0.2322 -0.0541 -0.0507 0.0729
TWA 0.1866 -0.0731 -0.0043 0.054 -0.0063 -0.1659 0.1171 0.0154
UNITED 0.1568 0.0985 -0.0089 0.1687 0.007 -0.1119 0.3255 0.0908
US 0.165 0.0128 0.0242 0.3044 0.0948 -0.0414 0.0394 0.0856
WTC 0.0686 -0.0015 -0.023 -0.344 0.1687 -0.0085 -0.0485 (0.0269)
WESTERN -0.0005 0.006 0.2507 0.3387 -0.0045 -0.0801 0.0851
WORLDCORP -0.0048 0.098 0.1149 0.6182 0.2846 0.0615 0.1039 0.1823
MAX 0.2824 0.6318 0.3009 0.6182 0.2846 0.1790 0.5328 0.2827
MIN -0.1172 -0.2668 -0.0591 -0.3440 -0.1528 -0.3218 -0.1455 -0.0563
MEAN 0.0826 0.0959 0.1085 0.1763 0.0516 -0.0378 0.1184 0.0803
STD 0.1104 0.1638 0.1159 0.2024 0.1209 0.1353 0.1730 0.0776
Table 7 presents the longitudinal movements of airline firms from the perspective of Hawaiian Airlines over the period from 1980 through 1986 (stock return data for the Hawaiian Airlines are not available for other years). As shown in Table 7, Aloha Airlines has the highest grand correlation coefficient of 0.2827. The average of the grand correlation coefficients is 0.0803. It is much lower than that of American Airlines or 0.2941 (see Table 6). This fact may imply that Hawaiian Airlines is a niche- -pursuing airline company and that their stock returns would be affected (and move) differently from those of major Airlines companies like American, Delta, and United.
4. Discussion and Conclusion
In order to fulfill the imperative need to develop an objective and replicable method to analyze longitudinal dynamics of categories or SGs in an industry, in this paper, the DSRM is applied to the US airline industry over the period of 1979 to 1992 just after a significant event of industry deregulation in 1978. While the validity of derived categories is checked via the documented industry history, the relative closeness of stock movements between two representative firms (American and Hawaiian Airlines) is further analyzed over the 7- and 15-year time period, respectively.
In our particular sample of US airline industry, the clustering results found show a high level of face validity and
confirm the industry’s fact-based historical progress. As shown in Table 2, during the period of 1979-1985 the number of firms in the industry increases and the industry leader group does not always include only obvious leading firms such as American, Delta, and United. On the other hand, during the period of 1986-1992, the number of firms in the industry decreases to 10 and the industry substructure become very consistent (see 3rd and 4th 4 columns in Table 2). It appears that the industry liberalization has created lower entry barriers to the industry and thus has caused fierce competition among the firms in the industry (r-type). Consequently, less competitive firms become obsolete, and die out. Competitive firms became more competitive through acquiring less competitive firms (k-type). Niche-specific firms who are efficient survive even in the most competitive environment. In the long run, the firms decrease in number, and the competition has become more intense since deregulation. These facts confirm the paradigm of Industrial Organization of Economics that industrial liberalization is better than restricted industry monopoly from the perspective of social welfare because competition drives firms to be efficient.
exhibited in Table 7, Hawaiian Airlines has the highest grand correlation coefficient of 0.2827 with Aloha Airlines. Considering that it is a summary statistic over the longer time period like 7 or 15 years (ranging from -1 to 1), it seems a surprising result.
Based upon the findings above, we draw a conclusion from this study. The DSRM can effectively identify industry SGs or categories even over a very longer period, say, even 14 year time span. Since derived SGs are obtained through a stylized method with market data, the DSRM is likely to be a replicable method, which enables us to analyze longitudinal
dynamics in industry categorization. The evidences from the representative airline industry in 1979-1992 appear to confirm that the longitudinal industry categorization can be done reliably and meaningfully through the DSRM.
The major limitation of the DSRM would be that diversified firms across industries may not be suitable for clustering. In order to empirically find industry subgroups, nonaggregate group common effects should be detected, not aggregate effects. Nonetheless, we believe that the DSRM may resolve meaningful issues in the field of strategy. Future research includes applying the DSRM to conduct a longitudinal analysis over a long-term time horizon over various industries. It would be particularly interesting to look into the locus of groups' or group members' structural moves. Some additionally important issues in this avenue of research would include the following; the relationship between SG membership and its profitability over time; the locus of structural changes; the presence of first-mover or competitive advantages; and the sustainability of these advantages over a long-term period. Some of these future issues could be hopefully resolved by using the DSRM.
Acknowledgements
SHC would like to thank Bill McKelvey at UCLA for his valuable comments and support for his dissertation from which the article came. SHC also wishes to thank the Hongik University for their research fund for this study (research project NO: P212017).
References
[1] Barney, J. B., and R. E. Hoskisson (1990), “Strategic groups: Untested assertions and research proposals”, Managerial and Decision Economics, 11, pp 187-198.
[2] Calinski, R. B., and J. Harabasz (1974), “A dendrite method
for cluster analysis,” Communications in Statistics, 3: 1-27. [3] Cattani, G., J. F. Porac, and H. Thomas (2017), “Categories
and Competition”, Strategic Management Journal, 38, pp. 64-92.
[4] Cho, S-H (2007), “On the Stock Return Method to Determining Industry Substructure: The Case of Airline, Banking, and Oil Industries,’ Journal of Strategic Management, 10:41-70.
[5] Cho, S-H (2011), “Detecting Industry Substructure via Stock Return Method: NASDAQ Electronics Firms”, Journal of Strategic Management, 14 (1):77-103.
[6] Cho, S-H (2017), “On the Dynamic Stock Return Method to Analyzing Longitudinal Industry Substructure”, Working Paper, Hongik University.
[7] Cool, K., and D. Schendel (1987), “Strategic group formation and performance: The case of the U.S. pharmaceutical industry”, Management Science, 33, pp. 1102-1124.
[8] DeSarbo, W. S., R. Grewal, and R. Wang (2009), “Dynamic strategic groups: deriving spatial evolutionary paths”, Strategic Management Journal, 30 (13), pp. 1420–1439.
[9] Duda, R. O., and P. E. Hart (1973), Pattern Classification and Scene Analysis, Wiley, New York.
[10] Fiegenbaum, A., and H. Thomas (1993), “Industry and strategic group dynamics: competitive strategy in the insurance industry, 1970-84. Journal of Management Studies, 30 (1): 69-97.
[11] Fiegenbaum, A., and H. Thomas (1995), “Strategic groups as reference groups: Theory, modeling and empirical examination of industry and competitive strategy”, Strategic Management Journal, 16 (6), pp. 461–476.
[12] Mas-Ruiz, F., J. Nicholau-Gonzalbez, and F. Ruiz-Moreno (2005), “Asymmetric Rivalry between Strategic Groups”, Strategic Management Journal, 26, pp. 713-745.
[13] McKelvey, Bill (1982), Organizational Systematics, University of California, Berkeley, CA.
[14] Ryans A. B., and D. R. Wittink (1985), “Security returns as a basis for estimating the competitive structure in an industry”, in H. Thomas and D. Gardner (Eds.), Strategic Marketing and Management, Wiley, New York.
[15] Suarez FF, Grodal S, and A. Gotsopolous (2014), “Perfect timing? Dominant category, dominant design, and the window of opportunity for firm entry”. Strategic Management Journal, 36: 437–448.