R E S E A R C H
Open Access
Quantitative assessment of microglial morphology
and density reveals remarkable consistency in the
distribution and morphology of cells within the
healthy prefrontal cortex of the rat
Ratchaniporn Kongsui
1,2,3, Sarah B Beynon
1,2,3, Sarah J Johnson
4and Frederick Rohan Walker
1,2,3,5*Abstract
Background:Microglial morphology within the healthy brain has been the subject of a number of observational
studies. These have suggested that microglia may consist of separate classes, which possess substantially different morphological features. Critically, there have been no systematic quantitative studies of microglial morphology within the healthy brain.
Methods:We examined microglial cells within the adult rat prefrontal cortex. At high magnification, digital reconstructions of cells labelled with the microglial-specific marker ionized calcium-binding adapter molecule-1 (Iba-1) were made in each of the cortical layers. These reconstructions were subsequently analyzed to determine the convex hull area of the cells, their somal perimeter, the length of processes, the number of processes, the extent of process branching and the volume of processes. We additionally examined whether cells’morphological features were associated with cell size or numerical density.
Results:Our analysis indicated that while there was substantial variability in the size of cells within the prefrontal cortex, cellular morphology was extremely consistent within each of the cortical layers.
Conclusions:Our results provide quantitative confirmation that microglia are largely homogenous in the uninjured rodent prefrontal cortex.
Keywords:Iba-1, Microglia, Morphology, Prefrontal cortex
Background
To date, the majority of morphological characterization of microglia has occurred in situations of extensive neuroin-flammation (Alzheimer’s disease, Parkinson’s disease, trau-matic brain injury and stroke) [1-7]. Accordingly, our current understanding of microglial form has been heavily influenced by the study of these cells in their reactive state. By comparison, there is relatively little information con-cerning the morphological characteristics of microglia in the nondiseased brain. Such information, however, may be of considerable importance, given emerging evidence of
the cells’ involvement in synaptic modelling within the healthy brain [8-13].
Several recent studies have indicated that normal envir-onmental challenges, for instance changes in sensory ex-perience or exposure to stress, can provoke structural remodelling of ramified microglia in the absence of any notable inflammatory disturbance [10,14]. These changes draw attention to the richness of microglial morphological transformation within the healthy brain [15]. Presently, however, no wholly quantitative studies have been under-taken to identify definitively what the typical properties of microglia are in the rodent. A long history of detailed obser-vational studies of microglial morphology describe widely varying cellular structures. Particularly notable amongst these, Lawsonet al.[16] described clear regional differences in microglial morphology, describing the occurrence of * Correspondence:[email protected]
1
School of Biomedical Sciences and Pharmacy, University of Newcastle, Callaghan, NSW, Australia
2
Priority Research Centre for Brain and Mental Health Research, University of Newcastle, Callaghan, NSW, Australia
Full list of author information is available at the end of the article
compact (round, short processes), longitudinally branched (long primary processes) and radially branched (tortuous processes with secondary branching) microglia. Lawson et al.did also note that microglia in each of these classes differed somewhat in area and perimeter across each of the regions examined. Velaet al.[17], examining the rep-resentation of microglial forms across the mammalian cerebellum, observed that microglial morphology varied according to the cells’extracellular environment. Their re-search suggested that microglial structure might vary in a manner that is dependent upon the synaptic activity within a given region, with white matter containing flat-tened microglia, whose processes extended parallel to the axon projections, and cerebellar nuclei accompanied by highly branched microglia that extended in all directions. In one of the few studies to examine microglia quantita-tively, Jinnoet al.[18] identified that microglia appear to be homogenously distributed within the hippocampus of the adult rat. A more recent study by Yamada and Jinno [19] is the first to classify microglia on the basis of quanti-tative measurements. Following hypoglossal axotomy, the authors grouped microglia according to discrete morpho-logical measurements, revealing that compromised neural tissue contains microglia that progress from highly rami-fied to compact, thickened processes. However, their model focused on microglial structure following injury, which would likely have different characteristics from that of the uninjured brain. Collectively, these studies have suggested that ramified microglia may fall into distinct categories based on their morphology and may differ sig-nificantly in their form in a location dependent manner.
Recently, Torres-Platas et al. [20] published the first detailed quantitative neuroanatomical examination of microglia in the human prefrontal cortex and also found evidence of distinct morphological phenotypes. Specifically, the authors identified four classes of microglia: classically ramified microglia; primed microglia (wider cell body with standard ramified processes); reactive microglia (wider cell body, few ramified processes), and amoeboid microglia. The authors also undertook an observational analysis of mouse microglia and identified a significantly higher level of consistency, with the majority of cells being of the ramified phenotype.
Given Torres-Plataset al.’s recent findings, it is of con-siderable interest to understand how microglia within the prefrontal cortex of the rat, one of the most commonly used laboratory species, compares with that observed in the human brain. Accordingly, we undertook a detailed quantitative analysis of microglia within the prefrontal cor-tex of healthy adult rats. To examine changes in the rat prefrontal cortex, we immunohistochemically identified microglia, in coronally sectioned tissues, using ionized calcium-binding adapter molecule-1 (Iba-1) labelling. Iba-1 is a 17 kDa EF hand protein that plays a critical role in the
bundling of F-actin, and is centrally involved in cytoskeletal reorganization [21]. As such, Iba-1 represents an excellent labelling target to examine morphological changes in microglia, and has been used extensively for this purpose [18,22,23]. We created digital reconstructions of Iba-1-labelled microglia from the adult rat prefrontal cortex. Once reconstructed, we examined differences in cellular area, perimeter, process number, process length, process volume, soma size and fractal complexity by assessing overall changes and using Sholl analysis. We further exam-ined differences in metrics within the entire prefrontal cor-tex and across layers (I to VI). We identified substantial differences in the area occupied by microglia throughout the prefrontal cortex. As we have previously observed that psychological stress can differentially influence large and small microglia, we also further investigated the relation-ship between cell area and each of the listed metrics (length, process volume, and so on) [14]. Our results pro-vide the first comprehensive quantitative mapping of microglial morphology in the rat prefrontal cortex, and extensively substantiate previous observational work.
Methods Ethics statement
Experiments were approved by the University of Newcastle Animal Care and Ethics Committee and were conducted in strict accordance with the NSW Animal Research Act and Australian code of practice for the use of animals for scientific purposes.
Experimental animals
Adult male Sprague-Dawley rats (N=10; 350 to 450 g; 70 days old) were obtained from the Animal Resource Centre (Perth, Western Australia). Animals were acclimatized for 1 week in individual cages in temperature-controlled animal holding rooms (21 ± 1°C) on a 12 h reverse light-dark cycle (lights on at 19:00).
Tissue processing and immunohistochemistry
Animals were deeply anaesthetized with sodium pentobar-bital and transcardially perfused via the ascending aorta with 2% sodium nitrite followed by 4% ice-cold parafor-maldehyde. Brains were removed and post-fixed overnight in the same fixative and then placed into 12.5% sucrose for cryoprotection. Brains were cut into 30μm sections using a freezing microtome (Leica, Germany).
between Bregma coordinates +2.2 and +3.2 (anterior-posterior) as containing the prefrontal cortex (Figure 1A; [25]). Within this region the cortex was divided further into its five layers according to cortical depth from the pial surface: Layer I, 17.8%; Layer II, 27.9%; Layer III, 46.6%; Layer V, 73.0%; and Layer VI, 100% (Figure 1B; [26,27]).
Microglial reconstruction
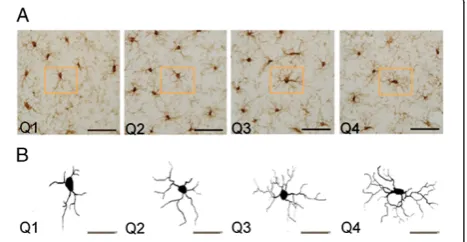
Microglia in the prefrontal cortex were reconstructed using a computer-assisted morphometry system consist-ing of a Zeiss Axioskop photomicroscope equipped with an MAC 6000 XYZ computer-controlled motorized stage and joystick with focus control (Ludl Electronic Products, NY, USA), a Q Imaging video camera (MBF Biosciences, VT, USA), and Neurolucida morphometric software (MBF Biosciences, VT, USA). Microglia were visualized and reconstructed under a Zeiss Axio Plan ob-jective (NEOFLUAR × 100 obob-jective with a numerical aperture of 1.3 under oil immersion) using Neurolucida software (Figure 1A. Only microglia that displayed intact processes unobscured by background labelling or other cells were included in reconstructions. Microglia were traced throughout the entire thickness of the section, and trace information was then rendered into a 2-dimensional diagram of each cell (Figure 1B). Five cells per region were randomly selected for a total of 250 cells included for analysis. Cells were ranked in quartiles ac-cording to overall cell size (Q1 = 709.92 to 1,059.68μm2; Q2 = 1,097.23 to 1,489.34μm2; Q3 = 1,510.63 to 2,027.75
μm2; Q4 = 2,036.26 to 3,784.34μm2).
Analysis of reconstructed cells
NeuroExplorer software (MBF Biosciences, VT, USA) was used to generate metric analyses of reconstructed microglia. The cell body perimeter, number of primary processes, number of nodes (branch points), total length of all processes, and total volume of all processes were measured. The area encompassed by the entire cell was
measured as the convex hull area, determined from the polygon created from straight lines connecting the most distal points of the microglial processes. A box counting protocol determined the fractal dimension of each cell (k-dim) to determine how fully the cell occupied its con-vex hull area [28]. To account for changes in the cell’s complexity in relation to distance from the cell soma, Sholl analyses were performed for each microglial cell. Concentric circles (radii) were spaced 5 μm apart, ori-ginating from the soma [29]. The number of branch points (nodes) and processes that intersected the radii, and process length, surface area, volume and average diameter were measured as a function of the distance from the cell soma for each radius.
Absolute cell counts and density estimates
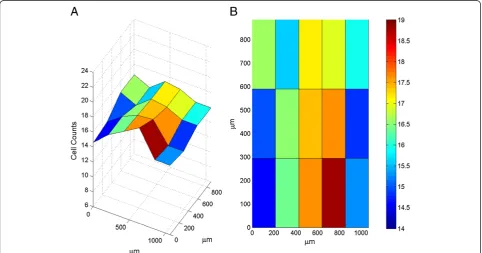
Microglia numbers were exhaustively counted in three sections containing the prefrontal cortex. The region was defined as before, and consisted of the region be-tween the forceps minor and the pial surface, approxi-mately 1 mm in width, and extending in height for 1 mm from the base of the forceps minor to the border with the prelimbic cortex, at Bregma coordinates +2.5, +2.7 and +2.9 (anterior-posterior), according to Paxinos and Watson [25]. The left hemisphere from each section was imaged on a Zeiss Axioskop with Zeiss Axio Plan objective (Neofluor 10× objective) to contain the entire region within one field of view, and converted to a bin-ary image using Metamorph software (MDS Analytical Technologies, version 7.5.4.0, CA, USA). Each microglial cell within the region was counted and marked to yield x-y coordinates of each cell. Cellular coordinates were then extracted and processed in MatLab (Version 7.9.0.529 (R2009b), Mathworks, Inc.). The prefrontal cortex was divided into a grid of three by five equally sized rectangles, and the number of cells in each one counted. These counts were then used to generate heat maps illustrating the cellular distribution. Overall cellu-lar density measurements were calculated using the formula:
D¼XQ=ðATÞ;
where ∑Q is the total number of cells in the prefrontal cortex,Ais the area of the prefrontal cortex andTis the section thickness.
Statistical analysis
Group averages for microglia from each cortical layer were compared using one-way analysis of variance (ANOVA) followed by post-hoc testing with Bonferroni’s correction. Sholl analyses for microglia grouped by cortical layer or size were compared using one-way ANOVA of group means followed by post-hoc testing. An overall group effect
was determined using the trapezoidal area under each Sholl curve. Bivariate correlations were calculated for mor-phological parameters according to convex hull area. All statistical work was performed in IBM SPSS Statistics ver-sion 19.
Results
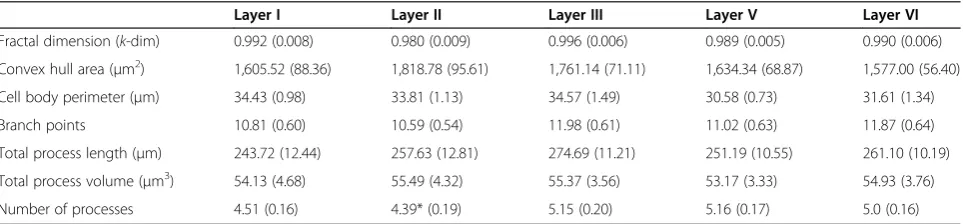
Microglial cells displayed remarkably consistent morph-ologies across all cortical layers, with only a few signifi-cant variations in structure. Indeed, the only difference we observed was that Layer II microglia possessed sig-nificantly fewer processes than microglia in Layer III or V (Table 1). The microglia within the prefrontal cortex otherwise appeared to be relatively homogenous, on average exhibiting between four and five primary pro-cesses that branched on average two times each.
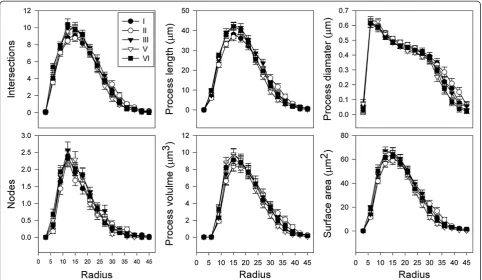
Sholl analysis of microglial cells from cortical layers of the prefrontal cortex did not reveal any further varia-tions in morphological characteristics (Figure 2). In all layers, microglia followed a similar pattern where the highest degree of branching and the largest, thickest processes were located approximately 10 to 20 μm from the soma. After this point, these features steadily de-creased the farther they travelled from the microglial cell body. Furthermore, for all microglia, processes displayed the largest diameter at the most proximal position to the soma, and then tapered towards the distal ends. No overall group differences between layers were detected.
Our frequency analysis of convex hull areas indicated that while the size distribution was considerable (800 to 3,800μm2), the distribution was unmistakably unimodal (Figure 3). However, as previous research had indicated that microglial cell size can differentially influence cellu-lar morphology in response to environmental challenges [14], we investigated whether the size of microglial cells impacts structural characteristics in the normal brain. Correlation of microglial size with morphological param-eters revealed significant correlations with cell complex-ity, branch points, total process length and total process volume (Figure 4). Thus, larger cells tended to have
larger, thicker and more branched processes; overall, a higher degree of complexity and ramification. Despite these changes, soma size and the number of pri-mary processes were consistent regardless of cell size (r= 0.0033,r= 0.0116, respectively).
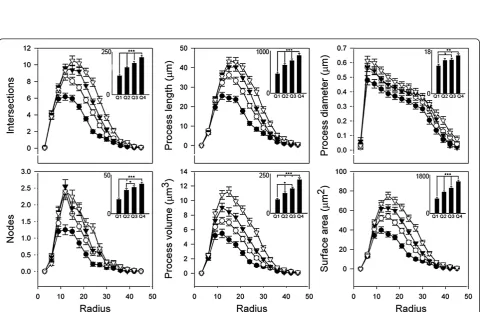
We next performed a Sholl analysis of microglial struc-tural characteristics according to their size. Microglia were assigned to a quartiles 1 to 4 (Q1 to 4) based on convex hull area, with Q1 representing the smallest cells and Q4 representing the largest. Larger cells tended to have in-creased measurements for all parameters (Figure 5). To assess group differences, the trapezoidal area under each Sholl curve was calculated. Large cells possessed signifi-cantly more branch nodes and intersections, and their processes were longer and thicker, and possessed greater surface area than their smaller counterparts (Figure 5). Cells falling in quartiles 2 and 3 were most similarly struc-tured, with significant differences only reaching P <0.05 for branch nodes, process volume and process diameter. The smallest microglia were least complex, with thin, short and relatively unbranched processes. Thus, the cor-relation between complexity and cell size appears to stem from process characteristics and not the overall number of processes or size of the cell body.
To characterize the distribution of microglial cells across the prefrontal cortex, we performed an exhaustive count of all microglial cells at Bregma +2.9 mm (anter-ior-posterior). Densities of microglia within each cortical layer were then calculated (Table 2). Layer I microglial density was significantly less than Layer V density (P< 0.05); otherwise, no significant differences were ob-served (Figure 6). As microglial density has been shown to vary inversely with microglial size [18], we investi-gated the relationship between microglial density and morphology. No significant correlations were revealed, with the exception of an inverse relationship between Layer VI microglial density and fractal complexity (r2= 0.4646; P <0.05). Interestingly, no significant rela-tionships between density and size were observed for any of the cortical layers.
Table 1 Morphological characteristics of forebrain microglia
Layer I Layer II Layer III Layer V Layer VI
Fractal dimension (k-dim) 0.992 (0.008) 0.980 (0.009) 0.996 (0.006) 0.989 (0.005) 0.990 (0.006)
Convex hull area (μm2) 1,605.52 (88.36) 1,818.78 (95.61) 1,761.14 (71.11) 1,634.34 (68.87) 1,577.00 (56.40)
Cell body perimeter (μm) 34.43 (0.98) 33.81 (1.13) 34.57 (1.49) 30.58 (0.73) 31.61 (1.34)
Branch points 10.81 (0.60) 10.59 (0.54) 11.98 (0.61) 11.02 (0.63) 11.87 (0.64)
Total process length (μm) 243.72 (12.44) 257.63 (12.81) 274.69 (11.21) 251.19 (10.55) 261.10 (10.19)
Total process volume (μm3) 54.13 (4.68) 55.49 (4.32) 55.37 (3.56) 53.17 (3.33) 54.93 (3.76)
Number of processes 4.51 (0.16) 4.39* (0.19) 5.15 (0.20) 5.16 (0.17) 5.0 (0.16)
Discussion
This study is the first to systematically quantify microglial morphology within the prefrontal cortex of healthy adult rats. The most striking finding to emerge from this study is the remarkable consistency of microglial morphology across each of the cortical layers (I to VI). Despite this lam-inar consistency, microglia were found to vary substantially
with respect to the area that they occupy within the paren-chyma (ranging from 800 to 3,800 μm2). Indeed, analysis of the morphological properties of microglia based on size revealed some intriguing phenomena. For instance, while a strong positive relationship was observed between the overall area of the microglial cell and the magnitude of cer-tain morphological features, not all characteristics were af-fected equally. Similarly, when we compared the properties of cells grouped in quartiles according to area, our analysis revealed that the averages for each quartile did not always change in a graduated pattern. Collectively, these results in-dicate that while the morphology of microglia appear quite homogenous‘on average’, there are clear morphological dif-ferences, particularly with respect to size, that suggest the existence of some degree of cellular specialisation.
Absolute microglial cell counts provided important population information regarding cell representation within the prefrontal cortex. Astroglial cells (positive for glial fibrillary acidic protein) are known to exhibit strong medial-lateral differences within the prefrontal cortex, however, microglial cells have never been examined in the naïve prefrontal cortex in this way [18]. We found no difference in microglial cell number in either the medial-lateral or the anterior-posterior directions in the prefrontal cortex. Our observations demonstrate that the distribution of microglia within the prefrontal cortex is
Figure 2Microglial morphology is consistent across cortical layers of the prefrontal cortex.Sholl analysis of microglia according to cortical layer location yielded regular patterns of morphological characteristics. Maxima for all measures were observed approximately 15μm from the soma, followed by steady tapering in size and complexity. Values are expressed as mean ± standard error of the mean.
Figure 4Microglial size affects the extent of ramification.Bivariate correlation of morphological characteristics with overall microglial cell size revealed that increasing cell size directly correlated with an increase in process size and complexity. *P<0.05.
relatively homogenous in the absence of injury or in-flammation. From a functional perspective, this form of dispersion is consistent with the increasingly popular view that microglia actively survey their environment, and their arrangement at regularly-spaced intervals per-mits efficient monitoring [9,12].
To assess microglial morphology, we created high-resolution digital reconstructions of Iba-1-labelled microglia, in order to provide the greatest sensitivity to their intricate morphological features [30]. With respect to our analysis in this study, we identified that the fractal dimension, convex hull area, cell body perimeter, num-ber of branch points, total process length, total process volume and total numbers of processes were remarkably consistent on average across each of the cortical layers. Similarly, our Sholl analysis (that is, our assessment of the morphological differences in relation to the radial distance from the soma) of each of the measured mor-phological parameters was also remarkably consistent
across layers. While this latter finding might have been predicted by consideration of the averages alone, it was in principle possible for each of the metrics to peak at different points across the layers, a situation that would have had no influence on the averages. Thus, it seems reasonable to conclude that the morphology of microglia across each of the cortical layers is extremely similar. It also appears possible to conclude, given this consistency, that the density of cells does not meaningfully alter the morphological properties of cells in this region.
One result that was of particular note was the between-cell variability in overall (convex hull) area, which ranged from 800 to 3,800μm2. Such size variabil-ity has not been previously reported. Our analysis of the distribution of cell areas revealed an unmistakably Gaussian curve, with the majority (68%) of cells posses-sing an area of 1,130.94 to 2,231.05 μm2. We expected that each of the cells’ morphological characteristics (process number, process length, and so on) would Table 2 Number and density of microglia in the forebrain
Bregma (anterior-posterior) Single section count (cells) Density (cells/μm3)
+2.5 257.90 (7.28) 9.55 (0.27)
+2.7 244.60 (5.65) 9.06 (0.21)
+2.9 246.20 (4.87) 9.12 (0.18)
Microglia were exhaustively counted within the prefrontal cortex at each Bregma level to yield counts within a single section. Densities were calculated for the volume between one Bregma level and the next. Values represent means (± standard error of the mean).
correlate with the overall area of the cell, as observed in microglia from brains post-injury [31]. Surprisingly, this was true for some metrics but not others. Specifically, we observed a very strong positive correlation between microglial process length (r= 0.8624) and branch num-ber (r= 0.6583) with the cells’overall area. In contrast, there was no observable relationship between microglial area and the cells’somal perimeter, fractal complexity, or the number of primary processes. Our Sholl analysis, on the basis of cells grouped by quartile according to their area, showed a strong relationship between microglial process length, branch number and branch volume with the cells’overall area.
Perhaps one of the more interesting findings to emerge from this analysis is the relative comparisons that are now possible between rat and human microglia. For instance, Torres-Plataset al.[20] identified that ramified microglia in the human prefrontal cortex have on average 5.8 (±0.5) primary processes (that is, those that emerge from the cell body), and we have determined that there are approxi-mately 5 (±0.2) for the rat. This result is striking in its similarity. However, other metrics do not align as closely. For instance, the extent of primary process branching would appear to be much higher in the human prefrontal cortex, with an average of 46 branch points being ob-served for the human parenchymal microglia, whereas the average in the rat is only 16. Consistent with this finding, the cumulative length of branches in the human pre-frontal cortex is much higher: 590μm versus an average of approximately 250μm for the rat. It is, certainly, tempt-ing to speculate, given recent findtempt-ings concerntempt-ing the role of microglia in monitoring synaptic junctions, that the higher levels of branching in human microglia might be associated with increased neuronal number and synaptic density in our species [9,10,32].
This study significantly advances understanding of microglial morphology within the cerebral cortex. Micro-glia from the healthy brain have been previously described as belonging to either a compact, longitudinally branched, or radially branched group [16]. Here, we quantified the characteristics of microglia belonging to the radially branched group, which show that while laminar divisions do not affect morphology, size varies markedly. However, our observations are also consistent with the proposal that the local environment may dictate microglial morphology. Indeed, the laminar homogeneity of microglial morph-ology is perhaps peculiar to the cerebral cortex, as Vela et al. [17] have noted a distinct medial-lateral pattern to microglial branching within the cerebellar cortex. In their study, the authors reported that microglia in the outer layers ran parallel to the pial surface, whereas microglia in the medial regions of the cerebellum had more primary processes that extensively branched. These observations were quite unlike those of the present work, where
primary processes rarely varied, and branching was not different across cortical layers. The differences may reflect the greater heterogeneity of cellular components within the cerebellum, which is distinctly divided amongst white matter tracts and neuronal nuclei, while the prefrontal cortex consists mainly of neuronal cell bodies.
One potential caveat associated with the interpretation of results presented in this study is the method of section-ing that was used. Specifically, the sections that we in-cluded in the study were taken through the coronal plane and in undertaking our analysis we ensured that each of the reconstructed cells was fully located within this plane of the section. Cells that had obviously been bisected dur-ing the sectiondur-ing process were not included for analysis. As many of the microglia were 40 to 50 μm in diameter, and our section thickness was 30μm, we cannot rule the possibility that our analysis approach did not provide an accurate representation of the microglia that were primar-ily orientated within the sagittal plane. Accordingly, we believe it is important that our results can only be consid-ered to be representative of those cells orientated within the coronal plane of the prefrontal cortex.
Conclusions
address is whether or not microglia that possess quite distinct sizes (and morphological properties) also differ with respect to their functional and molecular signatures.
Abbreviations
ANOVA:analysis of variance; Iba-1: ionized calcium-binding adapter molecule-1.
Competing interests
The authors declare that they have no competing interests.
Authors’contributions
RK carried out the immunohistochemistry and image analysis. SBB participated in the statistical analysis and helped to draft the manuscript. SJJ designed the MatLab program to compute cell density heat maps. FRW conceived the study, participated in its design and coordination, and helped to draft the manuscript. All authors have read and agree with the contents of the manuscript.
Author details
1School of Biomedical Sciences and Pharmacy, University of Newcastle, Callaghan, NSW, Australia.2Priority Research Centre for Brain and Mental Health Research, University of Newcastle, Callaghan, NSW, Australia.3Hunter Medical Research Institute, Newcastle, NSW, Australia.4School of Electrical Engineering and Computer Science, University of Newcastle, Callaghan, NSW, Australia.5Laboratory of Affective Neuroscience, School of Biomedical Sciences, University of Newcastle, Callaghan, NSW, Australia.
Received: 18 September 2014 Accepted: 10 October 2014
References
1. Streit WJ, Mrak RE, Griffin WS:Microglia and neuroinflammation: a pathological perspective.J Neuroinflammation2004,1(1):14.
2. Yong VW, Rivest S:Taking advantage of the systemic immune system to cure brain diseases.Neuron2009,64(1):55–60.
3. Gao HM, Hong JS:Why neurodegenerative diseases are progressive: uncontrolled inflammation drives disease progression.Trends Immunol
2008,29(8):357–365.
4. Napoli I, Neumann H:Microglial clearance function in health and disease.
Neuroscience2009,158(3):1030–1038.
5. Graeber MB:Changing face of microglia.Science2010,330(6005):783–788. 6. Ralay Ranaivo H, Craft JM, Hu W, Guo L, Wing LK, Van Eldik LJ, Watterson
DM:Glia as a therapeutic target: selective suppression of human amyloid-β-induced upregulation of brain proinflammatory cytokine production attenuates neurodegeneration.J Neurosci2006,26(2):662–670. 7. Zlokovic BV:The blood-brain barrier in health and chronic
neurodegener-ative disorders.Neuron2008,57(2):178–201.
8. Schafer DP, Lehrman EK, Kautzman AG, Koyama R, Mardinly AR, Yamasaki R, Ransohoff RM, Greenberg ME, Barres BA, Stevens B:Microglia sculpt postnatal neural circuits in an activity and complement-dependent manner.Neuron2012,74(4):691–705.
9. Wake H, Moorhouse AJ, Jinno S, Kohsaka S, Nabekura J:Resting microglia directly monitor the functional state of synapsesin vivoand determine the fate of ischemic terminals.J Neurosci2009,29(13):3974–3980. 10. Tremblay ME, Lowery RL, Majewska AK:Microglial interactions with synapses
are modulated by visual experience.PLoS Biol2010,8(11):e1000527. 11. Davalos D, Grutzendler J, Yang G, Kim JV, Zuo Y, Jung S, Littman DR, Dustin
ML, Gan WB:ATP mediates rapid microglial response to local brain injury
in vivo.Nat Neurosci2005,8(6):752–758.
12. Nimmerjahn A, Kirchhoff F, Helmchen F:Resting microglial cells are highly dynamic surveillants of brain parenchymain vivo.Science2005,
308(5726):1314–1318.
13. Raivich G:Like cops on the beat: the active role of resting microglia.
Trends Neurosci2005,28(11):571–573.
14. Hinwood M, Tynan RJ, Charnley JL, Beynon SB, Day TA, Walker FR:Chronic stress induced remodeling of the prefrontal cortex: structural re-organization of microglia and the inhibitory effect of minocycline.
Cereb Cortex2012,23:1784–1797.
15. Walker FR, Beynon SB, Jones KA, Zhao Z, Kongsui R, Cairns M, Nilsson M:
Dynamic structural remodelling of microglia in health and disease: a review of the models, the signals and the mechanisms.Brain Behav Immun2014,
37:1–14.
16. Lawson LJ, Perry VH, Dri P, Gordon S:Heterogeneity in the distribution and morphology of microglia in the normal adult mouse brain.
Neuroscience1990,39(1):151–170.
17. Vela JM, Dalmau I, Gonzalez B, Castellano B:Morphology and distribution of microglial cells in the young and adult mouse cerebellum.J Comp Neurol1995,361(4):602–616.
18. Jinno S, Fleischer F, Eckel S, Schmidt V, Kosaka T:Spatial arrangement of microglia in the mouse hippocampus: a stereological study in comparison with astrocytes.Glia2007,55(13):1334–1347.
19. Yamada J, Jinno S:Novel objective classification of reactive microglia following hypoglossal axotomy using hierarchical cluster analysis.
J Comp Neurol2012,521:1184–1201.
20. Torres-Platas SG, Comeau S, Rachalski A, Bo GD, Cruceanu C, Turecki G, Giros B, Mechawar N:Morphometric characterization of microglial phenotypes in human cerebral cortex.J Neuroinflammation2014,11:12.
21. Sasaki Y, Ohsawa K, Kanazawa H, Kohsaka S, Imai Y:Iba1 is an actin-cross-linking protein in macrophages/microglia.Biochem Biophys Res Commun2001,286(2):292–297.
22. Kondo S, Kohsaka S, Okabe S:Long-term changes of spine dynamics and microglia after transient peripheral immune response triggered by LPS
in vivo.Molecular Brain2011,4:27.
23. Tynan RJ, Naicker S, Hinwood M, Nalivaiko E, Buller KM, Pow DV, Day TA, Walker FR:Chronic stress alters the density and morphology of microglia in a subset of stress-responsive brain regions.Brain Behav Immun2010,
24(7):1058–1068.
24. Hinwood M, Morandini J, Day TA, Walker FR:Evidence that microglia mediate the neurobiological effects of chronic psychological stress on the medial prefrontal cortex.Cereb Cortex2012,22(6):1442–1454. 25. Paxinos G, Watson C:The Rat Brain in Stereotaxic Coordinates.4th edition.
San Diego, California: Academic Press; 1998.
26. Morshedi MM, Meredith GE:Differential laminar effects of amphetamine on prefrontal parvalbumin interneurons.Neuroscience2007,
149(3):617–624.
27. Gabbott PL, Warner TA, Jays PR, Salway P, Busby SJ:Prefrontal cortex in the rat: projections to subcortical autonomic, motor, and limbic centers.
J Comp Neurol2005,492(2):145–177.
28. Fernandez E, Jelinek HF:Use of fractal theory in neuroscience: methods, advantages, and potential problems.Methods2001,24(4):309–321. 29. Sholl DA:The measurable parameters of the cerebral cortex and their
significance in its organization.Prog Neurobiol1956,2:324–333. 30. Beynon SB, Walker FR:Microglial activation in the injured and healthy
brain: what are we really talking about? Practical and theoretical issues associated with the measurement of changes in microglial morphology.
Neuroscience2012,225:162–171.
31. Yamada J, Nakanishi H, Jinno S:Differential involvement of perineuronal astrocytes and microglia in synaptic stripping after hypoglossal axotomy.Neuroscience2011,182:1–10.
32. Herculano-Houzel S, Mota B, Lent R:Cellular scaling rules for rodent brains.Proc Natl Acad Sci USA2006,103(32):12138–12143. 33. Cotter DR, Pariante CM, Everall IP:Glial cell abnormalities in major
psychiatric disorders: the evidence and implications.Brain Res Bull2001,
55(5):585–595.
34. Eyre H, Baune BT:Neuroplastic changes in depression: a role for the immune system.Psychoneuroendocrinology2012,37:1397–1416.
doi:10.1186/s12974-014-0182-7
Cite this article as:Kongsuiet al.:Quantitative assessment of microglial morphology and density reveals remarkable consistency in the distribution and morphology of cells within the healthy prefrontal cortex