R E S E A R C H
Open Access
Lipidomic profiling of extracellular vesicles
derived from prostate and prostate cancer
cell lines
Joshua S. Brzozowski
1,2, Helen Jankowski
1,2, Danielle R. Bond
1,2, Siobhan B. McCague
1,2, Benjamin R. Munro
2,3,
Melanie J. Predebon
2,3, Christopher J. Scarlett
2,3, Kathryn A. Skelding
2,4and Judith Weidenhofer
1,2*Abstract
Background:Extracellular vesicles (EVs) are produced and secreted from most cells of the body and can be recovered in biological fluids. Although there has been extensive characterisation of the protein and nucleic acid component of EVs, their lipidome has received little attention and may represent a unique and untapped source of biomarkers for prostate cancer diagnosis and prognosis.
Methods:EVs were isolated from non-tumourigenic (RWPE1), tumourigenic (NB26) and metastatic (PC-3) prostate cell lines. Lipids were extracted and subsequently used for targeted lipidomics analysis for the quantitation of molecular lipid species.
Results:A total of 187 molecular lipid species were quantitatively identified in EV samples showing differential abundance between RWPE1, NB26 and PC-3 EV samples. Fatty acids, glycerolipids and prenol lipids were more highly abundant in EVs from non-tumourigenic cells, whereas sterol lipids, sphingolipids and glycerophospholipids were more highly abundant in EVs from tumourigenic or metastatic cells.
Conclusions:This study identified differences in the molecular lipid species of prostate cell-derived EVs, increasing our understanding of the changes that occur to the EV lipidome during prostate cancer progression. These
differences highlight the importance of characterising the EV lipidome, which may lead to improved diagnostic and prognostic biomarkers for prostate cancer.
Keywords:Extracellular vesicles, Lipidomics, Prostate cancer
Background
Cells release vesicles into the extracellular environment that include exosomes, microvesicles and apoptotic bod-ies, collectively termed extracellular vesicles (EVs). Exo-somes (30–150 nm diameter) are formed via the endosomal pathway and released by fusion of a multive-sicular body with the plasma membrane, whereas micro-vesicles (100–1000 nm) and apoptotic bodies (> 1000 nm) bud directly from the plasma membrane. EVs transport cargos of mRNAs, miRNAs, proteins, lipids and metabolites to target cells throughout the body,
protecting them from degradation in the extracellular environment. Thus, EVs are involved in cell-cell commu-nication, allowing for the activation of signalling path-ways, and the transfer of cargo to affect cellular function [1]. Through this mechanism, EVs have been shown both in vivo and in vitro to promote tumour growth and metastasis in many cancers, including pancreatic [2, 3] and prostate cancers [4,5]. However, EV-mediated com-munication is an important component of normal physiological function, with roles in priming the immune system and modulation of stem cell plasticity [6].
Due to the overlapping biophysical properties of the various EVs, analysis of a homogeneous population is difficult without the use of multiple isolation and purifi-cation steps, including differential ultracentrifugation, which are time consuming and are often still unable to * Correspondence:[email protected]
1
School of Biomedical Sciences and Pharmacy, University of Newcastle, Ourimbah, NSW, Australia
2Cancer Research Program, Hunter Medical Research Institute, New Lambton Heights, NSW, Australia
Full list of author information is available at the end of the article
yield a truly homogeneous population. Despite this limi-tation, EVs have received quite extensive characterisation of both their protein and nucleic acid (mRNA and miRNA) content. Indeed, there are now many proteins that show an enrichment in EV populations, including tetraspanins (CD9, CD63 and CD81), integrins, Tsg101 and Alix [7], with these proteins regularly used as markers of EV populations. However, one class of bio-molecules, lipids, have been largely overlooked in studies characterising the composition of EVs.
Lipids have been implicated in multiple aspects of EV biogenesis and function. Due to the presence of lipid raft-associated proteins, including flotillin-1, in EVs, it is thought that lipid rafts may be influencing selective pro-tein sorting into EVs [8]. Lipid rafts are areas of the plasma membrane that are rich in cholesterol and glyco-sphingolipids, acting as platforms for lipid raft-associated protein signalling. Further, the tetraspanins CD9 and CD81 are present in most EV preparations and both have known associations with cholesterol [9], suggesting that their specific incorporation and enrichment in EVs may be due to their associations with lipid rafts. Cholesterols, sphingomyelins and phosphatidylserine are the major components of lipid rafts, with all three lipids showing in-creased abundance in EVs when compared to their secret-ing cells [10–12].
Due to the unique architecture of the prostate and renal system, there is an increased interest in the use of urinary EVs for biomarker discovery in prostate cancer [13–15]. Prostatic secretions, which contain EVs, make their way into the urine and can be collected non-invasively and in large quantities compared to blood, making this technique ideal for assessment of prostate-specific vesicles and the identification of bio-markers for the diagnosis and prognosis of localised can-cer [16,17]. In addition to the potential of utilising EVs for diagnosis, their use as targeted therapies, and for the monitoring of pathological conditions, including cancer, has captured the attention of many researchers [18–20]. Clinical trials have already been performed, assessing the safety and efficacy of using exosomes as a therapeutic agent [21], however, there are many unanswered ques-tions that remain pertaining to the complete biological composition of EVs. There is a lack in the understanding of the lipid composition of EVs and whether the lipid composition of EVs becomes altered during different pathological conditions. Further, it is not known how these alterations may influence, or be related to, the cargo recruitment and biological function of EVs. Herein, we have used a simple ultrafiltration approach for EV isolation, and targeted lipidomics to characterise the relative abundance of lipid species in three prostate cell line-derived EV populations. We have identified dif-ferences in the abundance of lipid species between
non-tumourigenic, tumourigenic, and metastatic pros-tate cell line-derived EVs, highlighting the potential im-portance of the EV lipidome to cancer progression and diagnosis.
Methods
Cell culture
Non-tumourigenic prostate epithelial RWPE1 (CRL-11609), their chemically transformed, tumouri-genic derivative WPE1-NB26 (CRL-2852), and prostate bone metastasis PC-3 (CRL-1435) cell lines were pur-chased from the American Type Culture Collection (ATCC; Cryosite, South Granville, NSW, Australia) and used within seven (RWPE1 and PC-3) and twelve (WPE1-NB26) passages. RWPE1 and WPE1-NB26 (herein referred to as NB26) cells were maintained in Keratinocyte Serum-Free Media (KSFM; Gibco, Thermo Fisher Scientific, North Ryde, NSW, Australia) contain-ing the supplied growth supplements. PC-3 cells were maintained in Ham’s F-12 K (Kaighn’s Modification) Medium (Gibco) supplemented with 10% foetal bovine serum (FBS; Bovogen Biologicals, Interpath, Heidelberg West, VIC, Australia). Cells were maintained in a hu-midified incubator at 37 °C with 5% CO2.
EV isolation and nanoparticle tracking analysis
Cells were grown to approximately 50% confluency in T175 flasks before media was aspirated and cells washed twice in sterile phosphate buffered saline (PBS; Thermo Fisher). KSFM, without growth supplements, was added to RWPE1 and NB26 cells. Serum-free Ham’s F-12 K was added to PC-3 cells. Cells were incubated in a hu-midified incubator at 37 °C with 5% CO2for 48 h before media was collected for EV isolation.
EVs were collected using a modified ultrafiltration protocol, as previously described [22]. Briefly, 150 mL of media per collection was centrifuged for 20 min, 4 °C, 2000 × g to pellet cells and cellular debris. Clarified media was then sequentially passed through a 0.22 μm polyethersulfone (PES) syringe filter (Merck Millipore, Bayswater, VIC, Australia) and a 0.1μm PES vacuum fil-ter unit (Nalgene, Thermo Fisher). The 0.1 μm filtered media was then concentrated with an Amicon 100,000 MWCO Ultra-15 centrifugal filter unit (Merck Milli-pore) at 4 °C, 4000 × g. Flowthrough was discarded and centrifugation was repeated until the entire sample had been processed. Retentates were washed twice with 0.1 μm filtered PBS and collected into Protein LoBind tubes (Eppendorf, North Ryde, NSW, Australia) and stored at−80 °C until use.
Australia). Briefly, samples were diluted in 0.1μm-filtered PBS and illuminated using a 405 nm (violet) laser. A sci-entific CMOS camera recorded 3 × 60s videos for each sample. NTA software was used to analyse the Brownian motion of particles in the captured videos and to gener-ate analysis reports.
Western blot
Western blotting was performed as previously described [22], with protein equivalent to 1 × 10⁸EVs per lane (as determined using NTA). Briefly, EVs were added to sam-ple loading buffer with or without reducing agents, boiled, and run on 4–12% Bis-Tris gels (Novex, Thermo Fisher). After transferring to nitrocellulose, blots were blocked with 5% skimmed milk powder in Tris buffered saline with 0.1% Tween-20 (TBST). Non-reduced blots were probed with 4μg/mL mouse anti-CD9 [1AA2] (a gift from C. Prof Leonie Ashman, University of Newcastle, NSW, Australia), 1:1000 mouse anti-CD63 (BioVision, California, USA) and 1:1000 mouse anti-CD29/ITGB1 [MEM-101A] (EXBIO, Vestec, Czech Republic) primary antibodies di-luted in TBST. Reduced blots were probed with 1:500 mouse Alix (Santa-Cruz, Texas, USA) primary anti-body diluted in 1% skim milk powder in TBST. Primary antibodies were detected with goat anti-mouse, horserad-ish peroxidase-conjugated secondary antibody (Bio-Rad, Gladesville, NSW, Australia). Proteins were detected using enhanced chemiluminescence (ECL) and images captured using an Amersham Imager 600 (GE Healthcare, Rydal-mere, NSW, Australia).
Lipid extraction
Six biological replicates of EVs from each cell line were collected and batch processed to minimise variation in lipid extraction between samples. Prior to lipid extrac-tion, a total of 1 × 10¹⁰EVs per sample were pelleted at 18,000 rpm, 3 h, 4 °C using a Hettich 1195-A fixed angle rotor in a Hettich Micro 220R refrigerated centrifuge. The Centrifugation Parameters Calculator, developed by the Laboratory of Molecular Human Genetics, Research Institute of Physical-Chemical Medicine, Moscow, Russia (http://vesicles.niifhm.ru [23]) was used to calcu-late the pelleting time, using a vesicle density of 1.08 g/ cm3, and a complete sedimentation “cut-off” size of 50 nm diameter.
Lipids were extracted from EVs using a modified Folch extraction protocol [24]. Briefly, EV pellets were resus-pended in an ice cold chloroform:methanol mix (2:1) with 10 mg/L of internal standards PC(19:0/19:0) and PG(17:0/17:0) (Avanti Polar Lipids, Alabama, USA). Samples were vortexed and then mixed at 950 rpm, 20 min, 22 °C with a Thermomixer C (Eppendorf ). Sam-ples were centrifuged at 15,000 rpm for 10 min at room temperature and the supernatant collected into a LoBind
tube. Samples were completely dried using a centrifugal evaporator and stored at−80 °C.
MS analyses
Extracted lipids were processed and detected by Metabo-lomics Australia (Bio21 Institute, Melbourne, VIC, Australia) as previously described [25]. Liquid chroma-tography electrospray ionisation-tandem mass spectrom-etry (LC ESI-MS/MS) was performed using an Agilent 1290 LC system and an Agilent 6490 triple quadrupole mass spectrometer (Agilent Technologies, Mulgrave, VIC, Australia). Equal volumes of each EV lipid sample were combined to create a pooled quality control (QC) sample. An injection volume of 5 μL was used for EV lipids, with QC samples run after every five EV samples. LC separation was performed using ZORBAX eclipse plus C18 column (2.1 × 100 mm, 1.8 μm) (Agilent) maintained at 60 °C. Mobile phase solutions were water, acetonitrile and isopropanol (5:3:2 v/v for A and 1:9:90 v/v for B), both with 10 mM ammonium formate. Columns were run using a gradient of A and B solutions over 18 min at a flow rate of 0.4 mL/min. Metabolites were detected in positive ionisation mode using multiple reactions monitoring.
Data processing
The MS data were processed with Agilent Mass Hunter software. The resultant raw data, indicative of relative abundance (AUC) was further processed using Microsoft Excel for Mac v16.12 and filtered to remove metabolites with a CV > 20%. Missing values were imputed, and the raw data Log2 transformed and normalised to the QC samples using MetaboAnalyst 4.0 [26], a web-based tool for the comprehensive analysis of metabolomics data. MetaboAnalyst was further used for principal compo-nent analysis (PCA) and the generation of heatmaps. Pie charts were created using the base functions in RStudio (RStudio, MA, USA), and the Metabolomics R package used to create boxplots of metabolites.
Lipid nomenclature
Lipids are abbreviated as follows: sterol lipids–cholesteryl ester (CE), oxidised cholesteryl ester (oxCE); sphingolipids – ceramide (Cer), dihydroceramide (DHCer), ganglioside GM3 (GM3), hexa-ceramides with differing glycan chains (Hex1Cer, Hex2Cer, Hex3Cer), sphingomyelin (SM); gly-cerolipids – diacylglyceride (DG), triacylglyceride (TG); glycerophospholipids – phosphatidylcholine (PC), phos-phatidylethanolamine (PE), phosphatidylglycerol (PG), phosphatidylinositol (PI), phosphatidylserine (PS) and the lyso (L) species (LPC and LPE). Alkyl ether and plasmalo-gen linkages are denoted by O- and P- respectively.
the radyl side-chains [27, 28]. The side-chain structures are denoted as carbon chain length:number of double bonds and are provided for each chain where they could be determined, or as a total number of all carbons and double bonds where individual chains could not be determined.
Statistics
To determine differences between individual lipid spe-cies between EV samples, the Log2 transformed data were analysed using an unpaired t-test, correcting for comparisons using the Benjamini and Hochberg false discovery rate with a q value of 5% (analyses available as Additional file1). Data were considered statistically sig-nificant when q≤0.05 with p values reported. These statistical analyses were performed using GraphPad Prism v7.0d (GraphPad Software, CA, USA).
Results
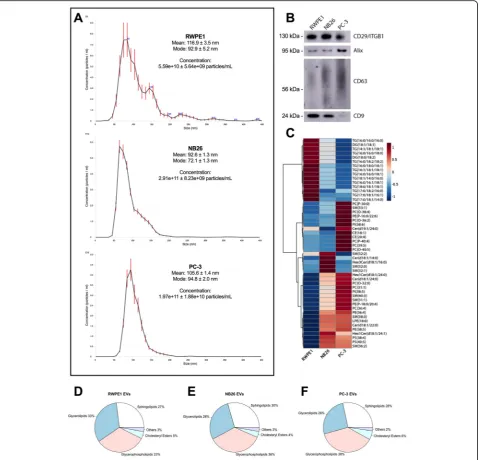
EVs isolated from non-tumourigenic (RWPE1), tumouri-genic (NB26) and metastatic (PC-3) prostate cell lines had mean and mode sizes in the range of typically de-fined exosomes, as assessed by NTA (Fig. 1a). RWPE1 EVs had the lowest overall concentration compared to NB26 and PC-3 EVs, with NB26 having the highest over-all concentration, in accordance with previous reports [29, 30]. All EVs were positive for the common EV markers CD29/ITGB1, Alix, CD63 and CD9 by western blot (Fig. 1b), however PC-3 EVs had minimal CD9 ex-pression in comparison to RWPE1 and NB26 EVs, which is expected as CD9 expression is lower in PC-3 cells compared to RWPE1 [31].
Characterisation of EV lipids
Targeted lipidomics was performed on EVs, using six replicate collections each, allowing for the quantitation of 187 lipid species using a log-transformed, QC normal-ised relative abundance that included lipids from the fatty acid, sterol lipid, sphingolipid, glycerolipid and gly-cerophospholipid lipid categories. Principal component analysis was performed on the dataset showing clear separation between the cell lines and clustering of the samples within the cell lines (see Additional file 2). The relative composition of EVs in the identified lipid classes differed slightly between RWPE1, NB26 and PC-3 cell lines (Fig.1d-f; Table1), where a decrease in abundance of glycerolipids, and an increase in abundance of sphin-golipids and glycerophospholipids was observed in NB26 and PC-3 EVs compared to RWPE1. Further, MetaboA-nalyst was used to generate a heatmap, using the Euclid-ean distance measure and Ward clustering, displaying the top 50 features as determined by t-test, highlighting the enrichment and clustering of various lipid species in EV groups (Fig.1c).
The abundance of lipid species varies between EVs
Glycerolipids
The abundance of both diacylglycerol (DG) and triacyl-glycerol (TG) species was decreased in NB26 and PC-3 EVs compared to RWPE1 EVs. For DG species com-bined, there were significant decreases in abundance be-tween RWPE1 and NB26 EVs (p< 0.0001), RWPE1 and PC-3 EVs (p< 0.0001) and NB26 and PC-3 EVs (p= 0.0037) (Table 2). The only exception was observed in DG (18:0/20:4) for which PC-3 EVs had a + 2.28 Log2 fold change (FC) increased abundance compared to RWPE1 EVs and a + 3.35 FC increased abundance com-pared to NB26 EVs (Fig. 2a). Further, DG (16:0/22:6) abundance was significantly decreased in NB26 EVs with a−2.21 FC compared to RWPE1 EVs and a−2.49 FC compared to PC-3 EVs (Fig. 2b). As there were for DG species, there were decreases in the overall abundance of TG species between RWPE1 and NB26 EVs (p< 0.0001), RWPE1 and PC-3 EVs (p< 0.0001) and NB26 and PC-3 EVs (p= 0.0002) (Table 2). Of the detected TG species, there was a larger proportion containing polyunsatur-ated fatty acids (PUFA) compared to monounsaturpolyunsatur-ated fatty acids (MUFA) or saturated fatty acids (SFA). The three detected SFA species TG (16:0/16:0/16:0) (Fig.2b), TG (16:0/16:0/18:0) and TG (18:0/18:0/18:0) had the highest overall relative abundance in all EV samples (Fig.
2d), possibly suggesting that SFA TG species are import-ant for the unique curvature of EV membranes. Interest-ingly, PC-3 EVs, when compared to NB26 EVs, had consistently lower abundance of all TG species with an even number of total carbons in the fatty acid (FA) chains (i.e. those with either C14, C16 or C18 in thesn1 position). However, in TG species with a total odd num-ber of FA carbons (i.e. those with a C15 or C17 in the sn1 position) there was similar abundance between PC-3 and NB26 EVs (Fig.2b-c), with one of these species, TG (17:0/18:2/16:0) having a significant + 0.64 FC increase in PC-3 EVs compared to NB26 EVs.
Glycerophospholipids
PC-3 EVs had an overall higher relative abundance com-pared to RWPE1 EVs (Fig.3d), however for ether-linked PE species (Fig.3e), RWPE1 EVs showed a significant in-crease in abundance with a + 0.59 FC inin-crease compared to NB26 EVs (p= 0.0021) and a + 0.55 FC increase com-pared to PC-3 EVs (p= 0.0034) (Table2). PC-3 EVs had the highest relative abundance of glycerophosphoinisitol (PI) species detected with only PI (34:1) showing no sig-nificant differences in abundance between samples (Fig.
3b/f ). Glycerophosphoserine (PS) species were most abundant in NB26 EVs with the exception of PS (40:6) which showed highest abundance in PC-3 EVs (Fig.3b/f; Table2).
Sphingolipids, fatty acids and sterol lipids
for 30.1% of RWPE1, 28.8% of NB26 and 29.0% of PC-3 EV sphingolipid composition. Further, there were signifi-cant decreases in total Cer abundance in RWPE1 EVs with a−0.72 FC decrease compared to NB26 EVs (p= 0.0004) and a−0.65 FC decrease compared to PC-3 EVs (p= 0.0010) (Table 2). RWPE1 EVs were significantly enriched in Cer (d17:1/20:0), Cer (d18:1/18:0) and dihy-droceramide (DHCer) C18:0 compared to both NB26 and PC-3 EVs (Fig. 4a). NB26 EVs were significantly enriched in Cer(d18:1/14:0) (Fig. 4e) and Cer (d18:2/ 24:1) compared to both RWPE1 and PC-3 EVs.
Several Hexa-ceramide (HexCer) species were identi-fied, including four Hex1Cer, two Hex2Cer and two Hex3Cer species (Fig.4b/e). For Hex1Cer species, NB26 EVs had a + 2.82 FC increase (p< 0.0001) and PC-3 EVs had a + 3.22 FC increase (p< 0.0001) in overall abun-dance compared to RWPE1 EVs, with no significant dif-ference between NB26 and PC-3 EVs. However, Hex1Cer(d18:1/22:0) was significantly increased in RWPE1 EVs with a + 1.20 FC increase compared to NB26 (p= 0.0002) and a + 0.50 FC increase compared to PC-3 EVs (p= 0.0171). Overall, Hex2Cer species had a + 4.54 FC increase in NB26 EVs (p< 0.0001) and a + 4.33 FC increase in PC-3 EVs (p< 0.0001) compared to RWPE1 EVs, with no significant difference between NB26 and PC-3 EVs. Hex3Cer species were only signifi-cantly increased in abundance in NB26 EVs with a + 7.37 FC increase compared to RWPE1 EVs and a + 7.53 FC increase compared to PC-3 EVs (p< 0.0001). However, there was no significant difference between RWPE1 and PC-3 EVs for Hex3Cer species abundance. There were 22 SM species identified, accounting for 49.8% of RWPE1, 48.2% of NB26 and 50.3% of PC-3 EV sphingo-lipid composition with RWPE1 EVs having a significant decrease in total SM abundance, with a−1.08 FC de-crease compared to NB26 EVs (p< 0.0001) and a−1.51 FC decrease compared to PC-3 EVs (p< 0.0001) (Table
2). The most highly abundant SM species in all EVs was SM (34:1) (Fig. 4c/e). Several SM species displayed dif-ferential abundance across all EV samples, with RWPE1 EVs having the highest abundance of SM(43:1), NB26 EVs having the highest abundance of SM(32:0) and
SM(32:2) and PC-3 EVs having the highest abundance of SM (39:1) and SM (43:2) to name a few (Fig.4c).
There were two acylcarnitine species identified, acyl-carnitines C17:0 and C18:1. Acylcarnitine C17:0 showed a−1.73 FC decrease in NB26 EVs compared to RWPE1 EVs and a further−1.86 FC decrease in PC-3 EVs com-pared to NB26 EVs (see Additional file1). For acylcarni-tine C18:1, there was a−1.66 FC decrease in NB26 EVs compared to RWPE1 EVs and a further −1.95 FC de-crease in PC-3 EVs compared to NB26 EVs (see
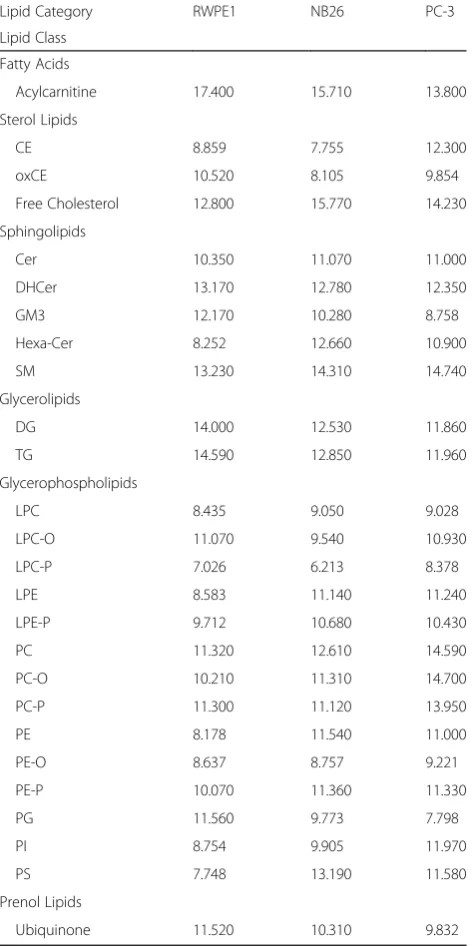
Table 1Mean abundance of lipid categories between RWPE1, NB26 and PC-3 cell-derived EVs
Lipid Category RWPE1 NB26 PC-3
Fatty Acids 17.400 15.710 13.800
Sterol Lipids 9.696 8.741 12.050
Sphingolipids 11.690 12.800 12.660
Glycerolipids 14.470 12.770 11.930
Glycerophospholipids 10.200 10.890 11.970
Prenol Lipids 11.520 10.310 9.832
Abundance was measured as Log-transformed, normalised AUC
Table 2Mean abundance of lipid classes in RWPE1, NB26 and PC-3 EVs
Lipid Category RWPE1 NB26 PC-3
Lipid Class
Fatty Acids
Acylcarnitine 17.400 15.710 13.800
Sterol Lipids
CE 8.859 7.755 12.300
oxCE 10.520 8.105 9.854
Free Cholesterol 12.800 15.770 14.230
Sphingolipids
Cer 10.350 11.070 11.000
DHCer 13.170 12.780 12.350
GM3 12.170 10.280 8.758
Hexa-Cer 8.252 12.660 10.900
SM 13.230 14.310 14.740
Glycerolipids
DG 14.000 12.530 11.860
TG 14.590 12.850 11.960
Glycerophospholipids
LPC 8.435 9.050 9.028
LPC-O 11.070 9.540 10.930
LPC-P 7.026 6.213 8.378
LPE 8.583 11.140 11.240
LPE-P 9.712 10.680 10.430
PC 11.320 12.610 14.590
PC-O 10.210 11.310 14.700
PC-P 11.300 11.120 13.950
PE 8.178 11.540 11.000
PE-O 8.637 8.757 9.221
PE-P 10.070 11.360 11.330
PG 11.560 9.773 7.798
PI 8.754 9.905 11.970
PS 7.748 13.190 11.580
Prenol Lipids
Ubiquinone 11.520 10.310 9.832
Additional file 1). Additionally, nine cholesteryl ester (CE) species were detected (Fig.4d), with PC-3 EVs hav-ing the highest overall abundance and NB26 EVs havhav-ing the lowest overall abundance (Table 2). For all CE
with a + 2.77 FC in CE (16:0), a + 0.66 FC in CE (18:1) and a + 2.21 FC in CE (20:3) (Fig.4e).
Discussion
Although there is increasing interest in the use of EVs for both diagnostic and therapeutic potential in a variety of pathologies, the understanding of the complete
mechanism used by cancer cells to alter energy pathways within the tumour microenvironment. Many tumours, including prostate, show increased uptake and de novo synthesis of cholesterols and cholesteryl esters [32, 33], as well as the accumulation of triacylglycerols as energy reservoirs [34]. As EVs are known to transfer lipids and lipid-related proteins to affect target cell function [35– 37], we employed a targeted lipidomics approach on our prostate cell-derived EVs, allowing for the specific iden-tification and quantitation of lipid species.
We detected relatively high numbers of DG, TG and CE species. It has been previously reported that the de-tection of large numbers of these species in EVs is due to the presence of contaminating lipoproteins and/or lipid droplets in EV isolates [12]. We utilised ultrafiltra-tion over the tradiultrafiltra-tional ultracentrifugaultrafiltra-tion method for the isolation of EVs, as it has higher yields of vesicles re-ported [38]. Further, ultrafiltration is better suited for translation into a clinical setting due to the relative speed of the protocol, the larger volumes of sample able to be processed and the fact that no specialist equipment is required [39]. Ultrafiltration is more likely to co-isolate other particles, resulting in a heterogeneous mixture, and as such the DG, TG and CE species de-tected here may have arisen from lipid droplets. How-ever, far from being considered a confounding factor, the detection of these species may have clinical relevance in terms of diagnosis of disease.
The accumulation of CEs in prostate cancer is associ-ated with the progression and metastasis of the tumour, with this CE accumulation being identified in lipid drop-lets within prostate cancer cells [40], suggesting that the co-isolation of lipid droplets with EVs may be beneficial for prostate cancer diagnosis. Further, it has recently been shown that CEs, specifically CE (18:1) (cholesteryl oleate), can discriminate between prostate cancer, non-tumour, and benign prostatic hyperplasia [40, 41]. Although we have shown that CEs were higher in abun-dance in metastatic PC-3 EVs compared to the normal RWPE1 EVs we saw a decrease in CE abundance in NB26 EVs compared to RWPE1 EVs, however, this may be a result of the lineage of the NB26 cell line. The NB26 cell line is a derivative of the RWPE1 cell line, formed by exposure of RWPE1 cells to N-methyl-N -ni-trosourea and two generations of injection and growth in nude mice [42]. Due to this lineage, and although the NB26 cell line has a tumourigenic and invasive pheno-type, it may retain many similarities to the RWPE1 cell line. In addition to the potential diagnostic value of CE detection in EV isolates, it has also been demonstrated that the metastatic prostate cancer cell line DU145 accu-mulates unsaturated TG species when undergoing the epithelial to mesenchymal transition [34]. Therefore, the detection of these lipid species, whether they be from
EVs, lipoproteins or lipid droplets, may provide import-ant information relating to the progression and progno-sis of prostate cancer.
grade prostate cancer and increase in patients with more advanced prostate cancer or who had succumbed to their disease. Although the associations were statistically significant using conventional statistics of linearity, when correcting for multiple comparisons using the false dis-covery rate, the associations were no longer significant. Similar findings have been seen in hepatocellular carcin-oma where there was an increase in the accumulation of acylcarnitines with long FA chains (>C14) during disease progression [49]. As we saw a decrease in the concentra-tion of long chain acylcarnitines in our EVs, this may suggest that there is a higher cellular utilisation of these metabolites that restrict their abundance in EVs.
Together, and as identified by heatmap analysis, the differences in abundance of lipid species identified be-tween EVs from non-tumourigenic, tumourigenic and metastatic prostate cells highlights that these differences may be a source of biomarkers for prostate cancer diag-nosis and progdiag-nosis. Further, the known functional roles of particular lipid species in cancer cells suggests that, in addition to providing encapsulation for EV cargo, the vesicle membrane composition along with the EV cargo may possibly have important roles in driving cancer progression.
Conclusions
In summary, we have identified differences in the abun-dance of the molecular lipid species of EVs from non-tumourigenic, tumourigenic and metastatic prostate cells in vitro. These differences highlight the potential for the use of EV-derived lipids for diagnostic and prog-nostic evaluation of prostate cancer. This work increases our understanding of the biological makeup of EVs and may pave the way for the development of a lipid signa-ture biomarker for different disease states. By under-standing the molecular lipid composition of EVs, we may better understand the roles of the EV lipidome in cell signalling events.
Additional files
Additional file 1:BH Corrected Multiple Comparisons of EV Lipid Species. Lipid species data were analysed using an unpaired t-test, cor-recting for multiple comparisons using the Benjamini and Hochberg FDR with a q value of 5%. The workbook contains 3 sheets, one for each com-parison: RWPE1 v NB26, RWPE1 v PC-3 and NB26 v PC-3. (XLSX 57 kb)
Additional file 2:Principal Components Analysis (PCA) plots of EV sample groups. PCA was performed on samples using MetaboAnalyst. The cell line groups were clearly separated from each other, whilst the samples within each cell line group were tightly clustered. (DOCX 54 kb)
Abbreviations
ANOVA:Analysis of variance; EV: Extracellular vesicle; FA: Fatty acid; FBS: Foetal bovine serum; KSFM: Keratinocyte Serum-Free Media; MUFA: Monounsaturated fatty acid; NTA: Nanoparticle tracking analysis; PBS: Phosphate buffered saline; PUFA: Polyunsaturated fatty acid; QC: Quality control; SFA: Saturated fatty acid
Acknowledgements
The authors would like to thank the team at Metabolomics Australia, University of Melbourne, in particular Dedreia Tull, Konstantinos Kouremenos and Saravanan Dayalan for their technical assistance with the lipidomics data.
Funding
The work was funded by the CFMEU Northern Mining & Energy District and the Rotary Club of Paterson through the Hunter Medical Research Institute. JB and HJ were supported by an Australian Government Research Training Program Scholarship. JB was further supported by an MM Sawyer Estate Postgraduate Research Scholarship through the Hunter Medical Research Institute, Australia and HJ was further supported though the Hunter Cancer Research Alliance.
Availability of data and materials
The datasets used and/or analysed during the current study are available from the corresponding author on reasonable request.
Authors’contributions
JSB, JW, KAS and CJS conceived the ideas and designed the study. JSB conducted the experiments and analysis and wrote the manuscript. JSB, HJ, DRB, SBM, BRM, MJP, CJS, KAS and JW all contributed to the interpretation of the analyses. All authors read and approved the final manuscript.
Ethics approval and consent to participate Not applicable.
Consent for publication Not applicable.
Competing interests
The authors declare that they have no competing interests.
Publisher’s Note
Springer Nature remains neutral with regard to jurisdictional claims in published maps and institutional affiliations.
Author details 1
School of Biomedical Sciences and Pharmacy, University of Newcastle, Ourimbah, NSW, Australia.2Cancer Research Program, Hunter Medical Research Institute, New Lambton Heights, NSW, Australia.3School of Environmental and Life Sciences, University of Newcastle, Ourimbah, NSW, Australia.4School of Biomedical Sciences and Pharmacy, University of Newcastle, Callaghan, NSW, Australia.
Received: 18 July 2018 Accepted: 28 August 2018
References
1. Yuana Y, Sturk A, Nieuwland R. Extracellular vesicles in physiological and pathological conditions. Blood Rev. 2013;27(1):31–9.
2. Yu Z, Zhao S, Ren L, Wang L, Chen Z, Hoffman RM, et al. Pancreatic cancer-derived exosomes promote tumor metastasis and liver pre-metastatic niche formation. Oncotarget. 2017;8(38):63461–83.
3. Costa-Silva B, Aiello NM, Ocean AJ, Singh S, Zhang H, Thakur BK, et al. Pancreatic cancer exosomes initiate pre-metastatic niche formation in the liver. Nat Cell Biol. 2015;17(6):816–26.
4. Soekmadji C, Riches JD, Russell PJ, Ruelcke JE, McPherson S, Wang C, et al. Modulation of paracrine signaling by CD9 positive small extracellular vesicles mediates cellular growth of androgen deprived prostate cancer. Oncotarget. 2017;8(32):52237–55.
5. Liu C-M, Hsieh C-L, Shen C-N, Lin C-C, Shigemura K, Sung S-Y. Exosomes from the tumor microenvironment as reciprocal regulators that enhance prostate cancer progression. Int J Urol. 2016;23(9):734–44.
6. Lee Y, Andaloussi El S, Wood MJA. Exosomes and microvesicles: extracellular vesicles for genetic information transfer and gene therapy. Hum Mol Genet Oxford University Press. 2012;21(R1):R125–34.
8. de Gassart A, Géminard C, Février B, Raposo G, Vidal M. Lipid raft-associated protein sorting in exosomes. Blood. 2003;102(13):4336–44.
9. Charrin S, Manié S, Thiele C, Billard M, Gerlier D, Boucheix C, et al. A physical and functional link between cholesterol and tetraspanins. Eur J Immunol. 2003;33(9):2479–89.
10. Llorente A, Skotland T, Sylvänne T, Kauhanen D, Róg T, Orłowski A, et al. Molecular lipidomics of exosomes released by PC-3 prostate cancer cells. Biochim Biophys Acta. 2013;1831(7):1302–9.
11. Sandvig K, Llorente A. Proteomic analysis of microvesicles released by the human prostate Cancer cell line PC-3. Mol Cell Proteomics. 2012;11(7):M111. 012914.
12. Skotland T, Sandvig K, Llorente A. Lipids in exosomes: current knowledge and the way forward. Prog Lipid Res. 2017;66:30–41.
13. Skotland T, Ekroos K, Kauhanen D, Simolin H, Seierstad T, Berge V, et al. Molecular lipid species in urinary exosomes as potential prostate cancer biomarkers. Eur J Cancer. 2017;70:122–32.
14. Yang JS, Lee JC, Byeon SK, Rha KH, Moon MH. Size dependent Lipidomic analysis of urinary exosomes from patients with prostate Cancer by flow field-flow fractionation and Nanoflow liquid chromatography-tandem mass spectrometry. Anal Chem. 2017;89(4):2488–96.
15. Duijvesz D, Versluis CYL, van der Fels CAM, Vredenbregt-van den Berg MS, Leivo J, Peltola MT, et al. Immuno-based detection of extracellular vesicles in urine as diagnostic marker for prostate cancer. Int J Cancer. 2015;137(12):2869–78. 16. Nilsson J, Skog J, Nordstrand A, Baranov V, Mincheva-Nilsson L, Breakefield
XO, et al. Prostate cancer-derived urine exosomes: a novel approach to biomarkers for prostate cancer. Br J Cancer. 2009;100(10):1603–7.
17. Duijvesz D, Luider T, Bangma CH, Jenster G. Exosomes as biomarker treasure chests for prostate cancer. Eur Urol. 2011;59(5):823–31.
18. Wang H, Hou L, Li A, Duan Y, Gao H, Song X. Expression of serum exosomal microRNA-21 in human hepatocellular carcinoma. BioMed Res Int Hindawi Publishing Corporation. 2014;2014(2):864894–5.
19. Li Q, Shao Y, Zhang X, Zheng T, Miao M, Qin L, et al. Plasma long noncoding RNA protected by exosomes as a potential stable biomarker for gastric cancer. Tumour biol. Springer Netherlands. 2015;36(3):2007–12. 20. Wang L, Skotland T, Berge V, Sandvig K, Llorente A. Exosomal proteins as
prostate cancer biomarkers in urine: from mass spectrometry discovery to immunoassay-based validation. Eur J Pharm Sci. 2017;98:80–5.
21. Conlan RS, Pisano S, Oliveira MI, Ferrari M, Pinto IM. Exosomes as reconfigurable therapeutic systems. Trends Mol Med Elsevier. 2017;23(7):636–50.
22. Brzozowski JS, Bond DR, Jankowski H, Goldie BJ, Burchell R, Naudin C, et al. Extracellular vesicles with altered tetraspanin CD9 and CD151 levels confer increased prostate cell motility and invasion. Sci Rep. 2018;8(1):8822. 23. Livshits MA, Khomyakova E, Evtushenko EG, Lazarev VN, Kulemin NA, Semina SE, et al. Isolation of exosomes by differential centrifugation: theoretical analysis of a commonly used protocol. Sci Rep. 2015;5(1):17319. 24. FOLCH J, Lees M, GH SLOANESTANLEY. A simple method for the isolation
and purification of total lipides from animal tissues. J Biol Chem. 1957; 226(1):497–509.
25. Huynh K, Pernes G, Mellett N, Meikle P, Murphy A, Lancaster G. Lipidomic profiling of murine macrophages treated with fatty acids of varying chain length and saturation status. Meta. 2018;8(2):29–17.
26. Chong J, Soufan O, Li C, Caraus I, Li S, Bourque G, et al. MetaboAnalyst 4.0: towards more transparent and integrative metabolomics analysis. Nucleic Acids Res. 2018;37:W652.
27. Fahy E, Subramaniam S, Brown HA, Glass CK, Merrill AH, Murphy RC, et al. A comprehensive classification system for lipids. J Lipid Res Am Soc Biochem Mol Biol. 2005;46(5):839–61.
28. Fahy E, Cotter D, Sud M, Subramaniam S. Lipid classification, structures and tools. Biochim Biophys Acta. 2011;1811(11):637–47.
29. Riches A, Campbell E, Borger E, Powis S. Regulation of exosome release from mammary epithelial and breast cancer cells - a new regulatory pathway. Eur J Cancer. 2014;50(5):1025–34.
30. Roma-Rodrigues C, Fernandes AR, Baptista PV. Exosome in tumour microenvironment: overview of the crosstalk between normal and cancer cells. Biomed Res Int. 2014;2014(7):179486–10.
31. Wang J-C, Bégin LR, Bérubé NG, Chevalier S, Aprikian AG, Gourdeau H, et al. Down-regulation of CD9 expression during prostate carcinoma progression is associated with CD9 mRNA modifications. Clin Cancer Res. 2007;13(8):2354–61. 32. Baenke F, Peck B, Miess H, Schulze A. Hooked on fat: the role of lipid
synthesis in cancer metabolism and tumour development. Dis Model Mech. 2013;6(6):1353–63.
33. Wu X, Daniels G, Lee P, Monaco ME. Lipid metabolism in prostate cancer. Am J Clin Exp Urol. 2014;2(2):111–20.
34. Dalmau N, Jaumot J, Tauler R, Bedia C. Epithelial-to-mesenchymal transition involves triacylglycerol accumulation in DU145 prostate cancer cells. Mol BioSyst. 2015;11(12):3397–406.
35. Beloribi-Djefaflia S, Siret C, Lombardo D. Exosomal lipids induce human pancreatic tumoral MiaPaCa-2 cells resistance through the CXCR4-SDF-1α signaling axis. Oncoscience. 2015;2(1):15–30.
36. Subra C, Grand D, Laulagnier K, Stella A, Lambeau G, Paillasse M, et al. Exosomes account for vesicle-mediated transcellular transport of activatable phospholipases and prostaglandins. J Lipid Res. 2010;51(8):2105–20. 37. Record M, Carayon K, Poirot M, Silvente-Poirot S. Exosomes as new vesicular
lipid transporters involved in cell–cell communication and various pathophysiologies. Biochim Biophys Acta. 2014;1841(1):108–20.
38. Lobb RJ, Becker M, Wen SW, Wong CSF, Wiegmans AP, Leimgruber A, et al. Optimized exosome isolation protocol for cell culture supernatant and human plasma. J Extracell Vesicles. 2015;4(1):27031.
39. Cheruvanky A, Zhou H, Pisitkun T, Kopp JB, Knepper MA, Yuen PST, et al. Rapid isolation of urinary exosomal biomarkers using a nanomembrane ultrafiltration concentrator. Am J Physiol Renal Physiol. 2007;292(5):F1657–61.
40. Li J, Ren S, Piao H-L, Wang F, Yin P, Xu C, et al. Integration of lipidomics and transcriptomics unravels aberrant lipid metabolism and defines cholesteryl oleate as potential biomarker of prostate cancer. Sci Rep. 2016;6(1):20984. 41. Yue S, Li J, Lee S-Y, Lee HJ, Shao T, Song B, et al. Cholesteryl ester
accumulation induced by PTEN loss and PI3K/AKT activation underlies human prostate cancer aggressiveness. Cell Metab. 2014;19(3):393–406. 42. Webber MM, Quader ST, Kleinman HK, Bello-DeOcampo D, Storto PD, Bice
G, et al. Human cell lines as an in vitro/in vivo model for prostate carcinogenesis and progression. Prostate. 2001;47(1):1–13.
43. Phuyal S, Skotland T, Hessvik NP, Simolin H, Øverbye A, Brech A, et al. The ether lipid precursor hexadecylglycerol stimulates the release and changes the composition of exosomes derived from PC-3 cells. J Biol Chem. 2015; 290(7):4225–37.
44. Ide Y, Waki M, Hayasaka T, Nishio T, Morita Y, Tanaka H, et al. Human breast Cancer tissues contain abundant phosphatidylcholine(36∶1) with high Stearoyl-CoA Desaturase-1 expression. Real FX, editor. PLoS ONE. 2013;8(4): e61204.
45. Lin H-M, Mahon KL, Weir JM, Mundra PA, Spielman C, Briscoe K, et al. A distinct plasma lipid signature associated with poor prognosis in castration-resistant prostate cancer. Int J Cancer. 2017;141(10):2112–20.
46. Trajkovic K, Hsu C, Chiantia S, Rajendran L, Wenzel D, Wieland F, et al. Ceramide triggers budding of exosome vesicles into multivesicular endosomes. Science. 2008;319(5867):1244–7.
47. Phuyal S, Hessvik NP, Skotland T, Sandvig K, Llorente A. Regulation of exosome release by glycosphingolipids and flotillins. FEBS J. 2014 May; 281(9):2214–27.
48. Schmidt JA, Fensom GK, Rinaldi S, Scalbert A, Appleby PN, Achaintre D, et al. Pre-diagnostic metabolite concentrations and prostate cancer risk in 1077 cases and 1077 matched controls in the European prospective investigation into Cancer and nutrition. BMC Med. 2017;15(1):122. 49. Lu Y, Li N, Gao L, Xu Y-J, Huang C, Yu K, et al. Acetylcarnitine is a candidate