www.ann-geophys.net/32/1277/2014/ doi:10.5194/angeo-32-1277-2014
© Author(s) 2014. CC Attribution 3.0 License.
Aspects of magnetosphere–ionosphere coupling in sawtooth
substorms: a case study
P. E. Sandholt1and C. J. Farrugia2
1Department of Physics, University of Oslo, Oslo, Norway
2Space Science Center, University of New Hampshire, Durham, USA Correspondence to: P. E. Sandholt ([email protected])
Received: 26 November 2013 – Revised: 10 September 2014 – Accepted: 15 September 2014 – Published: 20 October 2014
Abstract. In a case study we report on repetitive substorm activity during storm time which was excited during Earth passage of an interplanetary coronal mass ejection (ICME) on 18 August 2003. Applying a combination of magneto-sphere and ground observations during a favourable multi-spacecraft configuration in the plasma sheet (GOES-10 at geostationary altitude) and in the tail lobes (Geotail and Cluster-1), we monitor the temporal–spatial evolution of ba-sic elements of the substorm current system. Emphasis is placed on activations of the large-scale substorm current wedge (SCW), spanning the 21:00–03:00 MLT sector of the near-Earth plasma sheet (GOES-10 data during the inter-val 06:00–12:00 UT), and magnetic perturbations in the tail lobes in relation to ground observations of auroral electro-jets and convection in the polar cap ionosphere. The joint ground–satellite observations are interpreted in terms of se-quential intensifications and expansions of the outer and in-ner current loops of the SCW and their respective associ-ations with the westward electrojet centred near midnight (24:00 MLT) and the eastward electrojet observed at 14:00– 15:00 MLT. Combined magnetic field observations across the tail lobe from Cluster and Geotail allow us to make estimates of enhancements of the cross-polar-cap potential (CPCP) amounting to ≈30–60 kV (lower limits), corresponding to monotonic increases of the PCN index by 1.5 to 3 mV m−1 from inductive electric field coupling in the magnetosphere– ionosphere (M–I) system during the initial transient phase of the substorm expansion.
Keywords. Magnetospheric physics (magnetosphere– ionosphere interactions)
1 Introduction
Depending on solar wind conditions, magnetospheric sub-storms may appear in different variants. Such are the “clas-sical” isolated substorms (with fully developed growth– expansion–recovery phases; see Akasofu, 1964); double (or multiple)-onset substorms (major, full-scale onset preceded by pseudo-breakup; see e.g. Koskinen et al., 1993; Pulkkinen et al., 1998, and Kullen et al., 2009); and repetitive, large substorms during storm times, sometimes referred to as saw-tooth events (Henderson et al., 2006). A standard definition of “classical” substorms includes typical signatures such as (i) a plasma injection at geostationary altitude (6.6RE), (ii) a
dipolarization of the inner-magnetotail magnetic field, and (iii) a rapid enhancement and poleward expansion (Friedrich et al., 2001) of the westward electrojet (WEJ) in the auroral ionosphere (Pulkkinen et al., 2007). Pseudo-breakups consist of a brief brightening event with small spatial extent. In such cases, the magnetospheric source, i.e. the current disruption (CD) process in the near-Earth plasma sheet (PS), does not expand into a global, “classical” substorm (Nakamura et al., 1992; Kozelova et al., 1992). Thus this variant has been de-scribed as the smallest type of a substorm (e.g. Nakamura et al., 1994; Aikio et al., 1999). According to Lui (2000) “a substorm follows when the global condition is favourable, so that a local activity may trigger a system-wide activity which we call a substorm.” This scenario is consistent with the de-scription of Cowley (1992), who concluded that substorms are basically a two-step process, consisting of dipolarization near the inner edge of the plasma sheet (∼5–15RE) followed
by near-Earth (25–30RE) tail reconnection.
appearing in the near-Earth PS, at geosynchronous altitude, and in the tail lobes, as well as central features of the associ-ated magnetosphere–ionosphere (M–I) coupling during saw-tooth substorms (whose characteristic phenomena are given below). The observations will be discussed in the context of a model of M–I coupling consisting of three basic ele-ments: (i) activation of the substorm current wedge (SCW; see McPherron et al., 1973) with re-routing of part of the cross-tail current (CTC) via Birkeland currents to the WEJ in the ionosphere (auroral oval around midnight); (ii) a sys-tem of Bostrøm type II current sheets (Bostrøm, 1964) con-necting the partial ring current (PRC)–PS inner boundary and the auroral oval south, maximizing at dusk and dawn; and (iii) coupling of an enhanced electric field from the tail lobes (ETL enhancement as a result of magnetotail reconnection;
see e.g. Sauvaud et al., 2012) to the polar cap (PC) iono-sphere, giving rise to PC convection enhancements.
Current system (i) (SCW) may be activated by a cur-rent disruption (CD) in the near-Earth (7–10RE) plasma
sheet (Lui, 1991). Current system (ii), i.e., Bostrøm type II, can be activated by plasma inflow from the CD region (Lui and Murphree, 1998), resulting in a plasma injection dynamo (E·J<0) associated with plasma flow braking at the inner edge of the PS (Birn and Hesse, 2013). M–I coupling chan-nel (iii) from the tail lobe to the polar cap is activated by the
ETL enhancement associated with reconnection of tail lobe
flux at the near-Earth neutral line (NENL), as recently doc-umented by Sauvaud et al. (2012). At present there are still unresolved questions on the temporal evolution of these M–I coupling processes taking place during substorms (see e.g. Sergeev et al., 2012; Sauvaud et al., 2012; Akasofu, 2013).
In this paper we combine ground–satellite data to shed light on this issue. The data we selected for this study were obtained during a 7 h long interval of continuously high solar wind forcing (interplanetary coronal mass ejection (ICME) passage at Earth on 18 August 2003) which gave rise to three consecutive sawtooth substorms recurring at 2 h and 15 min intervals. Process (i) was monitored by GOES-10 observations of magnetic field dipolarizations in the 20:00– 03:00 MLT (magnetic local time) sector in combination with WEJ activity inferred from Alaska chain magnetometer data in the 19:00–01:00 MLT sector. Activation of coupling chan-nel (ii) is monitored by the associated eastward electrojet (EEJ) current in the postnoon-to-dusk sector by IMAGE chain (Scandinavia–Finland) magnetograms. Coupling chan-nel (iii) is followed by the PCN index (Troshichev et al., 2000). Thus, an important aspect of this study is the exci-tation and temporal evolution of PC convection during the multi-phase evolution of the three consecutive sawtooth sub-storms appearing in our selected interval. The roles of in-ductive and potential fields in these M–I coupling events is a topic of current investigation (see e.g. Katus et al., 2013) which we will address in the present case study.
Sawtooth substorms, which may occur primarily dur-ing geomagnetic storms (see Noah and Burke, 2014), are
characterized by (i) magnetic field stretching accompanied by a gradual decrease of the energetic particle flux at geosyn-chronous altitude, followed by (ii) magnetic field dipolar/-ization and rapid increase of the energetic particle flux (par-ticle injection in the dusk-to-midnight sector), (iii) a local-ized auroral onset in the pre-midnight sector which occurs on the equatorward branch of a thinned double-oval configura-tion, (iv) auroral zone negativeHbays and middle- and low-latitude positive H bays, (v) Pi2 pulsations, and (vi) wide substorm-like current wedges (see Henderson et al., 2006, and references therein).
There has been some discussion on the peculiarities of sawtooth substorms (e.g. the repetition period between 2 and 4 h; the abnormally large spatial extent; and only partial re-covery of WEJ activity between events, as measured by the AL (WEJ index)), i.e. whether they represent a distinct class of magnetospheric activity or not. According to Pulkkinen et al. (2007), sawtooth events have auroral and inner magne-tosphere characteristics that are quite similar to those found generally during storm-time activity. Hence they conclude that sawtooth events do not represent a specific class of activ-ity. In this view, sawtooth events constitute rather a subset of large, recurrent substorms driven by long-lasting high solar wind forcing. According to Troshichev and Janzhura (2009), “the classical development of the substorm, put forward by Akasofu (1964) for isolated substorms, is not workable in the cases of sawtooth disturbances, when powerful solar wind energy pumping into the magnetosphere provides a perma-nent powerful aurora particle precipitation into the auroral zone.” They find that the close relationship between particle injection at geostationary orbit and auroral onset documented in “classical substorms” is broken in the powerful sawtooth substorms. They note, however, that this “inconsistency” can be affected by the local time differences between the auroral brightening location (or the ground station that contributes to the “AL onset”) and the location of the spacecraft that sees the injection. Related to this we note that, when we study M–I coupling during sawtooth substorms, we combine obser-vations from geostationary altitude (GEOS-10 satellite) and ground magnetic data (WEJ activity) from stations in Alaska. In our case the observations relating to the magnetospheric and ionospheric levels are separated by only 2 h in MLT. (In the interval we study, GOES and Alaska are moving with the Earth through the MLT sectors 21:00–03:00 and 19:00– 01:00, respectively, i.e. both cover 6 h of nightside MLTs.)
substorms (Henderson et al., 2006; Troshichev and Janzhura, 2009).
In the present study we find that three consecutive saw-tooth events on this same day are double-onset substorms with a corresponding two-step M–I coupling sequence con-sisting of (i) an initial dipolarization with corresponding pseudo-breakup of the WEJ and weak PC convection (PCN, polar cap north index) response (see also Kullen et al., 2010), followed by (ii) a subsequent major onset of the WEJ and a major PC convection response. Each of these three two-step onsets are preceded by an interval of field stretching and gradual energetic particle decrease in the near-Earth PS, as expected for sawtooth events. The further implications that follow from these observations on the detailed evolution of M–I coupling processes across the auroral oval and the polar cap during these sawtooth substorms will be discussed.
From the available data we obtain information on the chronology of the M–I coupling processes such as (i) the PS CD (dipolarization) events and activations of the substorm current wedge (SCW) from GOES-10 data and Alaska chain magnetometer data, (ii) plasma injections to the PRC (SYM-H dips; see Paper 1), and (iii) the evolution of the tail lobe to polar cap coupling from the combination of Cluster-1 mag-netic field perturbations and the PCN index. With this ap-proach we want to investigate the possible role of inductive electric fields in M–I coupling during sawtooth substorms considering the spatial–temporal evolution of substorm cur-rent loops with auroral electrojet manifestations at midnight (Alaska chain) and near 15:00 MLT (IMAGE chain in the Svalbard–Scandinavia–Finland region).
2 Conceptual model of M–I coupling
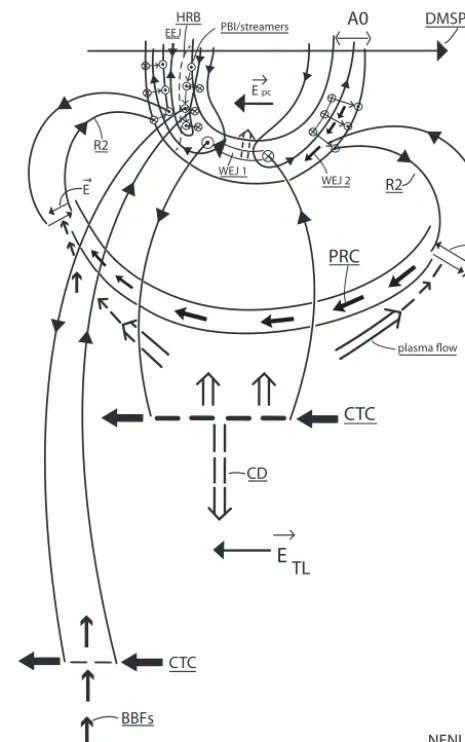
As a background for the later discussion of the observa-tions, in Fig. 1 we show a schematic illustration of M–I coupling channels via substorm current systems. Magneto-spheric plasma flow features and associated current loops in the Northern Hemisphere are indicated. The different cur-rent loops consist of field-aligned curcur-rents and their closure currents (normal to the magnetic field) in the magnetosphere and the ionosphere. The Bostrøm type I loop (i.e. the outer loop of the substorm current wedge: SCW) is connected to an azimuthal ionospheric current (westward electrojet: WEJ). The Bostrøm type II loop is connected to a meridional (north–south) ionospheric current. The FACs (field-aligned currents) in the meridional loops consist of bipolar, east– west-aligned current sheets. Both current loops are powered by plasma injection dynamos in the plasma sheet, where the
E and J are oppositely directed (E·J<0), as indicated. Basic dynamic elements of the magnetosphere perspective are (i) large-scale disruptions of the cross-tail current (CTC) in the SCW and (ii) smaller-scale disruptions with associ-ated FACs (wedgelets) connecting to earthward-propagating bursty bulk flows (BBFs). The corresponding ionospheric
CTC PRC
A0
HRB
E pc
R2
E
E TL WEJ 1
BBFs
E R2
PBI/streamers
plasma flow
CD
CTC
EEJ
NENL DMSP F13
[image:3.612.311.544.64.435.2]WEJ 2
Figure 1. Schematic illustration showing four different channels of M–I coupling operating during substorm activity: (i) auroral oval around midnight (westward electrojet: WEJ) to near-Earth plasma sheet (Bostrøm type I: large-scale SCW), (ii) auroral oval south at dawn/dusk to PS–PRC boundary (Bostrøm type II), (iii) auroral oval north at dusk to midtail PS (Bostrøm type I: current wedgelet), and (iv) electric field (potential) coupling along open field lines between the polar cap ionosphere and the lobes of the magnetotail. See text for details.
connections in the north and south branches of the auro-ral oval, respectively, on the dusk/dawn sides of the SCW are shown. Current disruption (CD) events originating in the near-Earth PS and propagating tailward are marked. Asso-ciated magnetic perturbations and electric fields in the tail lobes (ETL) are observed (estimated) in this article. They
are coupled to the polar cap ionosphere (EPC) causing
inner loop of the SCW: auroral oval in the postnoon-to-dusk sector (EEJ) to the near-Earth plasma-sheet–partial-ring cur-rent (PRC: Bostrøm type II), and (iii) electric field (poten-tial) coupling along open field lines between the tail lobes and the polar cap. With our M–I data sets we are monitor-ing the temporal–spatial evolution of this system durmonitor-ing the repetitive sawtooth substorm events.
The figure also marks the observation geometry at dusk where we combine ground magnetic observations by the IM-AGE chain in the Svalbard–Scandinavia–Finland region and DMSP F13 data. A central feature of this sector is the bound-ary between the EEJ and WEJ in the evening to premidnight sector – also delimiting the southern and northern branches of the aurora, marked by a dashed curved line – is the Harang reversal boundary (HRB). The northern auroral branch in this sector (HR-N) is characterized by equatorward-moving auroral forms (streamers) which are coupled to earthward-moving plasma-depleted flux tubes (Chen and Wolf, 1993) and associated bursty bulk flows (BBFs) in the PS (Sergeev et al., 2004, 2012; Sandholt et al., 2014). During “classical” substorms the HR is typically found in the 19:00–24:00 MLT sector (Nielsen and Greenwald, 1979). However, during the type of persistent strong solar wind forcing conditions we study (18 August 2003), the WEJ and the Harang reversal re-peatedly expanded into the 17:00–18:00 MLT sector, as doc-umented in a recent ground–satellite DMSP F13 conjunction study (Paper 1). The dusk–dawn polar passes of the DMSP F13 satellite used to identify the HRB in that study have been indicated in the figure.
In the conceptual model indicated in Fig. 1, we extend the standard two-loop model of the SCW (Sergeev et al., 2014) when we specify the inner loop connecting the partial ring current (PRC) and the ionosphere (EEJ in auroral oval south regime) via the Bostrøm type II current system. This is essen-tial for a proper description of M–I coupling during substorm activity.
As we shall see below, Geotail and Cluster data from the tail lobes and the combination of these observations with the GOES-10 monitoring of the substorm current wedge (SCW) at geostationary altitude allow us to discuss the substorm dy-namics in a broad M–I context, i.e. M–I coupling involving the outer and inner loops of the SCW and inductive electric field coupling from the tail lobes to the polar cap ionosphere.
3 Data description
3.1 Interplanetary data: ACE
[image:4.612.311.543.66.418.2]Figure 2 shows IP (interplanetary) magnetic field and plasma data from the ACE satellite on 18 August 2003. The pan-els show, from top to bottom, the proton density, bulk speed, temperature (in red: expected proton temperature after Lopez and Freeman, 1986), the dynamic pressure, the GSM compo-nents of the magnetic field and the total field, the Kan–Lee
Figure 2. Interplanetary data from the ACE satellite during the interval 04:00–11:00 UT. Panels from top to bottom show proton density (Np; cm−3); bulk speed (Vp; km s−1); proton temperature
Tp(K; in red the expected temperature after Lopez and Freeman,
1986); dynamic pressurePdyn (nPa), magnetic field components
Bx,By, andBzin GSM coordinates; the field strengthB(nT); the Kan–Lee merging electric field,EKL(mV m−1); the Alfvén Mach
number,MA; and the clock angle of the magnetic field (◦). The three
most geoeffective (seeEKL) magnetic field directional
discontinu-ities (DDs) are marked by vertical dashed guidelines.
merging electric field EKL (Kan and Lee, 1979), and the
clock angle, i.e. the polar angle in the GSM Y–Z plane.
EKL=V BTsin2(θ/2), whereV is the solar wind bulk speed, BT =(By2+Bz2)1/2, andθ is the clock angle. ACE was
lo-cated at (228,−34, 13)RE.
The data were acquired during the passage at Earth of a long-duration ICME lasting from 01:00 UT on 18 August until 15:00 UT on 19 August (Richardson and Cane, 2010). Three outstanding magnetic field direction discontinuities, and associated dynamic pressure changes, are marked by ver-tical guidelines. The transients at 06:00 and 09:55 UT are ex-pected to be geoeffective events (see abruptEKL increases),
are also (i) the wide range of variation in the dynamic pres-sure (Pdyn); (ii) the magnetic field vector, with its clock
an-gle spanning the range 180–130◦ (B
y<0 after 06:10 UT; Bz= −10 to−17 nT); and, most importantly, (iii) the high
values of the merging electric field (EKL=7–10 mV m−1)
and the low Alfvén Mach number (2–5) compared to typical solar wind values (∼8–10). The bulk speed was 500 km s−1 until 07:30 UT before it decreased to 470 km s−1later in the interval.
The clock angle increase (from 140 to 170◦) andEKL
en-hancement (from 7.2 to 8.2 mV m−1) at 09:55–10:00 UT led to a convection increase at the dayside polar cap boundary at∼11:00 UT, as inferred from ground magnetometer data (Sandholt et al., 2014). This is consistent with a propaga-tion delay from ACE of 65 min. The same effect on dayside PC convection occurred at∼07:00 UT, corresponding to the southward turning recorded by ACE at 06:00 UT (see Dis-cussion). The latter event was accompanied by an abruptEKL
increase from 8.5 to 10 mV m−1. The contributions from these magnetopause events (dayside source) to PC convec-tion enhancements and associated PCN-index increases can be estimated from the relation1PCN/PCN=1EKL/EKL.
We find that these1PCN/day events are minor in compari-son to the1PCN/night enhancements which are emphasized in this article.
[image:5.612.324.526.64.484.2]3.2 Magnetospheric data: GOES–Geotail–Cluster
Figure 3 shows the position of three spacecraft (GOES-10, Geotail, and Cluster-1) in the geocentric solar magneto-spheric (GSM) X–Y and X–Z planes during the central interval of our study: 06:00–12:00 UT. GOES-10 moved at geosynchronous altitude in the azimuthal direction from 21:00 MLT through midnight to 03:00 MLT. Geotail moved in the azimuthal direction on the dusk side, towards midnight (YGeotail=10 to 2RE;XGeotail= −11 to−12RE). Cluster-1
moved radially (inward) on the dawn side (YCluster= −5 to
−6RE;XCluster-1= −18 to−15RE). GOES-10 was located
in the Northern Hemisphere (ZGOES-10=1–2RE). Geotail
and Cluster-1, respectively, were located in the Southern Hemisphere lobe/plasma sheet and the plasma sheet/lobe (ZGeotail= −5 to−3RE;ZCluster-1= −4 to−7RE).
Figure 4 shows GOES-10 data during the interval 06:00– 15:00 UT, when GOES moved from 21:00 MLT through mid-night to dawn (06:00 MLT). We shall distinguish between two different event categories observed in sub-intervals I (06:00–12:00 UT; 21:00–03:00 MLT sector) and II (12:30– 15:00 UT; 03:30–06:00 MLT sector). Clear magnetic field dipolarizations at 06:25, 08:45, and 10:55 UT are marked by vertical guidelines. These events are characterized by abrupt (i) field magnitude decrease, (ii) Bx decrease, and
(iii) Bz increase. Each of these events is preceded by
inter-vals of field stretching (Bincrease,Bxincrease,Bzdecrease
to 10–20 nT) and energetic electron flux decreases: 06:10– 06:25, 08:00–08:45, and 10:15–10:55 UT. During the largest
Geotail/CL1 06-12 UT, AUG 18, 2003 (GSM)
-20 -15
-10 -5
0
X (RE)
-10 -5 0 5 10
Y (R
E
)
DUSK
DAWN
Geotail
Cluster 1 GOES10
7
9
11
7 9 11 7
9
11
GOES10/Geotail/Cluster 1 06-12 UT, AUG 18, 2003 (GSM)
-20 -15
-10 -5
0
X (RE)
-10 -5 0 5 10
Z (R
E
)
79
11
7 9 11 7 9
11
Figure 3. Tracks of three magnetospheric spacecraft in the GSM X–Y (a) andX–Z(b) planes during the interval 06:00–12:00 UT. GOES-10 moved from dusk to dawn at geosynchronous altitude. Geotail moved in the azimuthal direction on the dusk side to-wards the midnight sector (YGeotail=10 to 2RE;XGeotail=−11
to −12RE). Cluster 1 advanced earthward (XCluster-1= −18 to
−15RE) on the dawn side (YCluster= −5 to−6RE). GOES-10 was
located in the Northern Hemisphere (ZGOES-10=1–2RE).
Geo-tail and Cluster-1, respectively, were located in the Southern Hemi-sphere lobe/plasma sheet and the plasma sheet/lobe (ZGeotail= −5
to−3RE;ZCluster-1= −4 to−7RE).
dipolarization event (08:45–09:00 UT), theBzcomponent
in-creased from 15 to 100 nT (1Bz=85 nT) in 20 min (i.e. 1Bz/1t=5.7 nT min−1) This was accompanied by1B=
−40 nT.
Figure 4. GOES-10 data obtained during the interval 06:00– 15:00 UT. From top to bottom the panels showX,Y, andZ compo-nents of the magnetic field; the field magnitude; and the energetic differential electron fluxes in two energy regimes. Magnetic field dipolarizations (1Bx<0; 1Bz>0), current disruptions (1B < 0), and particle flux enhancements (sawtooth events) at 06:25, 08:45 and 10:55 UT are marked by vertical guidelines. A similar but weaker event (see particle fluxes) at 07:02 UT is also marked. The red line in the fourth panel gives the strength of the dipolar field. Magnetic field compression events at 13:20 and 14:05 UT are also marked.
This energetic particle behaviour is often referred to as saw-tooth events (see e.g. Henderson et al., 2006).
The By polarity shift from negative to positive at
∼09:00 UT marks when the satellite crosses from the dusk (premidnight) to the dawn (postmidnight) sector. After 12:30 UT (03:30 MLT: interval II) a different category of magnetic perturbation/particle flux events was recorded. This regime is characterized by magnetic field perturbation (field compression) events (B increase,Bx decrease,Byincrease, Bz increase) accompanied by energetic particle decreases
as detected during the intervals 13:20–13:35 and 14:05– 14:30 UT.
Figure 5 shows a combination of Geotail and Cluster data during the interval 06:00–15:00 UT. Clear field dipolar-izations at 07:02–07:25, 08:45–09:20, and 10:53–11:25 UT are detected by both spacecraft and are marked by dashed
Figure 5. Geotail (blue traces) and Cluster-1 data during the inter-val 06:00–15:00 UT. Panels from top to bottom show plasma den-sity and magnetic field componentsBx, By, andBz in GSM co-ordinates, and the field magnitude. Intervals of field dipolarization at 07:02–07:25, 08:45–09:20, and 10:53–11:25 UT are marked by dashed vertical guidelines. Dipolarization fronts detected by Geotail (not Cluster) at 13:00 and 13:40 UT (blue traces) are also marked.
vertical guidelines. A different category of events is seen at Geotail at 13:00 and 13:40 UT but not at Cluster. The lat-ter Geotail events (13:00/13:40 UT), appearing when Geotail entered the plasma sheet (see plasma density in top panel), are often referred to as dipolarization fronts (see e.g. Sitnov et al., 2009).
The dipolarization parameters1B,1Bx, and1Bzfor the
09:00 and 11:00 UT events are as follows:
I. 09:00 UT: 1B (GOES-10; X= −6.5RE)= −40 nT; 1B (Geotail; X= −11.7RE)= −17 nT; 1B
(Cluster-1; X= −16.3RE)= −13 nT. 1Bx
(GOES-10)= −50 nT; 1|Bx| (Geotail)= −15 nT; 1|Bx|
(Cluster 1)= −12 nT. 1Bz (GOES-10)=90 nT; 1Bz
(Geotail)=15 nT;1Bz(Cluster-1)=10 nT.
II. 11:00 UT: 1B (GOES-10; X= −5.7RE)= −30 nT; 1B (Geotail; X= −11.6RE)= −20 nT; 1B
(Clus-ter 1; X= −15.3RE)= −15 nT. 1Bx
(GOES-10)= −30 nT; 1|Bx| (Geotail)= −23 nT; 1|Bx|
(Cluster-1)= −18 nT. 1Bz (GOES-10)=50 nT; 1Bz
(Geotail)=25 nT;1Bz(Cluster-1)=10 nT.
The data indicate a tailward propagation of the CD peak (Bmin) during both the 09:00 and 11:00 UT events. The
max-imum of the CD events (Bmin) is delayed at Cluster
[image:6.612.312.544.65.304.2]GOES-10 August 18, 2003
6 7 8 9UT 10 11 12
0 20 40 60 80 100
Bz (nT)
MLT= 21-03
Poker Flat
6 7 8 9UT 10 11 12
1.05•104
1.10•104
1.15•104
1.20•104
1.25•104
H (nT)
MLT = 19--01
PCN
6 7 8 9 10 11 12
UT 1
2 3 4 5 6 7
[image:7.612.51.285.65.325.2]PCN (mV/m)
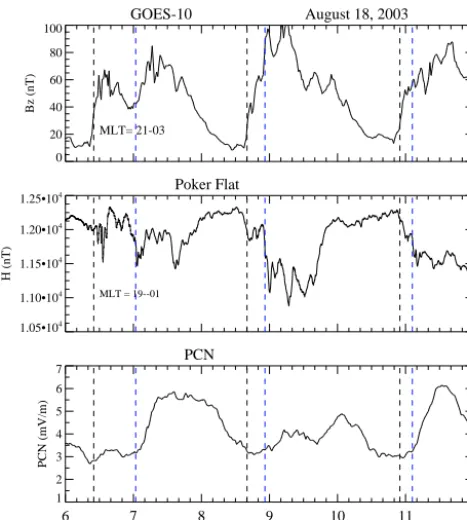
Figure 6. Panels from top to bottom show the GOES-10Bz com-ponent (nT), Poker Flat H-component deflection (nT), and the PCN index (mV m−1). Vertical dashed guidelines corresponding to pseudo-breakups (black) and major local onsets (blue) for each of the three sawtooth substorm are shown.
duration of the CD events maximizes at spacecraft Cluster-1. At the Cluster location the negative B gradient (CD event, marked by vertical guidelines in the figure) lasts ap-proximately 30 min during the 09:00 and 11:00 UT events. From the perspective of estimating the spatial scale of the magnetic deflection events in the X dimension, we find it to be of interest that the 09:00 and 11:00 UT perturbation events (the1B= −18.5 nT vs.−14 nT) are only marginally larger in the Geotail (X= −11.6RE) versus the Cluster (X=
−15.3RE) data.
3.3 Combined magnetosphere–ground data
Figure 6 shows a combination of three parameters ex-tracted from other figures: (i) the GOES Bz component,
(ii) Poker Flat H-component deflection, and (iii) the PCN index. Pseudo-breakups (t0, black) and major substorm
on-sets (t1, blue), as identified from Fig. 8 below, have been
marked by dashed vertical guidelines. This data combination illustrates the association between GOES-10Bz events,
[image:7.612.312.545.66.235.2]au-roral activity (WEJ intensifications), and the polar cap con-vection response (PCN) during the interval we study. We no-tice the major PCN increases following the onsets of major substorms at 07:02 and 11:00 UT. A similar effect, though less intense, is seen from 09:00 UT onwards. The persistent enhanced level of the PCN index during the intervals 07:20–
Figure 7. Cluster-1 magnetic fieldBx component trace (top, from Fig. 5) and the PCN index for the interval 06:00–15:00 UT. Three lobe magnetic field perturbation events are delimited by vertical guidelines.
08:15 and 09:10–10:20 UT are attributed to ongoing magne-totail reconnection. Decreasing PCN values (approaching the background, inter-event value of∼3 mV m−1) are observed in intervals of magnetic field line stretching (Bz<20 nT):
06:00–06:25, 08:15–08:40, and 10:20–10:55 UT. In these in-tervals the Poker FlatH component and AL index (Paper 1) show a state of partial recovery.
Figure 7 shows a combination of Cluster-1 observation of the magnetic field Bx component in the tail lobe and the
PCN index representing polar cap convection (Troshichev et al., 2000; Kullen et al., 2010). Three dipolarization events (1|Bx|<0) reported above are delimited by vertical
guide-lines. Figure 7 demonstrates that each of these dipolarization events is accompanied by a monotonic rise of the PCN index by 1 to 3 mV m−1.
In our terminology the substorm evolution in this case may be subdivided into three phases: (i) an initial transient phase (e.g. 07:00–07:20 UT), (ii) a persistent phase (07:20– 08:10 UT), and (iii) the phase of partial recovery (08:10– 08:45 UT). The initial transient phase is characterized by di-polarization of the lobe field (|Bx|decrease) and monotonic
rise of the PCN index (1PCN=1–3 mV m−1). The persis-tent phase is characterized by persispersis-tently high electrojet ac-tivity (AL≤ −800 nT), and a continuously high level of the PCN index (PCN≥4 mV m−1). The phase of partial recov-ery is characterized by stretching of the lobe field, AL par-tial recovery (AL≥ −800 nT), and PCN decrease approach-ing the background (dayside source) at 3 mV m−1. The AL
Arctic-Ft Yukon-Poker Fl-CIGO H-component August 18, 2003
6 7 8 9 10 11 12
UT 9.0•103
1.0•104
1.1•104
1.2•104
1.3•104
H (nT)
Arctic Ft YukonPoker Ft CIGO Gakona 63.6o
65.4o
65.7o
67.4o
68.7o
Figure 8. Alaska meridional chain magnetometer data
(H-component deflections) from stations Gakona (violet, 63.6◦MLAT), CIGO (blue, 65.4◦MLAT), Poker Flat (green, 65.7◦MLAT), Fort Yukon (red, 67.4◦MLAT), and Arctic Village (black, 68.7◦MLAT). Pseudo-breakups of the WEJ at 06:25, 08:40, and 10:55 UT are marked by vertical guidelines. Major onsets are identified at 07:02,∼09:00, and 11:00 UT.
3.4 Ground data across the auroral oval at midnight and postnoon MLTs
Figure 8 shows magnetometer data from stations in the Alaska meridional chain: Gakona (violet, 63.6◦MLAT), CIGO (blue, 65.4◦MLAT), Poker Flat (green, 65.7◦MLAT), Fort Yukon (red, 67.4◦MLAT), and Arctic Village (black, 68.7◦MLAT). Pseudo-breakups of the WEJ at 06:25, 08:40, and 10:55 UT are marked by dashed vertical guidelines. In contrast to the pseudo-breakups, the major onsets at 07:02, ∼09:00, and 11:00 UT are characterized by rapid poleward expansion of an intense WEJ (500–1000 nTHdeflection) up to Fort Yukon and Arctic Village (68.7◦MLAT) within 2– 3 min after the onset. This rapid expansion is followed by a long sequence of WEJ intensifications. The pattern of pro-longed WEJ activity is particularly clear during the 09:00– 09:40 and 11:00–12:00 UT events. At this time (09:00– 12:00 UT) the chain of Alaska stations moved through the ∼22:00–01:00 MLT sector.
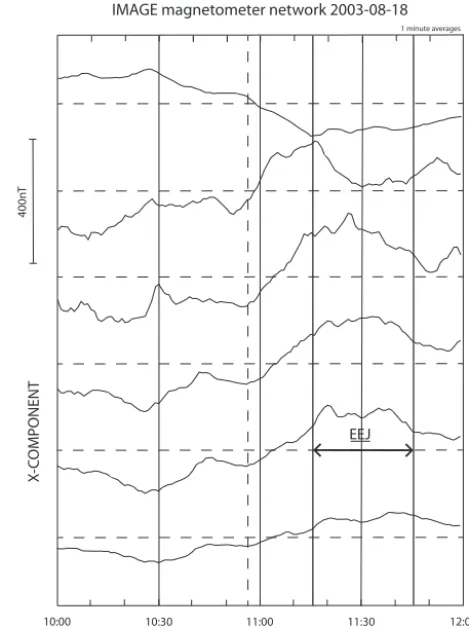
Figure 9 showsX-component magnetograms from stations in the IMAGE chain (Svalbard–Scandinavia–Finland region) spanning the latitude range from the polar cap (NAL at 75.4◦MLAT) via the auroral oval (SOR and OUJ at 66.3 and 61.0◦MLAT) to subauroral latitudes (TAR at 54.5◦MLAT). The negativeXdeflection at NAL corresponds to enhanced antisunward convection in the polar cap. Positive deflections at lower latitudes within the interval 11:17–11:45 UT corre-spond to the enhanced EEJ current (sunward return flow) in the postnoon sector of the auroral oval. The time of 11:00 UT corresponds to∼14:00–15:00 MLT along the IMAGE chain. This is an MLT sector where the impact from both the day-side and nightday-side convection sources is clearly seen. The
IMAGE magnetometer network 2003-08-18
X-COMPONENT
NAL
SOR
OUJ
HAN
NUR
TAR 1 minute averages
400n
T
10:00 10:30 11:00 11:30 12:00
Hour (UT)
[image:8.612.311.546.67.381.2]EEJ
Figure 9. IMAGE chain magnetometer data (X-component de-flections) from stations NAL (75.4◦MLAT), SOR (67.3◦MLAT), OUJ (61.0◦MLAT), HAN (58.7◦MLAT), NUR (56.9◦MLAT), and TAR (54.5◦MLAT). The interval of enhanced EEJ activity (11:17– 11:45 UT) at auroral oval south stations (HAN–NUR) is marked by vertical guidelines. The activity in the polar cap (NAL) and aur-oral oval north-expanded cleft (SOR) during the interval 10:57– 11:17 UT is attributed to the dayside convection source.
magnetic activity in the polar cap (NAL, 75.4◦MLAT) and in the auroral oval north regime (expanded cusp/cleft; see sta-tion SOR) in the interval 10:57–11:17 UT is attributed to the dayside convection source (seeEKLenhancement in Fig. 2).
Thus, these data nicely illustrate the ionospheric response to an abrupt enhancement of the magnetopause reconnection rate. The enhanced effect of the dayside convection source lasted 20 min.
The combined data sets from Alaska and IMAGE (Svalbard–Scandinavia–Finland region) indicate the wide MLT–MLAT ranges of the impact of the present substorm activity, including enhanced WEJ near midnight, increased EEJ activity expanding into the postnoon sector, and polar cap convection enhancement monitored by the PCN index.
4 Discussion
4.1 Substorms: the combined
magnetosphere–ionosphere perspectives
The ultimate goal of this type of study is to obtain an inte-grated view of the temporal evolution of the different chan-nels of M–I coupling operating during substorm activity (see Fig. 1). The central issue is the spatial–temporal evolution of PS–magnetotail dynamics involving such features as (i) near-Earth CD (dipolarization), (ii) reconnection of tail lobe mag-netic flux, and (iii) excitation of PC convection. In particu-lar, the role played by nightside reconnection in driving po-lar cap convection has been uncertain. Thus, according to Gordeev et al. (2011), “a direct quantitative evaluation of the efficiency of the nightside reconnection in contributing to the polar cap potential still awaits to be done”. We addressed this problem through our specific method of combining ground and satellite observations. Thus, our approach consists of a combination of the magnetospheric and ionospheric perspec-tives on the substorm activity. The main focus here is on M–I coupling during the variant of substorm activity appearing during interval I (06:00–12:30 UT) on 18 August 2003. This is a repetitive substorm activity driven by an ICME. In Pa-per 1 we documented central aspects of M–I coupling, with emphasis placed on a later interval II (13:00–17:00 UT) on this day.
The magnetospheric perspective consists of magnetic field and plasma data obtained from the magnetospheric space-craft GOES-10, Geotail, and Cluster-1 during consecu-tive current disruption and magnetic field dipolarizations in the near-Earth PS and tail lobe system. This is a case of sawtooth substorms, i.e. strong substorms recurring at 2–3 h intervals (see e.g. Henderson et al., 2006). In this interval GOES-10 moved azimuthally from dusk to pre-dawn (21:00–03:30 MLT) MLTs at geostationary altitude (XGOES-10 within −5 to −6RE; YGOES-10=5 to −4RE).
Geotail moved azimuthally from dusk to midnight (YGT=10
to 2RE) atXGT= −11 to −12RE. Cluster moved inward
(XCluster= −18 to −14RE) on the dawn side (YCluster∼
−6RE).
Using this observation geometry we were able to address the question of temporal–spatial evolution of the magneto-spheric magnetic perturbations initiated by near-Earth cur-rent disruption and magnetic field dipolarizations spanning the 21:00 to 03:00 MLT azimuthal sector. Thus, by combin-ing the observations from GOES, Geotail, and Cluster we
document the detailed evolution of these events in the near-Earth PS (X= −5 to−6RE;Z=1–2RE) and the tail lobes
(X= −11 to −17RE; Z= −4 to −6RE). We shall then
make estimates of the scale sizesLx andLy of the field
di-polarization process.
These observations are discussed in the context of M– I coupling. The ionospheric perspective consists of auroral electrojet activations obtained from magnetometer chains in Alaska and Scandinavia–Finland (IMAGE chain), the AL in-dex, and polar cap convection enhancements derived from the PCN index.
We address the long-standing question of the roles of in-ductive versus potential electric fields in M–I coupling dur-ing substorms. Concerndur-ing the inductive electric fields we infer from the magnetic field dipolarizations, we distinguish between the near-Earth PS events (EPSderived from GOES
data: δBz/δt) and the tail lobe events (ETL derived from
Geotail–Cluster data). The former (EPSoriginating in current
disruption in the near-Earth PS) drives the westward electro-jet centred at midnight (SCW), while the latter (ETL
originat-ing in magnetotail reconnection) drives polar cap convection (PCN index). In our sawtooth substorms, both phenomena (near-Earth current disruption and magnetotail reconnection) are strongly related in the meaning that one leads to the other. Thus we suggest the following scenario of magnetospheric processes: (i) near-Earth current disruption leading to activa-tion of the SCW with its “inner and outer loops” (see Sergeev et al., 2014), which is followed by (ii) activation of magnetic reconnection at the NENL (reconnection of lobe flux) with associated plasma injection. On the ionospheric level, this two-stage process is manifested as enhancements of (i) the auroral electrojets (via the Bostrøm type I and II systems) and (ii) the PCN index (see Fig. 1).
We distinguish between three stages of the evolution of the sawtooth substorms: (i) an initial transient phase charac-terized by a plasma sheet current disruption, an initial AL excursion followed by a monotonic PCN rise, (ii) a phase of persistent AL–PCN activity, and (iii) a phase of partial covery which is initiated by a switch-off of magnetotail re-connection. The latter stage is characterized by stretching of the tail magnetic field, partial recovery of AL excursion, and PCN decrease towards a background level provided by the dayside convection source (magnetopause reconnection).
Bostrøm type II system; see Fig. 1) reaching∼15:00 MLT at 11:17 UT (IMAGE chain; Fig. 9), and (v) auroral electrojet-and PCN decreases to the background level (cessation of re-connection of lobe flux) from 11:45 UT.
Figures 8 and 9 document the wide MLT range on the dusk side (15:00–24:00 MLT) of the impact of the substorm ac-tivity (eastward and westward electrojets), in addition to the polar cap convection enhancement, during the events we dis-cuss here.
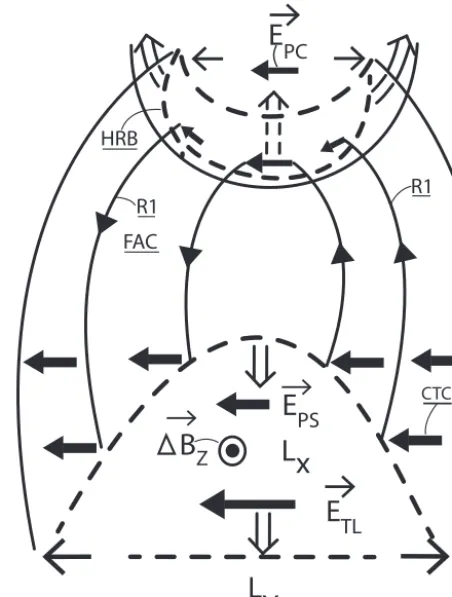
A simple illustration of the evolution of M–I coupling in the interval of substorm expansion after the onset is given in Fig. 10. Cross-field tail currents (CTCs), FACs (R1), and WEJ currents in the ionosphere are essential elements in the M–I coupling representing the outer loop of the SCW. Ra-dial (LX) and azimuthal (LY) expansions of the CD
(dipolar-ization) process correspond to poleward and east–west ex-pansions of the aurora (and WEJ), respectively. The repeated expansions of the WEJ into the 17:00–18:00 MLT sector dur-ing the present case (18 August 2003) was documented in a recent ground–satellite DMSP F13 conjunction study (Pa-per 1).
We distinguish between inductive electric fields excited by field dipolarizations in the PS and tail lobes. As argued below, the tail lobe dipolarization process (ETL∝δB/δt)
and its spatial scale in the dawn–dusk (Y) direction,LY,
con-tribute to the PC electric field (EPC) and to cross-polar-cap potential (CPCP)/night (i.e.EPC·LPC∝ETL·LY).LPCis the
cross-polar cap (dawn–dusk) distance.
4.2 Dipolarization events: spatial–temporal evolution and scale size estimates
As described above we infer a two-source nature of the mag-netic perturbations in the near-Earth PS and tail lobe sys-tem, i.e. near-Earth CDs and magnetotail reconnection. Thus, we expect that near-Earth CDs are the source of the GOES-10 dipolarizations, while magnetotail reconnection may also contribute in the later phase of the Cluster-1 dipolarizations (X≈ −16RE), in intervals like 07:05–07:30 UT, 09:05–
09:20 UT, and 11:05–11:25 UT, when the PCN index shows a monotonic rise (see Fig. 7).
Our reasoning on the two-source nature of tail lobe mag-netic perturbations (near-Earth PS current disruption ver-sus magnetotail reconnection) is based on two independent sets of observations: (i) a major PCN-index rise which re-quires reconnection of lobe flux (see e.g. Lockwood et al., 2009) and (ii) data from the Wind satellite (not shown) in the tail (X= −77RE) showing reconnection signatures
in the form of magnetic field reconfigurations (from Bx
-dominated to Bz-dominated) and associated energetic
par-ticle flux enhancements during our events (07:00–09:00– 11:05 UT). These Wind observations may be explained in the context of magnetohydrodynamic (MHD) simulations re-ported by Sauvaud et al. (2012) (see their Fig. 13).
CTC
LY
E
TLB
ZLx
E
PSHRB
R1 FAC
R1
[image:10.612.314.540.68.367.2]E
PCFigure 10. Schematic illustration of PS current disruption and asso-ciated auroral expansion after a major onset (t1). The geometry of
a system of cross-tail currents (CTCs), FACs, and WEJ currents in the ionosphere are indicated at different times during the M–I cou-pling process. Electric fields in the PS (EPS) and tail lobes (ETL)
related to the PS–tail-lobe magnetic field dipolarization (1Bz/1t) processes, as well as the PCEfield (EPC), have been marked.
Spa-tial scales of the CD (dipolarization) process are markedLX and LY.
In the following we emphasize the dipolarizations of the sawtooth events initiated at 08:45 and 10:55 UT. Both these events show well-defined 1B, 1Bx, and 1Bz signatures
at all three spacecraft. The two dipolarizations at GOES-10 are abrupt and have a large magnitude (1B= −40 nT;
1Bz=50–80 nT;1Bx= −50 nT at 08:45 UT). The
corre-sponding tail lobe deflections at Geotail and Cluster are eas-ily identified, but they are smaller perturbations (1B= −15 to−20 nT;1Bx= −10 to−20 nT;1Bz=10 to 25 nT) and
evolve more gradually over 15–30 min long intervals. The dipolarization phase at Cluster (X= −15 to −16RE; Y=
−6RE) is longer (maximum reached later) than at Geotail
(X= −10 to−11RE;Y=3–9RE). This observation is
Both the dipolarization and the preceding field line stretch-ing are widely extended phenomena in the dawn–dusk direc-tion. The events were observed by GOES-10 when it moved from evening (21:00 MLT) through midnight to pre-dawn (03:00 MLT). According to Lavraud and Borovsky (2008), a wide (cross-tail) regime of field stretching is expected dur-ing conditions of low Alfvén-Mach number in ICMEs. This is the condition of our case:MA=3–4.
Then we add that the 07:00 UT dipolarization event was also observed by Cluster (X= −17RE). From these
obser-vations we conclude that the scale sizes of the magnetic per-turbation events in theXandY dimensions areLx≈15RE
andLy≥15RE. Our azimuthal coverage on the dawn side is
limited (YCluster-1≥ −6RE). The dusk-side observations of
dipolarizations by Geotail extend toY =10RE. Thus, from
symmetry considerations we shall use Ly=20RE for the
azimuthal extent of the lobe magnetic perturbation.
Lx is estimated to be ∼15RE, i.e. dipolarization
cover-ing the radial extent from the inside of GOES-10 to the out-side of Cluster-1: ∼ −5 to −20RE. As support for the
lat-ter inference we note the similar, large 1B and 1Bx
am-plitudes recorded by Geotail (X= −11.7RE) and Cluster
(X= −15.3RE) at 11:00 UT (see Fig. 5).
Related to this we note that Sergeev et al. (2014) re-cently presented a model of the SCW system, responsible for the field dipolarization, consisting of a two-loop sys-tem (one loop with R2 sense FAC connected to the par-tial ring current and the other with R1 sense FAC coupled to the near-Earth plasma sheet) located at radial distances between X= −6 and −14RE. Sergeev et al. (2014)
com-pared their model current system with a statistical study of dipolarization amplitudes (1Bz) observed atX= −6.6 and
−11RE. Our observations by GOES-10 and Geotail are
com-parable with their results. Specifically we note their∼30 min long events of1Bz≈15 nT atX= −11RE, as detected by
THEMIS probes. In our case Geotail (X= −11RE; Y=
3RE;Z= −4RE) observed 15 and 30 min long events with 1Bzamplitudes of≈15 and 25 nT at 09:00 and 11:00 UT,
re-spectively. Our Cluster-1 (X= −15.3RE;Y= −5RE;Z=
−7RE) event at 11:00 UT shows a 30 min longBz increase
of 10 nT.
Our reported observations of field dipolarizations from the GOES-10–Geotail–Cluster-1 constellation in the near-Earth PS and tail lobes will then be discussed in relation to the results of the previous studies by Sergeev et al. (2011) and Sauvaud et al. (2012). In their multi-spacecraft studies, both Sauvaud et al. (2012) and Sergeev et al. (2011) doc-umented the large-scale nature of magnetospheric magnetic perturbations during substorms. Sergeev et al. (2011) stud-ied small (AE≤500 nT), isolated substorms using a similar satellite constellation (GOES–Geotail–Cluster) to what we are using. Geotail was moving azimuthally atX= −12RE.
Cluster moved radially (X within−6 to−18RE) and spent
most of the time in the lobes. They point out that the lack of coverage in the azimuthal direction did not allow them
to determine the longitudinal extent of the disturbance from the space data. They note that some of the substorm dipo-larizations were not detected at GOES-17 and Geotail when theY coordinates of these spacecraft were 5 to 6RE. This
indicates a limit on the longitudinal scales of these mag-netic perturbation events:LY ≤8RE. TheBz perturbations
of their events at geostationary altitude and in the tail lobe at
X= −12RE(Geotail) are given by1Bz/1t(geostationary)
∼15 nT/10 min and1Bz/1t (lobe)∼(5–10) nT/15 min,
re-spectively. These values are significantly lower than values for our repetitive, strong substorms (AL≤ −1000 nT).
Sauvaud et al. (2012) found that dipolarization is a com-mon feature of the geomagnetic tail, observed at 10–18RE
from the Earth, in the nightside plasma sheet and lobe dur-ing conditions similar to ours, i.e. repetitive substorms durdur-ing storm time. These events are related to substorm onsets and propagate tailward from the 10–12RE regime at velocities
of 100–600 km s−1. They measured magnetic perturbations
in the tail lobe (Cluster data atX= −18RE). In these cases
they observed dipolarization parameters1Bz/1t (lobe)∼
10 nT/10 min and1|Bx|/1t (lobe) ∼ −10 nT/10 min. The
latter values are similar to our observations in the tail lobes. But our events are initiated by current disruptions closer to Earth, near geostationary heights. This is inferred from the steep, strong B gradients measured by GOES-10 (Fig. 4). In the tail lobes atX= −11 (Geotail) to−18RE (Cluster-1),
our events, initiated by abrupt dipolarizations at geostation-ary altitude (GOES-10), evolve into 15–25 min long dipolar-ization events before the new field-stretching phase sets in.
Sauvaud et al. (2012) found that the lobe magnetic field perturbations coincided with increases of the lobe electric field of ∼2.5 mV m−1. The measured electric field values
were found to be consistent with an inductive electric field source (Eind∝δB/dt). According to Sauvaud et al. (2012)
“the lobe magnetic field changes appear to be the signature of a tailward retreating neutral line, with its associated current disruption/reduction.” This interpretation is consistent with our observations.
4.3 Inductive electric fields and polar cap convection
The estimated large value of the inductive electric field in the plasma sheet in the early (∼5–10 min) stage of the major sawtooth expansion (EPS=(1Bz/1t )·LX≈5 mV m−1) is
attributed to the rapid tailward (LX) and longitudinal (LY)
expansions of the field dipolarization process (1Bz/1t≈
50 nT/10 min≈10−10V m−2). These are reflected in the
au-roral electrojet (see Fig. 8 and AL index in Paper 1). Relevant to us here is also the dawn–dusk electric potential in the tail lobes which can be transferred along open field lines to the polar cap and give rise to polar cap convection and corre-sponding PCN increases.
Based on our estimates of the spatial (LX∼15RE;LY ∼
20RE) and temporal (15–30 min) scales of the tail lobe
cross-tail potential generated during the evolution of dipolar-ization process in the tail lobes. This parameter is particu-larly important since it can be a source of polar cap potential enhancements during the initial transient phase of substorm expansions (marked by vertical guidelines in Fig. 7).
An estimate of the cross-tail potential (CTP) can be de-rived as follows: CTP=ECT·LY ≈ETL·LY, whereETL= (1Bx/1t )·Lz.
This expression for ETL is based on Faraday’s law for
the case of an EY-dominated electric field component and
small gradients in the y direction (δ/δy≈0) in the system of plasma sheet tail lobes: δEY/δx= −δBz/δt; δEY/δz= δBx/δt. Then we obtain the relations we shall apply in this
study:1EY ≈ −(1Bz/1t )·LXand1EY ≈(1BX/1t )·LZ,
whereLXandLZare characteristic scale lengths of the
mag-netic perturbations in theXandZ dimensions (1Bz/1x= Bz/Lx;1Bx/1z=Bx/Lz).
In our case 1Bz/1t (TL) ∼15 nT/15 min (see Geotail
data). Then we apply the derived estimates of the spatial scales of the magnetic perturbations in the tail lobes during the documented dipolarization events: LX=15RE; Ly=
20RE; Lz=25RE. The latter value (Lz=25RE) is taken
from Sauvaud et al. (2012). This givesETL∼2.5 mV m−1. 1CTP=2.5 mV m−1×20RE=320 kV.
An estimate of the polar cap potential can be obtained when we use the M–I potential transmission factor derived by Gordeev et al. (2011):1CPCP=(0.1–0.2)·1CTP. Then we have1CPCP=(0.1–0.2)·1CTP≈30–60 kV. Due to the lack of spacecraft coverage beyond YGSM=10RE, the
in-ferred CPCP values are lower limits. Thus, for the first time, we establish lower limits on the contribution to the CPCP from inductive electric field coupling between the tail lobes and the polar cap ionosphere.
At this stage we take advantage of the following expres-sion for the empirical relation between CPCP enhancements and PCN increases during the category of events we study (Sandholt et al., 2012): 1CPCP (V)≈51PCN (mV m−1)·LPC (km).LPC is the cross-polar cap distance.
In our case LPC ∼4500 km (see Paper 1). This gives 1PCN=(30–60) kV/(5×4500 km)=(1.3–2.6) mV m−1. This estimate fits well with the ground observations of polar cap convection enhancement (PCN rises of 1.5–3 mV m−1) in the initial transient phase of M–I coupling in these substorm cases (see PCN index in Fig. 7).
5 Summary and conclusions
The repetitive storm-time substorm activity excited during the Earth passage of an ICME on 18 August 2003 may be divided in two different variants occurring in two subinter-vals: I (04:00–12:30 UT) and II (12:30–18:00 UT). As doc-umented in Paper 1, the AL–PCN activity in interval I re-curs at 2–2.5 h intervals, while the interval II activity consists of shorter AL-PCN events recurring at 20–50 min intervals.
The interval I substorm activity is accompanied by parti-cle injections to geostationary altitude, which are often re-ferred to as sawtooth events (Henderson et al., 2006). As dis-cussed in Noah and Burke (2014), the two types of storm-time substorm activity may correspond to different condi-tions of magnetotail reconnection in the presence of strong ring current developments, i.e. sustained near-Earth neutral line (NENL) activity versus a state of more chaotic (sporadic) magnetotail merging. As described in more detail below, in this paper we extend the initial study (Paper 1) in different ways by addition of data sets referring to the magnetospheric and ionospheric levels which are relevant for shedding light on basic elements of M–I coupling prevailing during the saw-tooth substorms observed in interval I, when the ring current index SYM-H lies within−80 to−100 nT.
Based on data from a fortuitous configuration of magneto-spheric satellites, we have documented the spatial–temporal evolution of magnetic perturbations (dipolarizations) in the near-Earth plasma sheet (GOES-10) and in the tail lobes (Geotail and Cluster-1) during sawtooth substorms. The Geotail–Cluster configuration in the present case gives in-formation about the large-scale nature of the tail lobe per-turbations appearing during sawtooth substorms. In the in-terval, we study Geotail–Cluster-detected magnetic pertur-bations in a large sector of the tail lobes:XGSM= −11 to
−17RE;YGSM= −6 to 10RE. This represents an extension
with respect to similar type of data published in previous work (see e.g. Sergeev et al., 2011; Sauvaud et al., 2012). The extended spacecraft coverage was applied to make reason-able estimates of CPCP enhancements from inductive elec-tric field coupling between the tail lobes and the polar cap ionosphere.
Ground signatures of activations of the substorm current loops (see Fig. 1), as they appear in the westward elec-trojet around midnight and in the eastward elecelec-trojet at 14:00–15:00 MLT (see the 11:17–11:45 UT event), are doc-umented by magnetograms from Alaska and the Svalbard– Scandinavia–Finland region, respectively. These ground data reflect the wide MLT–MLAT ranges of the impact of the present substorm activity (eastward and westward electrojets and polar cap convection). By combining the observations on the magnetosphere and ionosphere levels of the substorm ac-tivity, we can infer a scenario of M–I coupling events involv-ing near-Earth current disruption and magnetotail reconnec-tion, associated activations of substorm current loops (SCW), and their manifestations in auroral electrojets and electric field coupling to the polar cap ionosphere.
This paper serves as an extension of Paper 1, as indi-cated below. We place the activations of the SCW during the documented “sawtooth variant” (GOES-10 data at geo-stationary altitude) of substorm activity in the larger con-text of ionospheric and magnetotail dynamics, most notably tail lobe magnetic field perturbations obtained by Geotail (X∼ −11RE) and Cluster-1 (X= −18 to−15RE).
the role that the induction electric field plays in the excita-tion of polar cap convecexcita-tion, as monitored by the PCN index. On this point we refer to the good correlation we found be-tween theBxdeflections of the tail lobe (Cluster-1) and the
monotonic rise of the PCN index marked by vertical dashed guidelines in Fig. 7. Estimates of the dawn–dusk-directed tail lobe induction electric field (ETL∼(1Bx/1t )·Lz), as well
as its scale size in theY dimension (LY ≥20RE), which are
derived on the basis of the favourable configuration of Geo-tail and Cluster-1, were used to calculate the polar cap con-vection response during the initial substorm expansion phase. The contribution to the CPCP is estimated from the following relation: CPCP=(0.1–0.2)·ETL·LY ≈30–60 kV. This
cor-responds to the observed 1.5 to 3 mV m−1 increases of the PCN index. Due to the lack of spacecraft coverage (Geotail– Cluster) beyond YGSM= ±10RE the inferred CPCP values
are lower limits.
The broader ionospheric context of the SCW documented in this paper is based on readings from the IMAGE chain magnetometer data in the postnoon sector (EEJ activity near 14:00–15:00 MLT) combined with Alaska chain data from the midnight sector (WEJ activity near 24:00 MLT). In this way we can monitor ionospheric signatures of the “inner” and “outer” loops of the SCW–PRC system. The “inner loop” consists of the PRC–EEJ (on the dusk side) connection via a Bostrøm type II system. The outer loop consists of the con-nection between the CTC (disruption of the cross-tail cur-rent) and the WEJ via a Bostrøm type I system (see Fig. 1). Thus, in our extended two loop model of the SCW we specify the connection between the standard “inner loop” (Sergeev et al., 2014) and the EEJ (dusk side) via a Bostrøm type II current system (our Fig. 1). This extension of the standard two-loop model of the SCW is essential in order to obtain a relevant description of M–I coupling and the timescales of the system. By combining ground observations relating to ionospheric manifestations of both current loops (WEJ at 24:00 MLT and EEJ at 14:00–15:00 MLT) we are able to determine the characteristic time of activation/expansion of the complex substorm current system. In the case of the 11:00 UT event we note a 17 min delay between the major intensification of the WEJ (Alaska chain) at 11:00 UT (WEJ at 24:00 MLT, representing activation of the “outer loop”) and the full expansion of the EEJ activation (IMAGE data) to 14:00–15:00 MLT (representing the “inner loop”). This 17 min interval corresponds to the injection of plasma (PS) from the “outer” to the “inner loop” and the associated brak-ing and azimuthal deflection of the plasma at the PS–PRC boundary which constitutes a dynamo (E·J <0) for the Bostrøm type II system, as indicated schematically in Fig. 1. The sawtooth substorm events are furthermore discussed in relation to magnetotail reconnection on the basis of Wind observations of reconnection signatures atX= −77RE(ion
flux variations in relation to magnetic field configurations) and the polar cap index (PCN). This effort lead us to distin-guish between the following three substorm stages:
i. an initial transient phase dominated by
a. large-scale magnetic field dipolarization in the az-imuthal (21:00–03:00 MLT) and radial dimensions of the PS (activation of inner and outer loops of SCW-EEJ/WEJ activity) and
b. tail lobe magnetic perturbations with associated in-ductive electric field coupling to the polar cap iono-sphere (PCN monotonic rise);
ii. a persistent phase of PS field dipolarization(s) and cor-responding electrojet (EEJ/WEJ)–PCN activity; iii. a phase of PS and tail lobe magnetic field stretching,
partial recovery of electrojet activity, and PCN decrease towards the background level (dayside source) after the cessation of magnetotail reconnection.
In summary, we emphasize two elements of our study: (i) a combination of M–I data sets is discussed within the frame-work of a two-loop model of the SCW/PRC–ionosphere con-nection applicable to the prevailing substorm activity where we identify “outer” and “inner loop” manifestations in the near-Earth plasma sheet (GOES data)–auroral oval/midnight (Alaska chain data) and in the oval south regime at 14:00– 15:00 MLT (IMAGE chain data), respectively, and (ii) obser-vations of inductive electric field coupling between the mag-netotail lobes (Geotail–Cluster data) and the polar cap iono-sphere (PCN index), i.e. excitation of PC convection, lead-ing us to make a qualified estimate of its contribution to the cross-polar cap potential.
Acknowledgements. We thank the Geophysical Institute, University
of Alaska, Fairbanks, for access to geomagnetic data obtained from the Alaska meridian chain of magnetometers. We thank the insti-tutions who maintain the IMAGE array of magnetometers (FMI, Finland, and Geophysical Observatory, Tromsø, Norway). IMAGE data used in this study were obtained from www.geo.fmi.fi/image. Work supported in part by NASA grants NNX10AQ29G and NNX13AP39G.
Topical Editor L. Blomberg thanks A. Kullen and the two anonymous referees for their help in evaluating this paper.
References
Aikio, A. T., Sergeev, V. A., Shukhtina, M. A., Vagina, L. I., Angelopoulos, V., and Rees, G. D.: Characteristics of pseudo-breakups and substorms observed in the ionosphere, at geosyn-chronous orbit, and in the midtail, J. Geophys. Res., 104, 12263– 12287, doi:10.1029/1999JA900118, 1999.
Akasofu, S.-I.: The development of the auroral substorm, Planet. Space Sci., 12, 273–282, 1964.
Birn, J. and Hesse, M.: The substorm current wedge in
MHD simulations, J. Geophys. Res., 118, 3364–3376,
doi:10.1002/jgra.50187, 2013.
Bostrøm, R.: A model of the auroral electrojets, J. Geophys. Res., 69, 4983–4999, 1964.
Bostrøm, R.: Currents in the ionosphere and magnetosphere, in: The Birkeland Symposium on Aurora and Magnetic Storms, edited by: Egeland, A. and Holtet, J., 445–458, C.N.R.S., Sandefjord, 1967.
Chen, C. X. and Wolf, R. A.: Interpretation of high-speed flows in the plasma sheet, J. Geophys. Res., 98, 21409–21419, 1993. Cowley, S. W. H.: The role and location of magnetic reconnection
in the geomagnetic tail during substorms, in: SUBSTORMS 1, ESA SP-335, 401–404, 1992.
Friedrich, E., Samson, J. C., Voronkov, I., and Rostoker, G.: Dy-namics of the substorm expansive phase, J. Geophys. Res., 106, 13145–13163, 2001.
Gordeev, E. I., Sergeev, V., Pulkkinen, T. I., and Palmroth, M.: Contribution of magnetotail reconnection to the cross-polar cap electric potential drop, J. Geophys. Res., 116, A08219, doi:10.1029/2011JA016609, 2011.
Henderson, M. G., Skoug, R., Donovan, E., Thomsen, M. F., Reeves, G. D., Denton, M. H., Singer, H. J., McPherron, R. L., Mende, S., Immel, T. J., Sigwarth, J. B., and Frank, L. A.: Sub-storms during the 10–11 August 2000 sawtooth event, J. Geo-phys. Res., 111, A06206, doi:10.1029/2005JA011366, 2006. Kan, J. R. and Lee, L. C.: Energy coupling function and solar
wind-magnetosphere dynamo, Geophys. Res. Lett., 6, 577–580, 1979. Katus, R. M., Liemohn, M. W., Gallagher, D. L., Ridley, A., and Zou, S.: Evidence for potential and inductive convec-tion during intense geomagnetic events using normalized su-perposed epoch analysis, J. Geophys. Res., 118, 181–191, doi:10.1029/2012JA017915, 2013.
Koskinen, H. E. J., Lopez, R. E., Pellinen, R., Pulkkinen, T. I., Baker, D. N., and Bøsinger, T.: Pseudobreakup and substorm growth phase in the ionosphere and magnetosphere, J. Geophys. Res., 98, 5801–5813, 1993.
Kozelova, T. V., Pudovkin, M. I., and Treilhou, J. P.: Development of the auroral bulge and dipolarization at 6.6rE, in: SUBSTORM
1, ESA SP-335, 1992.
Kullen, A., Ohtani, S., and Karlsson, T.: Geomagnetic signatures of auroral substorms preceded by pseudobreakups, J. Geophys. Res., 114, A04201, doi:10.1029/2008JA013712, 2009.
Kullen, A., Karlsson, T., Cumnock, J. A., and Sundberg, T.: Occurrence and properties of substorms associated
with pseudobreakups, J. Geophys. Res., 115, A12310,
doi:10.1029/2010JA015866, 2010.
Lavraud, B. and Borovsky, J. E.: Altered solar wind-magnetosphere interaction at low Mach numbers: Coronal mass ejections, J. Geophys. Res., 113, A00B08, doi:10.1029/2008JA013192, 2008.
Lockwood, M., Hairston, M., Finch, I., and Roillard, A.: Transpolar voltage and polar cap flux during the substorm cycle, J. Geophys. Res., 114, A0120, doi:10.1029/2008JA013697, 2009.
Lopez, R. E. and Freeman, J. W.: Solar wind proton temperature-velocity relationship, J. Geophys. Res., 91, 1701–1705, 1986. Lui, A. T. Y.: A synthesis of magnetospheric substorm models, J.
Geophys. Res., 96, 1849–1856, doi:10.1029/90JA02430, 1991.
Lui, A. T. Y.: Auroral activity associated with fast plasma flows in the magnetotail, Geophys. Res. Lett., 27, 3245–3248, 2000. Lui, A. T. Y. and Murphree, J. S.: A substorm with onset
tied to an auroral arc, Geophys. Res. Lett., 25, 1269–1272, doi:10.1029/98GL00758, 1998.
McPherron, R. L., Russell, C. T., and Aubry, M. A.: Satellite stud-ies of magnetospheric substorms on August 15, 1968, 9, phe-nomenological model for substorms, J. Geophys. Res., 78, 3131– 3149, 1973.
Nakamura, R., Baker, D. N., Belian, R. D., and Yamamoto, T.: Spa-tial scale of the substorm onset region determined from multi-point satellite and ground-based observations, in: SUBSTORMS 1, ESA SP-335, 353–357, 1992.
Nakamura, R., Baker, D. N., Yamamoto, T., Belian, R. D., Bering III, E. A., Benbrook, J. R., and Theall, J. R.: Particle and field signatures during pseudobreakup and major expansion onset, J. Geophys. Res., 99, 207–221, doi:10.1029/93JA02207, 1994.
Nielsen, E. and Greenwald, R. A.: Electron flow and visual aurora at the Harang discontinuity, J. Geophys. Res., 84, 4189–4200, 1979.
Noah, M. A. and Burke, W. J.: Magnetospheric conditions for saw-tooth event development, J. Geophys. Res., 119, 2494–2511, doi:10.1002/2013JA019573, 2014.
Pulkkinen, T. I., Baker, D. N., Wiltberger, M., Goodrich, C., Lopez, R. E., and Lyon, J. G.: Pseudobreakup and substorm onset: Ob-servations and MHD simulations compared, J. Geophys. Res., 103, 14847–14854, 1998.
Pulkkinen, T. I., Partamies, N., McPherron, R. L., Henderson, M., Reeves, G. D., Thomsen, M. F., and Singer, H. J.: Comparative statistical analysis of storm time activations sawtooth events, J. Geophys. Res., 112, A01205, doi:10.1029/2006JA012024, 2007. Richardson, I. G. and Cane, H. V.: Near-Earth interplanetary coro-nal mass ejections during solar cycle 23 (1996–2009): Catalog and summary of properties, Sol. Phys., 264, 189–237, 2010. Sandholt, P. E., Andalsvik, Y. L., and Farrugia, C. J.: The pulsed
nature of the nightside contribution to polar cap convection: repetitive substorm activity under steady interplanetary driving, Ann. Geophys., 30, 1539–1553, doi:10.5194/angeo-30-1539-2012, 2012.
Sandholt, P. E., Farrugia, C. J., and Denig, W. F.: M–I coupling across the auroral oval at dusk and midnight: repetitive substorm activity driven by interplanetary coronal mass ejections (CMEs), Ann. Geophys., 32, 333–351, doi:10.5194/angeo-32-333-2014, 2014.
Sauvaud, J.-A., Jacquey, C., Oka, M., Palin, L., Fruit, G., Kistler, L. M., Balough, A., Cao, J. B., Reeves, G., Mukai, T., Shinohara, I., and Grigorenko, E.: A study of the near-Earth plasma sheet and lobe driven by multiple substorms: Comparisons with a full par-ticle simulation of reconnection, J. Geophys. Res., 117, AO1221, doi:10.1029/2011JA017033, 2012.
Sergeev, V. A., Liou, K., Newell, P. T., Ohtani, S.-I., Hairston, M. R., and Rich, F.: Auroral streamers: characteristics of associated pre-cipitation,convection and field-aligned currents, Ann. Geophys., 22, 537–548, doi:10.5194/angeo-22-537-2004, 2004.
com-parison with ground, geosynchronous, and tail lobe data, J. Geo-phys. Res., 116, A07218, doi:10.1029/2011JA016471, 2011. Sergeev, V. A., Angelopoulos, V., and Nakamura, R.: Recent
ad-vances in understanding substorm dynamics, Geophys. Res. Lett., 39, L0511, doi:10.1029/2012GL050859, 2012.
Sergeev, V. A., Nikolaev, A. V., Tsyganenko, N. A., Angelopoulos, V., Runov, A. V., Singer, H. J., and Yang, J.: Testing a two-loop pattern of the substorm current wedge, J. Geophys. Res., 119, 947–963, doi:10.1002/2013JA019629, 2014.
Sitnov, M. I., Swisdak, M., and Divin, A. V.: Dipolarization fronts as a signature of transient reconnection in the magnetotail, J. Geo-phys. Res., 114, A04202, doi:10.1029/2008JA013980, 2009.