Creative Components Iowa State University Capstones, Theses and Dissertations
Fall 2018
Enhancing Sidewalk Connectivity within the DART Public
Enhancing Sidewalk Connectivity within the DART Public
Transportation System
Transportation System
Daniel Dvorjak
Iowa State University, [email protected]
Follow this and additional works at: https://lib.dr.iastate.edu/creativecomponents Part of the Urban, Community and Regional Planning Commons
Recommended Citation Recommended Citation
Dvorjak, Daniel, "Enhancing Sidewalk Connectivity within the DART Public Transportation System" (2018). Creative Components. 56.
https://lib.dr.iastate.edu/creativecomponents/56
i
Enhancing Sidewalk Connectivity within the DART Public Transportation System
by
Daniel C. Dvorjak
A professional report submitted to the graduate
faculty in partial fulfillment of the requirements for the degree of MASTER OF COMMUNITY AND REGIONAL PLANNING
Major: Community and Regional Planning
Program of Study Committee: Dr. Mônica Haddad, Major Professor
Dr. Susan Bradbury Dr. Ben Shirtcliff Dr. Brian Gelder
Iowa State University Ames, Iowa
ii
DEDICATION
iii
Table of Contents
Table of Contents ... iii
LIST OF FIGURES ... v
LIST OF TABLES ... vi
EXECUTIVE SUMMARY ... vii
1. INTRODUCTION ... 1
2. STUDY AREA ... 4
2.2 PLANNING AND CONNECTIVITY IN THE STUDY AREA ... 11
3. LITERATURE REVIEW ... 13
3.1 Sustainability and Public Transportation ... 13
3.2 Planning for Social Justice ... 14
3.3 Empirical Studies ... 16
4. METHODOLOGY ... 19
4.1 Data ... 19
4.2 Descriptive Statistics ... 25
4.3 Methodological Steps ... 31
4.3.1Identifying the Missing Sidewalks ... 34
4.3.1.1 Raster Pre-Processing ... 34
4.3.1.2 Segmentation & Classification ... 34
4.3.1.3 Missing Sidewalk Centerlines ... 38
4.4 Exploratory Spatial Data Analysis ... 46
4.5 Automation ... 48
4.6 Validation ... 51
5. RESULTS ... 53
5.1 Identifying Missing Sidewalks ... 53
5.2 Exploratory Spatial Data Analysis ... 54
5.2.1 Global Indicators of Spatial Autocorrelation ... 55
5.2.2 Local Indicators of Spatial Autocorrelation ... 56
iv
5.4 Validation ... 64
5.4 Automation ... 69
5.4.1 Study Area ... 69
5.4.2 Des Moines ... 72
5.5 Sidewalk Connectivity and Ridership ... 74
6. CONCLUSION ... 77
References ... 81
APPENDIX A: PYTHON SCRIPT FOR SIDEWALK RANKING... 87
APPENDIX B: MODELS FOR EXTRACTING PAVED AREA FROM RASTER IMAGE ... 90
APPENDIX C: MODEL FOR CREATING POLYGON SEARCH AREA FOR SIDEWALK IDENTIFICATION ... 91
APPENDIX D: MODEL FOR IDENTIFYING MISSING SIDEWALKS ... 92
APPENDIX E: SOCIO-ECOMONIC STATISTICS FOR THE STUDY AREA, 2016 ... 93
v
LIST OF FIGURES
Figure 1: Study Area ... 5
Figure 2: Des Moines within the MPO Boundary, 2016 ... 7
Figure 3: DART Bus Routes, 2011 ... 10
Figure 4: Bus Stops in Des Moines, 2018 ... 20
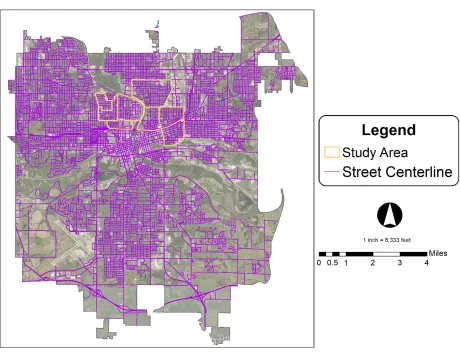
Figure 5: Street Centerlines, 2017 ... 21
Figure 6: Aerial Imagery, 2017 ... 22
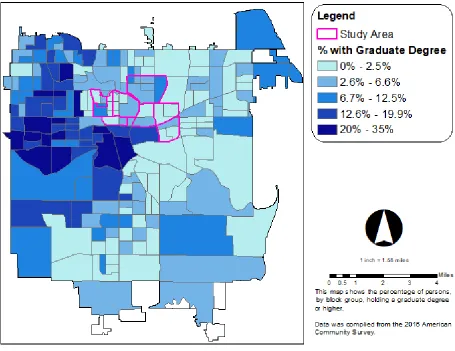
Figure 7: Percentage Graduate Degrees by Block Group, 2016 ... 28
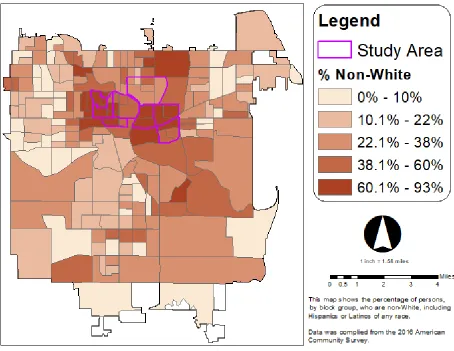
Figure 8: Percentage Non-White by Block Group, 2016 ... 29
Figure 9: Percentage Near Poverty and Poverty by Block Group, 2016 ... 30
Figure 10: Methodological Steps ... 33
Figure 11: Example of Before and After Segmentation ... 35
Figure 12: Example of Classified Image ... 37
Figure 13: Steps for Identifying Missing Sidewalks ... 39
Figure 14: Non-Validated Missing Sidewalks ... 54
Figure 15: Percentage Graduate Degrees ... 57
Figure 16: Percentage Non-White ... 58
Figure 17: Percentage Poverty ... 59
Figure 18: Low-Low Graduates with Missing Sidewalks ... 60
Figure 19: High-High Non-White with Missing Sidewalks ... 61
Figure 20: High-High Poverty with Missing Sidewalks ... 62
Figure 21: Brick Sidewalk at 12th & Clinton ... 64
Figure 22: Brick Sidewalk at E. 18th & Grand ... 65
Figure 23: Sidewalk Hidden by Building ... 65
Figure 24: Leaf Litter Covers Sidewalk E. 13th & Arthur ... 66
Figure 25: Missing Sidewalk (E. 19th St) ... 67
Figure 26: Sidewalk in Disrepair ... 67
Figure 27: Sidewalks Validated as Missing ... 68
Figure 28: Ranking of Missing Sidewalks ... 69
Figure 29: Comparison of this reports findings (left), versus the City of Des Moines Missing Sidewalks (right) ... 73
vi
LIST OF TABLES
Table 1: Population Growth in the Des Moines Metropolitan Area, 2010-2016 10
Table 2: Des Moines MPO VMT Per Capita, 2008-2015 12
Table 3: Annual Ridership on DART, 2012-2016 (Millions) 12
Table 4: Global Moran's I Results 46
Table 5: Descriptive Statistics of Socio-Economic Variables for Des Moines 52 Table 6: Descriptive Statistics of Socio-Economic Variables for Study Area 52 Table 7: Descriptive Statistics for Block Groups in Study Area 56
Table 8. Global Moran's I Results 59
vii
EXECUTIVE SUMMARY
The goal of this study is to identify places where there are gaps in the sidewalk network of eight Des Moines neighborhoods, which if addressed, would enhance connectivity of the sidewalk network. The study is done on behalf of the Des Moines Area Regional Transit (DART) service and focuses especially on how sidewalk connectivity can be enhanced for the riders of the DART bus service. A well-connected sidewalk network helps pedestrians to safely reach their desired bus stop, and sidewalk connectivity has been identified by DART as being a factor in improving the bus riding experience for their patrons.
The eight neighborhoods selected for this study are older, primarily residential neighborhoods to the north and east of downtown Des Moines. The neighborhoods are Cheatom Park, Capitol East, Capitol Park, King-Irving, Martin Luther King, Jr. Park, Mondamin-Presidential, River Bend, and Union Park. These neighborhoods have been identified in previous research as being more disadvantaged areas. These neighborhoods also have more bus stops and routes running through them, and a population that is more likely to be reliant upon public transportation.
To understand how to best enhance connectivity in the sidewalk network, determining the location of missing sidewalks first had to be identified: Identifying Missing Sidewalks. Missing sidewalks were located through the analysis of aerial photography obtained from Polk County in 2017 and involved the use of the geoprocessing tools available within ArcGIS. Three models were developed, to be run sequentially, in order to find missing sidewalk locations. Once the location of missing sidewalks was determined, a framework that would prioritize these missing sidewalks, in a manner which most enhances social justice, was created.
viii
areas of need. Areas of need are defined as block groups that a high percentage of Poverty, a high percentage of Non-White and a low percentage of graduate degree attainment. Areas of need were used to prioritize missing sidewalks.
To create the prioritization list of missing sidewalks, Automation was used. A Python script was created that automatically scores missing sidewalks from these data, creating a ranking of highest need for installation of sidewalks to the lowest need. This step also considered spatial distance from bus stops and bus shelters in the analysis of missing sidewalks. Using the walkable distance of a quarter mile, missing sidewalks within this distance were given a higher priority. As conditions change in the future, this script can be re-run and missing sidewalks can be updated.
The results of the study were then validated by comparing the resulting feature class to open source imagery and photos. Once that was completed, the results showed the greatest need for missing sidewalks occurred in two neighborhoods: Capitol East and King-Irving. Capitol East lies directly east of the state Capitol building and is an older working-class neighborhood. King-Irving lies just to the east of Drake. Both of these neighborhoods have diverse populations, with a high level of poverty and a low level of educational attainment. Both neighborhoods lie along bus routes and contain numerous bus stops within their boundaries. When looking at the percentage of missing sidewalks within each neighborhood, Capitol East is missing 19.8% of its sidewalk network, while King-Irving comes in the lowest out of the study area at 6.4%. It is recommended that the priority for sidewalk improvement be focused in the Capitol East neighborhood.
1
1. INTRODUCTION
Cities throughout the world are investing in public transportation to promote sustainability (Wright & Fulton, 2005). Current auto-centric transportation in cites is not sustainable and is leading to an increase in greenhouse gas emissions, which fuel climate change (EPA, 2017). Within the United States, 27% of greenhouse gas emissions come from burning fossil fuels for transportation (EPA, 2017). Cities that have invested the most into well-connected public transportation systems have the lowest per capita contributions to climate change and are leading the way in mitigating its effects (Dodman, 2009). Planning professionals have looked towards public transportation as one way to support the goal of sustainability.
Part of shifting to a more sustainable development pattern is also related to the promotion of social justice. According to a United Nation's definition, "Social justice may be broadly understood as the fair and compassionate distribution of the fruits of economic growth..." (United Nations, 2006, p. 7). As described by Barret (2001) planners have an important role to play in promoting social justice: planners “have an obligation to expand choices and opportunities for all, not just those who complain” (Barret, 2001, p. 30). Planning and advocating for public transportation can help to increase access to employment and educational opportunities among all people with limited mobility. Investment in public transportation provides people, especially those with low-incomes, with the ability to get to work, access education, and meet their daily needs (Glaser, Kahn, & Rappaport, 2008). To achieve a public transportation system that efficiently serves all people, the built environment around the bus stops must be walkable, since according to a 2016 survey, two-thirds of Americans who take public transportation arrive at their transit stop or station by walking (APTA, 2017).
2
of that built environment. DART has identified the connectivity of the sidewalk network within its service area important to pedestrian access at bus stops (TMD, Inc., 2016). This professional report was undertaken with DART as the client. DART expressed interest in understanding the connectivity of sidewalks near their bus stops.1 Having better pedestrian access has been
identified within DART's long-range planning document as providing their customers with a better transit experience (TMD, Inc., 2016).
Within this context, the main goal of this professional report is to spatially analyze the sidewalk connectivity within a subsection of the DART service area. The results of my spatial analysis provided DART with the current condition of their sidewalk connectivity for the first time. This report provided a framework for planners to assess priorities for the installation or repair of sidewalks to support enhanced connectivity. In this professional report, I defined priority missing sidewalks as falling within areas of need. These areas of need were characterized by high percentage of poverty, high percentage of non-White, and a low percentage of Graduate degrees. The prioritization of missing sidewalks additionally looked at two spatial criteria: distance from bus stops and distance from bus shelter. These spatial criteria made the study more applicable to DART. My methodological approach also provides a methodology for DART to conduct future studies of their entire service area. This study also assists the City of Des Moines, and other cities in the metropolitan area, by providing a methodology for detecting missing sidewalks and a script that can be used to prioritize those sidewalks. Written in the Python language, the script is easily adaptable to other variables that municipalities may be of interest in adding to their prioritization criteria for missing sidewalks. Finally, the study also serves as a model for planners working throughout North America that wish to examine sidewalk connectivity around bus stops in their communities.
3
Achieving the goal of this study required the integration of a wide range of socio-economic variables and spatial data derived from a variety of sources. The software ArcMap was used to determine location of the missing sidewalks and develop the models for identifying missing sidewalks. The software GeoDa was used to identify trends in the socio-economic data to determine the areas that had the greatest need for connectivity. Finally, the programming language, Python, was used to write a script that prioritized missing sidewalks, based upon socio-economic variables and distance from bus stops. The intent of this study was to use data, software and methods widely available to planners, so that the results can be replicated by any planner wishing to improve sidewalk connectivity in their community.
4
2. STUDY AREA
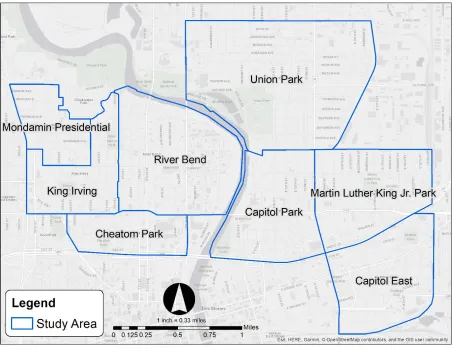
The study area was composed of eight neighborhoods within the City of Des Moines. These neighborhoods are north of downtown Des Moines, located on both sides of the Des Moines River. They include, going from west to east: Mondamin Presidential, King Irving, Cheatom Park, River Bend, Union Park, Capitol Park, Martin Luther King, Jr. Park, and Capitol East. Based upon previous research conducted for the neighborhoods’ plans, these areas were anticipated to have higher levels of poverty, lower educational attainment, and a greater share of Non-White population. Additionally, the selected study area had seven bus routes that provide service, as well as 131 bus stops. These neighborhoods are largely residential in character and constitute some of the earliest “suburbs” of Des Moines. They have some neighborhood oriented
commercial districts, as well as cultural and educational institutions. A significant industrial area is in the River Bend Neighborhood between 2nd Avenue and the Des Moines River and due east
of Union Park. The study area selected here, is representative of historic residential areas within Des Moines, and is similar in character to residential areas in other Midwestern cities. This made the study area a good place to develop and test a methodology for increasing sidewalk connectivity.
5
Figure 1: Study Area
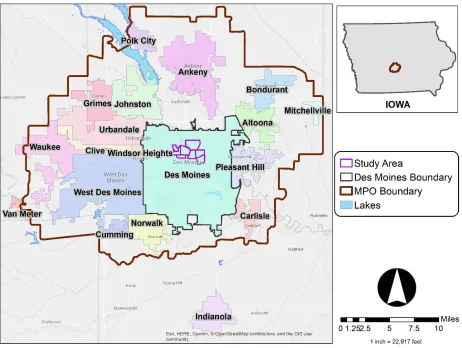
The context for this study was in central Iowa, where the DART service area is located. The Des Moines Area Metropolitan Planning Organization (MPO) serves as the transportation policy-making organization for the metropolitan area. An MPO is a regional body, required by federal law, whose purpose is to create cooperation within regions for transportation projects. The Des Moines Area MPO is composed of 16 local city governments2, three county governments
(Polk, Dallas, and Warren) and DART, as voting members. Non-voting associate members include three cities (Cumming, Indianola, Van Meter) and one county (Madison). Finally, there are five advisory members, the Des Moines International Airport, the Federal Highway Administration,
6
the Federal Transit Administration, the Iowa Department of Transportation, and the Heart of Iowa Regional Transit Agency (Des Moines Area MPO, 2018). The Des Moines MPO is integral in the coordination of inter-jurisdictional plan and projects in central Iowa. In planning its service area, DART utilizes the Des Moines Area Metropolitan Planning Organization (MPO) boundary (TMD, Inc., 2011).
7
Figure 2: Des Moines within the MPO Boundary, 2016
8
Table 1: Population Growth in the Des Moines Metropolitan Area, 2010-2016
* Percent Change in 2010 calculated from 2009 data (Source: American Community Survey, 5-year estimates)
Transportation within the Des Moines metropolitan remains primarily automobile based (DSM MPO, 2014). The amount of personal automobile travel is measured by the Vehicle Miles Traveled (VMT), which is calculated by taking the total number of miles traveled by all vehicles within the year for the region. When presented on a per capita basis, VMT can identify how much auto traffic is occurring. Despite the region still being heavily auto-dependent, VMT has fallen by 8.1% since 2008 (Table 2). Peak VMT occurred within the Des Moines metro area in 2004 and is projected to continue a downward trend into the future (DSM MPO, 2016).
Table 2: Des Moines MPO VMT Per Capita, 2008-2015
(Source: Des Moines MPO VMT Report, 2016)
Year Population Percent
Change
2010 552,889 1.7*
2011 562,406 1.7
2012 571,592 1.6
2013 580,913 1.6
2014 590,741 1.7
2015 601,187 1.8
2016 611,755 1.8
Year VMT per capita Percent Change
2008 105,000 n/a
2009 102,412 -2.5
2010 104,814 2.3
2011 101,069 -3.6
2012 102,736 1.6
2013 98,093 -4.5
2014 95,917 -2.2
2015 96,527 0.6
9
[image:18.612.151.459.310.517.2]With falling VMT and the identification within regional plans for greater usage of other modes of transportation, public transportation plays an increasing role in connecting people to employment, recreation and educational opportunities. Within the Des Moines region, DART provided public transportation, through a public bus service and on-call shuttles. Within the Des Moines Metropolitan Area, 4.70 million rides were taken in 2016, a slight decrease since reaching a peak of 4.79 million in 2015 (Table 3). This has been partially attributed to the rise of ridesharing apps (Descant, 2017), but can also be partially due to changes in bus routes, which has increased the frequency of buses within areas of higher ridership and reduced service in areas further out (TMD, Inc., 2016).
Table 3: Annual Ridership on DART, 2012-2016 (Millions)
Source: (National Transit Database, 2018)
DART has found, through internal surveys conducted in 2011, that most people ride their buses, because they need to get to their place of employment. Employers have noted in these surveys that they have difficulty retaining workers, due to the metro area's mismatch between housing and places of employment (TMD, Inc., 2011). This suggests that DART needs to find ways of connecting workers to their jobs, to better serve their riders. Part of ensuring that people have access to bus service is ensuring connectivity in the sidewalk network around the bus stops.
Fiscal Year Annual Passenger Miles Unlinked Passenger Trips Percentage Change of Passenger Trips
FY 2012 32.9 4.57 n/a
FY 2013 33.9 4.44 -2.8
FY 2014 33.1 4.70 +5.7
FY 2015 33.4 4.79 +1.9
10
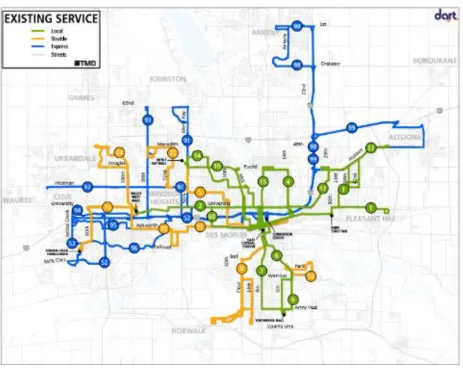
[image:19.612.80.543.256.624.2]DART's bus routes are currently concentrated within the most urbanized parts of the metropolitan area (Figure 3). 15 routes focus on the city of Des Moines and the immediate suburbs as local routes. There is one additional local route that connects to major employment centers: Valley West Mall and Jordan Creek Town Center. Seven express routes operate to provide transportation to and from farther out suburbs into the downtown. Bus routes are important in connecting workers to employment opportunities, both downtown and in the suburbs.
Figure 3: DART Bus Routes, 2011
11
2.2 PLANNING AND CONNECTIVITY IN THE STUDY AREA
Falling VMT, rising population, the need to access employment, and the issues surrounding climate change have been identified as factors within central Iowa that influence the need for greater investment in public transportation. These factors have been identified in regional plans and within plans for the city of Des Moines. The Tomorrow Plan is central Iowa's long-range planning document and its first goal is to: "Allow for sustainable alternatives that offer flexibility and that enhance mixed uses, walkability/accessibility, and sense of place through zoning, land use planning, and development” (DSM MPO, 2013, p. 14). Not only does the Tomorrow Plan discuss accessibility in terms of transportation options, the plan also identifies the need to reduce greenhouse gas emissions in order to mitigate the effects of climate change, noting that, "Choosing [...] alternative modes that generate fewer greenhouse gas emissions helps mitigate climate change and helps improve the health of the planet and residents (p. 151)." In support of the goals of the Tomorrow Plan, the Des Moines Area Metropolitan Planning Organization (MPO) created a regional transportation plan, Mobilizing Tomorrow. The primary goal of this plan is to "enhance multimodal transportation options” (2014, p. 4), which supports "a greater mix of transportation choices, including a robust transit network, an active carpool culture, and land use and design that support walkability" (DSM MPO, 2014, p. 8).
There have been many methods proposed on how to measure walkability (Talen, 2003; Sandalak, et al., 2013; Lee & Talen, 2014). One popular method is the Walk Score, available freely online (walkscore.com). Walk Score is a company that provides an online tool to evaluate the walkability of a city or neighborhood (Walk Score, 2011).3 Although the Walk Score methodology
12
does not take into account sidewalks in its analysis, other studies have used sidewalks as a measure of walkability. A review of 25 studies on pedestrian indices built to assess walkability, 15 measures sidewalks in some fashion, and eight identified sidewalk availability or connectivity as a factor in walkability (Maghelal & Capp, 2011).
In 2016, the City of Des Moines launched a $500,000 walkability study of its downtown core to identify projects that would increase sidewalk connectivity and remove barriers to cyclists and pedestrians (Meinch, 2015). This effort is a part of two related plans the city is working on. The first is its 20-year plan, PlanDSM, which focuses on land use and a change to form-based zoning codes (DSM Community Development , 2016). The other is MoveDSM, the city's first transportation plan. MoveDSM looks to create a more diversified transportation system in Des Moines, by promoting public transit and walkability within the city (DSM Community Development, 2018). As of the writing of this report, the MoveDSM plan is still being completed and has not been released yet. Preliminary public engagement documents have been released however, and these documents contain sections focused on missing sidewalks (Development, 2018). MoveDSM presents a prioritization scheme of missing sidewalks based upon four criteria: distance from bus stops, distance from an elementary school, distance from a commercial node, and a connectivity value (the formula for which is not revealed in the public documents). Although all of these items are a good way to prioritize missing sidewalks, they miss a critical aspect in ignoring the social justice aspect involved in determining which areas need sidewalks the most. This professional report takes socio-economic variables into account, and hopefully these data can inform DART and other regional governments when it comes to the prioritization of missing sidewalks. Applying the concept of pedestrian accessibility to DART will allow them to create a better experience for their passengers, who will be able to more easily access bus stops.
13
3. LITERATURE REVIEW
In this literature review I focus on sustainability and public transportation, planning for social justice, and empirical studies on the links between walkability, public transportation, and planning for social justice. Within sustainability, I examine the effects of automobile dependency on climate change, and the positive impacts that public transportation can have on offsetting the effects of climate change. Planning for Social Justice looks at the link between the low-income population and the necessity of public transportation for these groups. Empirical studies focus on previous research that examined walkability, public bus systems, and low-income population, as well as techniques used to assess these conditions.
3.1 Sustainability and Public Transportation
Sustainability has been defined as “[…] development that meets the needs of the present
without compromising the ability of future generations to meet their own needs” (Brundtland Commission, 1987, p. 31). Planners have the ability to influence sustainability in the plans that they create. Planning for impact urban form and transit planning are two the ways that planners can influence sustainability within a city.
Sprawl is a major contributor to climate change, by spreading housing, employment and retail across a broad geographic area, and then requiring an automobile to connect between them (Ewing & Hamidi, 2015). An example of the influence of urban form on levels of greenhouse gas emissions can be drawn by comparing Atlanta and Barcelona. Both cities have similar levels of per capita wealth. Atlanta is a very sprawling city, while Barcelona is compact. Atlanta produces six times as much transportation-related greenhouse gases as Barcelona (Rode, et al., 2014). This matters to planners because metropolitan areas continue to sprawl. A concerted effort by planners to plan for compact cities with public transportation and improved walking or biking infrastructure could lower greenhouse gas emissions by 20 to 50 per cent (IPCC, 2014).
14
reduce the total Vehicle Miles Traveled and residents of compact developments are more likely to walk, bicycle or take public transit, as opposed to driving automobiles (Nelson, 2017). Greater access to public transit and a walkable community make people less likely to use a car as their primary mode of transportation (Buehler & Hamre, 2015).
Public transportation has been identified as more sustainable than private automobile ownership in numerous studies (Rode, et al., 2014). Use of automobiles within cities is the largest single contributor to greenhouse gas emissions. The same research study has found that greenhouse gas emissions are much lower per capita when people use a well-connected public transportation system. Public transportation is usually more accessible within dense urban environments, and having land uses spatially closer makes public transit more efficient in time and energy usage. Additionally, dense areas typically have better pedestrian and bicycling infrastructure that encourage the use of non-motorized modes (Buehler & Hamre, 2015).
In summary, sprawling metropolitan areas are not sustainable as they create a much greater carbon footprint due to increased automobile usage. Planners can work to shift patterns of development by promoting connectivity of pedestrian infrastructure and public transportation. Focusing on these areas will increase sustainability and also equity
3.2 Planning for Social Justice
The link between equity and sustainable development is not a new one.4 The "aspiration
for a better life" for all people identifies that within the concept of sustainability there is a need for social equity. Cities that want to be sustainable are looking for ways of enhancing social justice for all of their residents. Enhancing the quality of public transportation is a very tangible way of increasing opportunities for access to education, social services, and employment.
4 The original Brundtland Commission, convened in 1987 at the behest of the Secretary General of the United Nations
in order to study sustainability, reported that: “Poverty is not only an evil in itself, but sustainable development
requires meeting the basic needs of all and extending to all the opportunity to fulfill their aspirations for a better
15
Non-rural poverty in America is also more concentrated in cities, where 19% of people are poor, as opposed to suburbs, where 7.5% of the population is poor. One of the main factors contributing to the poor living in cities is access to public transportation, which in turn gives them access to education, employment and government services (Glaser, Kahn, & Rappaport, 2008). Central Iowa follows a similar pattern. Poverty in Des Moines is concentrated around the central business district, specifically on the east side, with smaller pockets on the northern side of the city within the neighborhoods of Drake and Riverbend (Peters, 2011).
Not only are low-income individuals more likely to use public transportation, they are more likely to rely on it as a primary means of transportation, as the costs of owning, operating and maintaining an automobile are often prohibitively expensive (Glaser, Kahn, & Rappaport, 2008). Low income individuals are also more likely to walk as necessary transportation (Cerin, Leslie, & Owen, 2009). Having a well-connected sidewalk network is important for people that must walk to their daily needs, but in a low-density metropolitan area like Des Moines, being able to walk to public transportation, being able to get to the bus stop, is equally as important.
To enhance social justice, planners should work to increase access to public transit within low-income areas (Fainstein, 2010). Within the Des Moines area there is mismatch between housing and jobs, as previously noted, which causes low-income individuals to spend more resources on transportation (TMD, Inc., 2011). One of the goals noted within the DART Forward 2035 Plan and the Tomorrow Plan is to increase access to jobs in Central Iowa (DSM MPO, 2013; TMD, Inc., 2011). Investments in public transportation and walkability would significantly work toward the goals of these plans and enhance social justice in central Iowa.
16
3.3 Empirical Studies
Other Midwestern cities have conducted walkability studies in support of pedestrian master plans that consider the sidewalk network within their cities. The Walkability Plan for Kansas City identifies incomplete sidewalk networks as being a barrier to pedestrian activities. The plan notes that gaps in sidewalks and discontinuous sidewalks affect a person’s decision whether to walk or not. Kansas City, being a large city, in terms of land area, identified that there was considerable un-evenness in the distribution of sidewalks, with downtown having the greatest connectivity, while outlying areas of the city, especially to the north, had low connectivity (Lea Associates, Inc., 2003).
Minneapolis is another regional city that has a specific pedestrian plan. Minneapolis completed its Pedestrian Master Plan in 2009 and identified completion of the sidewalk network as its number one goal in promoting pedestrian activity. In studies conducted in support of the plan, it was found that most of the city had a completed sidewalk network (93%), but that some barriers still existed due to rivers and industrial areas (City of Minneapolis Public Works Department, 2009). Minneapolis also identified walking as being a critical part of access to public transportation, and that the built environment around transit stops should be created to enhance the ability for people to easily access it on foot. This was tied to the idea of equity, noting that walking is the "only mode of transportation universally affordable to everyone (p. 17)."
17
observation and developed a quality model of bad, medium or good sidewalks. From these data they were then able to calculate the state of repair for each the sidewalks around each bus stop.
To create the connectivity index, Woldeamanuel and Kent, first created a potential connectivity index, which would be the theoretical extent of the sidewalk infrastructure, were it to be build out on both sides of all roadways. They then compared these two data points, the actual connectivity versus the potential connectivity to determine a connectivity index for each of the bus stops. To control for socio-economic characteristics around the bus stops, they used census tract data for all tracts that fell within the buffered walkshed. They found that connectivity is more important than the quality of the sidewalk on the impact of ridership at a given bus stop (Woldeamanuel & Kent, 2015).
These studies show that a well-connected sidewalk network can increase ridership at bus stops and enhance the access that people have to public transportation. Previous sidewalk studies have involved researchers conducting on-ground visual inspections of the sidewalk infrastructure (Frackelton, et al., 2013; Galanis & Eliou, 2011), but these have focused on city centers and more small-scale areas.
Manually digitizing sidewalk data and combining that data with existing sidewalk data is a time-consuming activity (Kang, Scully, Stewart, Hurvitz, & Moudon, 2015). Rather than manually digitizing, aerial imagery can be used to identify sidewalk features and automatically digitize them into usable data. Imagery from satellites or airplanes is more commonly used to study things such as deforestation and urban sprawl (Weng, 2011), but has also been used to determine more fine-grained features, such as sidewalks or parking spaces with urban environments (Mattyus, Wang, Fidler, & Urtasun, 2016). What is not covered in the literature is a practical way that local planners can put these methods into practice using the tools at their disposal.
18
19
4. METHODOLOGY
This section describes the methodology used to conduct the sidewalk connectivity study for DART. The first part of this section covers the data used to conduct the study and an overview of the computer software used analyze the data. Next follows a discussion of the methods used, covering the steps of Identifying Missing Sidewalks, Exploratory Spatial Data Analysis, Automation, and Validation. Each of these steps was covered in greater detail and will allow for a researcher or planner to recreate the process described in this report.
4.1 Data
To determine where missing sidewalks occurred in the study area and identify the priority for providing those missing sidewalks required the use of many different sources of data. To determine the locations of missing sidewalks, a raster file containing an aerial image of Polk County, Iowa was obtained from Polk County and the roadway centerline data was obtained through the Des Moines Regional GIS portal. The data used to identify areas of need, including ratio of income to poverty, percentage non-White and percentage with Graduate Degrees was obtained through the American Community Survey of 2016. Census Block Groups were the spatial unit utilized. Data on bus stops and shelter locations came from DART. Additional data used to visualize the study area, such as municipal boundaries and neighborhood boundaries within Des Moines, also came from the Des Moines Regional GIS portal. These data are discussed in greater detail during this section of the report.
20
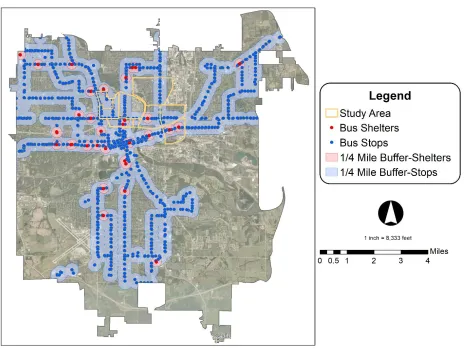
[image:29.612.77.542.152.501.2]within the literature as a measure of how far people are willing to walk to access transit (Woldeamanuel & Kent, 2015).
21
Figure 5: Street Centerlines, 2017
22
Figure 6: Aerial Imagery, 2017
23
purpose of this study. The aerial imagery is stored in three bands, which represent different wavelengths of light. These bands correspond to the wavelengths of Red, Green, and Blue visible light. The composite of these bands, the aerial image, thus shows up as a true-color image, much how one would expect if viewing the ground with the naked eye.
Data that illustrate the socio-economic conditions within the study area identifies areas of need. Data from the American Community Survey (ACS) were used to quantify Socio-Economic Status within the study area, using the variables of 125% of the poverty rate, percentage non-White, and percentage with Graduate Degrees. These three variables will identify the block groups that are areas of need. The census block groups are the area of analysis due to block groups being the smallest geographic unit at which income levels are tracked by the Census Bureau. Block groups are combinations of the census' blocks, which are created by local partners and the Census Bureau and trusted to represent distinct neighborhoods or areas of a community (Peters, 2011, p. 16).
When discussing poverty within the context of the United States, it is important to define what is meant by poverty and how it is statistically defined. The United States Census Bureau defines poverty by defining an income threshold for household by size of the household. Any family that falls below the threshold set by the Census Bureau has all members of the family considered to be in poverty (U.S. Census Bureau, 2017). However, people who are above the Census Bureau’s official poverty level may still be in need of assistance in meeting their daily
24
The variable "Percentage Non-White" is used to identify areas of the city that have high minority populations. Based upon a survey conducted in 2016, ridership on public transit is taken disproportionately by minorities. For example, African Americans are approximately 13% of the population of the United States, yet they account for 24% of ridership on public transportation (APTA, 2017). For this study, the variable “Percentage Non-White” was calculated by taking the total population of the block groups and subtracting the “White, Non-Hispanic” from the total, based upon data from the American Community Survey, 2016.
The variable "Percentage with Graduate Degrees" is used to assess the education level within block groups. The survey mentioned previously, found that 51% of people who take public transportation have a bachelor’s degree or some graduate schooling, whereas less than 8% of people who take public transportation in the United States have only a High School Degree or less (APTA, 2017). For this study, persons with a Graduate Degree (Master’s or PhD) or a professional degree (Medical Degree or Law Degree) were combined, based upon data from the American Community Survey, 2016. Identifying areas with the highest number of people with graduate degrees helps to determine the areas of less need.
25
4.2 Descriptive Statistics
Looking at the descriptive statistic of the variables for the block groups within the city of Des Moines presented findings that shed light on the ESDA results described later in this section. This section will examine the three socio-economic variables across the city of Des Moines, with emphasis placed on the descriptive statistics within the study area. This section underscores the findings of the ESDA and gives a background though which to interpret later findings. The statistics in this section are derived from the block group level. However, it is difficult to discuss data at the block group level without reference to an aggregate scale. Since Des Moines divides itself into neighborhoods, and these neighborhoods are part of the colloquial vocabulary when talking about the city, thus these neighborhoods are used in this section as a reference point when discussing the socio-economic variables. Where any block group overlapped more than one neighborhood, the block groups was considered to belong to the neighborhood in which a majority of the block groups fell. A map of the neighborhoods of Des Moines can be found in Appendix F.
When looking at the Percentage of Graduate Degrees or higher held in Des Moines, the minimum found is zero. This is true for 30 block groups, out of the 186 within the city. The greatest percentage found was 34.1%, found in the Westwood and Linden Heights neighborhoods, traditionally the tonier part of the city. The mean citywide is 7.1%, which is below the average for all of Iowa at 8.7% (US Census Bureau, 2016). Percentage of Graduate Degree holders had the lowest standard deviation (0.075) demonstrating that block groups tend to be closer to the mean with a tighter distribution.
26
The next highest block group is the one that contains the Oak Ridge Apartment complex. Locate just east of Sherman Hill, this complex is home to a large refugee population. The mean for Near Poverty is 24%. On average a block group will have almost of quarter of its population near or below the poverty level. The standard deviation for poverty, however, is the highest of any variable looked at in this study. This implies that there is a degree of income segregation within the city of Des Moines.
With regards to the Percentage that is Non-White, like with the other variables, the lowest percentage was zero. The next lowest percentage (1.4%) is located between the Merle Hay Mall and Herbert Hoover High School on the northwestern corner of the city. The block group with the highest percentage (92.2%) is located in Mondamin Presidential, just south of Broadlawns Medical Center. The mean for the city is 28.9%, just under a third. The standard deviation (0.219) implies that there is slightly less ethnic and racial segregation between Whites and Non-Whites than income segregation, but much greater segregation then between those with and without graduate degrees.
Table 1: Descriptive Statistics of Socio-Economic Variables for Des Moines, 2016
Minimum Maximum Mean Standard
Deviation Percentage Graduate
Degrees 0 (0) 34.1 7.1 0.075
Percentage Poverty 0 (0.9) 72.2 24 0.240
Percentage
Non-White 0 (1.4) 92.2 28.9 0.219
27
percentage near poverty is also much lower (0.127 vs 0.24). The standard deviation for percentage Non-White however is greater than for the city (0.221 vs 0.219)
Table 2: Descriptive Statistics of Socio-Economic Variables for Study Area, 2016
Minimum Maximum Mean Standard
Deviation Percentage with
Graduate Degrees 0 7.1 2.8 0.022
Percentage Poverty 11 59.6 38.5 0.127
Percentage
Non-White 19.7 92.2 60.4 0.221
Moving from the descriptive statistics tables, the following choropleth maps visually illustrate the data that have already been discussed and show patterns in the data across the city.
28
Figure 7: Percentage Graduate Degrees by Block Group, 2016
29
Figure 8: Percentage Non-White by Block Group, 2016
30
31
The next section of this report will describe the design of the study and how the data presented in this section were integrated with the software to produce an understanding of where sidewalk connectivity was lacking within the study area. The next section will lay out how missing sidewalks were identified, how areas of need are defined and identified, and how missing sidewalks are prioritized based upon areas of need and their relation to bus stops.
4.3 Methodological Steps
This section covers the steps taken to determine where missing sidewalks occur within the study area, and to prioritize those missing sidewalks, so that connectivity in the pedestrian network can be enhanced. These steps include Identify Missing Sidewalks, conduct Exploratory Spatial Data Analysis, and conduct Automation and Validation (Figure 10).
Identifying the Missing Sidewalks involved segmenting and classifying the aerial imagery to differentiate land covers and creating models, which would process the raster and vector data into a layer that showed extant sidewalks. Roadway centerlines were then used to create a search area from the classified imagery, in which sidewalks could occur. The resultant search area was then processed to extract the land uses which correspond to sidewalks. The raster data of the sidewalk imagery was then converted to vector data. A line feature of the entire potential sidewalk network was created, and then the portions of the line feature that overlapped with the extant sidewalks was deleted, leaving a layer containing missing sidewalks.
32
block groups from these three variables revealed neighborhoods that had higher levels of need than other parts of the study area.
The step of Automation involved the creation of a Python script, which assigned a rank to the missing sidewalks based upon the block group’s socio-economic variables identified in the ESDA step, as well as the distance that a given missing sidewalk was from either a bus stop, or a bus shelter.
33
34
4.3.1Identifying the Missing Sidewalks
To identify the missing sidewalks, I used a high-resolution aerial photo, a line feature containing street centerlines, and the processing tools available in ArcMap 10.6, particularly the spatial analyst toolset. This step involves raster preprocessing, segmentation, classification, and creating models to generate missing sidewalk line features.
4.3.1.1 Raster Pre-Processing
A raster file is a file that contains rows and columns of pixels, which store data, much like a digital photograph. Since this study uses aerial photography, raster data is the first type of data to process. The initial raster file covered all of Polk County, IA, and contained a little over half a terabyte of data, which was too large to conduct any processing. The Extract by Mask tool was used to extract the section of the raster that fell within the borders of Des Moines. The output of the Extract by Mask was a smaller raster covering only the area of Des Moines. This raster was still too large for direct processing, so a “fishnet” was constructed using the Create Fishnet tool. A fishnet is a grid of line features that can be generated in ArcMap. The fishnet contained a grid measuring 5x5, which, when used to split the raster of Des Moines, created 36 smaller tiles, each consisting of about 2 gigabytes of data. These smaller tiles could then be further processed during the next step of segmentation.
4.3.1.2 Segmentation & Classification
35
There are three parameters within the segmentation tool that control the level of detail created by the segmentation: Spectral Detail, Spatial Detail, and Minimum Segment Size (ESRI, 2017). Spectral Detail determines how much weight is given to spectral differences between pixels on a scale of 1-20. More segments were created the closer to 20 that this parameter is set. In this study, I set the Spectral Detail to the highest setting, 20, in order to better differentiate areas of similar spectral characteristics as are often found in city environments. The Spatial Detail parameter scale also ranges 1 through 20. Selecting a higher value of this parameter results in the classification giving more weight to how close a given pixel is to another similar pixel. To gain the level of detail needed to differentiate the spectral characteristics of a city; this parameter was set to higher detail levels. The final parameter is the Minimum Segment Size in Pixels. This parameter is set to avoid having small pixels interrupting the desired segments. Once these variables are appropriately selected, the segmentation is run in ArcMap. The result is an image with reduced spectral details, which will improve the accuracy of the classification.
Figure 11: Example of Before and After Segmentation
36
thus saving time. However, this method proved unsatisfactory due to its inability to separate sidewalks from rooftops, and the tendency for other features to be merged into similar classes.
The supervised classification divides the imagery into different land use types, such as roofs, grass, trees, water bodies and concrete.5 Supervised classification requires that the
signature file (.ecd) be manually created. The signature filed is created through the Classification tool bar in ArcMap. Located in this tool bar is the Training Sample Manager. The training sample manager allows for the selection of sites, saved as a shapefile, in the raster, which was used to build the signature file. These training samples are selected in order to define the spectral properties of each desired land cover. Initially 7 different categories were selected Street, Sidewalk, Grass, Tree, Roofs, Bare Earth, and Water. Samples were taken in sections of the raster that best typified a given land cover. Training sites were selected for each of the rasters and for each of the land covers. 14 sidewalk samples were taken, 7 for street, 25 for grass, 18 for rooftops, 4 for bare earth, and 4 for water. If in the generated classified raster, an area was classified improperly, it was selected and input as a new training site in the appropriate category. This process was repeated a minimum of four times for each raster in order to produce a useable classified image.
37
Figure 12: Example of Classified Image
Once training sites were selected, it was time to create the signature file. This is accomplished by taking the shapefile generated by the Training Sample manager and inputting it along with the segmented image into the Train Support Vector Machine Classifier. The Support Vector Machine (SVM) is a new classifier that is good for handling large images and "is less susceptible noise, correlated bands, and an unbalanced number or size of training sites within each class” (ESRI, Inc., 2016). The output of this process is the signature file (.ecd) that is used to create the classified image. This file is then used an input for the raster classification, along with the segmented image. This produces a raster that then has pixels of only 7 different values, corresponding to the training samples.6
38
Once the training samples are created, it is then time to classify the image. There are many different classification algorithms available in ArcMap, but the Support Vector Machine was the preferred algorithm for this study, due to its ability to handle more detailed imagery compared to the other classifiers. Training samples were loaded into the Support Vector Machine classifier, which will generate the “.ecd” file that was used to conduct the classification. Once the ".ecd" file is created, the "Classify" tool was used, applying the ".ecd" filed to the segmented image from earlier (ESRI, 2017). The result of this was a fully classified image, showing the different land use categories.
4.3.1.3 Missing Sidewalk Centerlines
39
40
The first step of raster processing, after the segmentation and classification are complete, is to create the search area for sidewalks. If one were to process the entire image, then too many extraneous objects would be included as sidewalks. Since sidewalks generally occur along roadways, and all bus stops occur along roadways, then it makes sense to limit our search area for sidewalks to the areas along roadways. For the purposes of this research, the search area for sidewalks was determined to be between 40 feet and 16 feet of the roadway centerline. This was determined by using the measure tool in ArcMap to measure the distance from roadway centerline to the sidewalk on the area imagery. This step was repeated three times on the different road classes to determine an average distance. To then create the search area, two buffers were created from the roadway centerline, one for 16 feet and one for 40 feet. The 40-foot buffer is then erased by the 16-40-foot buffer, creating a polygon feature that excludes the roadway itself, but includes the area in which a sidewalk could be expected to exist.
This search area polygon feature is then applied to the classified aerial image. This is accomplished by using the Extract by Mask tool. The Extract by Mask tool allows for a portion of a raster, in this case the classified aerial image, to be extracted by a given mask, in this case the search area polygon. The result of this step is that the areas not within the search area have a “No Data” value, whereas raster values are retained within the area in which sidewalks could
exist. This reduces the amount of processing that needs to be done to identify sidewalk segments. The raster now consists of only those parts of the raster that are within 16 to 40 feet of the roadway centerline.
Now that the raster was pared down to the search area, the “Calculate Statistics” tool was run. Running “Calculate Statistics” allows for further processing of the raster. Once the statistics were calculated, the raster could be cleaned up by applying generalization to the image. Generalization is a process by which small areas of the raster that have been misclassified are cleaned up. The tool used for generalization in this model was the “Majority Filter.” Majority
Filter works by resampling the pixels around the misclassified areas to assign a new classification. The results were a smoother rater that eliminated some of the “messy” areas inherent in
41
These variables adjust the resampling method used in the classification, the “Eight” resamples eight nearest neighbors, and the “Majority” requires that a majority of these cells belong to a
category before reclassification can occur. After this step, the classified raster was now clearer to see, and sidewalks were more uniform and pronounced.
Once generalization has been applied to the classified imagery, the next step is to extract the parts of classified image that could be sidewalks. Within the classification, each classification type is assigned a value. If there are seven categories in the classification, then each will have a unique value (1-7). Of these values, most sidewalks generally were classified as either sidewalk, or street. To extract these areas from the classified raster the “CON” tool was used. The CON tool uses an if/else statement on a raster’s attributes, which allows for parts of the raster to be
extracted based upon their attributes. The “CON” tool has a Simple Query Language (SQL) block where the selection can be made. Before setting up the SQL code, the original raster should be checked to ensure the values assigned to the “sidewalk” or “street” classifications. For example, in one of the processes the raster’s value for sidewalks was “1” and the value for streets was “2”. The SQL code block is ["Value" <= 2]. Running the CON tool removes any part of the raster that was not either a sidewalk or a street, leaving only concrete surfaces. This completes the portion of the process that deals with raster processing. The next part will cover the processing of polygon features.
42
Now that the data were all polygons, it was possible to remove the small features that were too small to be actual sidewalk segments. This was accomplished by using the select by attributes tool to select small features. In the SQL block of the tool, I used the formula ["Shape_Area <= 62], selecting all features with an area under 62. Once these small features are selected, they can be erased from the original polygon layer, leaving only the larger polygons. I then assessed an iteration of the “Multipart to Single Part” to ensure that all non-contiguous features would be assigned unique feature identifiers.
Since the small features that were not sidewalks had now been cleaned up, it was time to begin to tackle some of the larger features. Driveways proved to be one of the trickier features to remove from the picture. To process out the driveways, a negative buffer was used. A negative buffer is simply a buffer that uses a negative value. Instead of growing the object outwards, as is normally seen with a buffer, the negative buffer instead erased the feature inward. In effect this allowed driveways to be identified and then removed. Measurements of driveways were taken throughout the study area. The average driveway was found to be 6 feet wide. To remove the driveways and negative buffer with a value of -2.8 feet was applied. This negative buffer removes all sidewalks and leaves only a small sliver of polygon in the middle of the driveways. These slivers are then re-buffer out by 2.8 feet. This creates a polygon feature that has the extent of the driveways, without the sidewalk segments. The driveway layer was then erased from the original feature, leaving only the sidewalk segments. This step worked best in residential areas and worked less well in industrial areas. If this step is applied to an industrial area or a downtown area, it is best to omit this step.
Once the driveways had been removed, it was necessary to once again clean up the sidewalk layer. Due to the way that the polygons have been processed, many of the sidewalks have irregular shapes. To clean this up, I ran a negative buffer of -1.45. This will eliminate any features that are too skinny to be a sidewalk, while preserving the actual sidewalks. I then re-buffered by 1.45 to create a smoother polygon feature.
43
selection of polygons with a shape area less than or equal to 62 and erased those features from the original polygon layer. I then repeated the process of selection and erasure, but modify the parameter to remove those shape lengths less than 45. Polygons that had a length of less than 45 were determined not to be sidewalks when compared to the aerial imagery.
Since Des Moines had planimetrics of many features, I elected to erase these from the polygon feature in order to further clean up the original layer. Planimetric were used to erase the model include parking lots, building footprints, and driveways. It was not necessary to use planimetrics, but since they were available, I felt it would be best to use them.
After examining the resulting layer, I identified that there were still some very large and very small features that were not sidewalks. Very large features are generally found in industrial areas, where the ground cannot be distinguished from roadway or sidewalks due things such as loading docks, warehouses and processing areas. Very small polygons are left over "slivers" from previous steps where features were erased from one another. For this selection, I used the parameters of [Shape_Area<=32 OR Shape_Area>=6936], which was determined through visual inspection of the previous outputs. I then erased this selection from previous polygon feature. The resultant layer is a polygon that contains features that best represent the location of sidewalks. This layer is used in the next step to create a line feature that identifies where sidewalks are missing.
The next model took the layer from the previous step and used it to create a line feature that represents where sidewalks are missing. The first step for this model was to clip the roadway centerline feature, which contained all roadway centerlines in the State of Iowa, down to the study area. This was accomplished by using the “Raster Domain” tool to create a polygon based
upon the raster being processed. The street centerline feature was then clipped to the processing area.
Once the roadway centerlines had been clipped to the study area, the roadway centerlines could then be used to determine a “potential” sidewalk network. What is meant by
44
determine where sidewalks could exist, but are currently missing. To accomplish this the roadway centerline shapefile was used. The roadway centerline shapefile’s attribute table contained a column, “StreetClas”, which identified which type of roadway the line feature was. The categories were Interstate, Local, Minor Arterial, Private, Ramp, Alley, Arterial, Collector, and State Highway. The categories of Interstate, Ramp and Alley were not processed, as these roadway types would not be expected to have sidewalks. The remaining street categories were symbolized against the aerial imagery, and three measurements were taken for each Street Class of the distance from the centerline to the sidewalk. These measurements were then averaged to determine the average distance of the sidewalk from the street centerline for each street class.
Next a selection was made in the model for five street classes: Arterial, Minor Arterial, Collector, U.S. and State Highways (which grouped together), and Local. These classes were then buffered by the average distance of the sidewalk from the roadway centerline, creating a polygon feature whose outer edge represented the centerline of the potential sidewalk network. These polygons were then merged to create one polygon. Once merged, the “Polygon to Line” tool was applied to turn the polygon feature into a line feature. I then elected to erase this line feature by the planimetric of the roadways, which eliminated the lines that cross streets. I did this to simplify the model and reduce processing time. If no planimetric had existed, then the same process described above for determining sidewalk distance from the roadway centerline, could be used to determine the average distance from the roadway centerline to the edge of the roadway. At the end of this step, I was left with a line feature that represented the potential sidewalk network for the entire study area.
45
The next issue to overcome was the issue of (what I referred to as) “perpendicularity”. Since I wanted to use the “Near” function to identify which line sidewalk features did not intersect with the polygon sidewalk features found earlier, I had to determine a way to keep sidewalk line features from being within a search distance on the perpendicular. I only wanted those line features which were parallel to a polygon sidewalk feature, otherwise the “Near” function would identify that sidewalk as being within the search radius, when in reality the sidewalk was still missing. To overcome this issue, the model applied the “Feature Vertices to Points” tool, which turns every vertex into a point. Then I applied a buffer of 10.1 feet and erased this buffer from the potential sidewalk line feature. This removes the sidewalks from being within the 10 foot search area used in the next step. This process allowed me to solve the issue of perpendicular intersections. To compensate for the missing distance, a 20-foot allowance was added back into distance measures of the missing sidewalks later.
With the potential sidewalk network properly calibrated, the missing sidewalks could then be found. This step worked by comparing the potential sidewalk line feature against the polygon sidewalk feature that was determined from the classified imagery. It used the “Near”
tool to search for extant sidewalks (the polygon feature) that are near the potential sidewalk (line feature) with a search radius of 10 feet. If the potential sidewalk fell outside of 10 feet from the final search area, then the “Near” tool writes a -1 into the “Near_Dis” column of the attribute table of the line feature. This identifies the potential sidewalks that are not near an existing sidewalk. The resultant layer shows all sidewalks that can be considered missing.
46
winter, the occluding branches and shadows caused by trees could often not be identified during the classification process, without also including other features. When a sidewalk was missing, but not detected by the model, it was due to another feature being identified as a sidewalk during the extraction process when it is something else. Loading docks, parking lots, and buildings very close to the roadway were the culprits of this oftentimes. A more detailed discussion of these issues can be found in the validation section.
4.4 Exploratory Spatial Data Analysis
Exploratory Spatial Data Analysis (ESDA) is a group of techniques, described by Anselin (1995) to identify patterns in spatial distributions of variables. Within this report, ESDA was used to identify areas of need within Des Moines that would benefit more from having sidewalks installed. Areas of Need are defined as block groups that meet the three criteria outlined above. They are block groups that have a low percentage of persons holding graduate degrees, a high percentage of Non-White persons and a high percentage of person below the near poverty level. This was accomplished by determining the global trend, whether there was clustering or not, and then drilling down to the block groups level to determine where clusters exist.
47
manipulation of the variable k. For example, if k is assigned the value of 6, then the weighting matrix will assume that all block groups have 6 neighbors for weighting purposes (Macedo & Haddad, 2016).
Once the Spatial Weight Matrices were constructed, the next step was to determine if there is global spatial autocorrelation, which investigated if there was clustering between the geographic unit and the socio-economic variables. This was done by calculating the Global Moran’s I statistic for both spatial weight matrices. The Moran's I statistic measures how similar or dissimilar one area is to another. A Moran's I score of -1 would mean that the data is completely heterogeneous, while a score of +1 would mean that it is perfectly clustered (Guillain, Le Gallo, & Boiteux-Orain, 2006). Looking at the Moran's I statistic of the study area, I was able to determine whether poverty is occurring in a clustering pattern.
48
Understanding where these areas of need occur helped to create a framework for understanding where sidewalk improvements for connectivity could be the most useful for DART to focus on.
4.5 Automation
Automation involves creating a process that can be repeated over and over with minimal human involvement. Computer programs are a common example of automation. Computers use many layers of different programs to conduct several tasks, from the most complicated to very simple functions, such as to move a cursor across the screen. Within ArcGIS, Python is the preferred programming language to work with because it is free and open source. Moreover, Python is supported within the user interface of GIS, consequently being able to access and use all of the built-in tools that are native to ArcGIS (Zandbergen, 2015). Automation in this project was used to identify the missing sidewalks that should be prioritized by DART.
49
The first step in writing the script was to set up the script to run in the current working directory, define variables that were to be used by the script and set up the relative paths so that the script could be used on other machines.
The next step was to spatial join the attributes used to determine the areas of need in the LISA to the missing sidewalk shapefile. A spatial join is a function which transferred a spatial attribute, such as the location of an object, into the attribute table of the object. The spatial join in this step transferred the attributes from block groups within areas of need (percentage Poverty and Non-White that were High-High, percentage Graduate Degree that were Low-Low) to the missing sidewalk features. These three different variables were selected, and then three separate spatial joins were conducted to transfer the LISA data to the attribute table of the missing sidewalk shapefile. These data were stored in a column of the attribute table labeled “LISA_CL”. The missing sidewalks now have the variables for the areas of need stored within its attribute table.
Once the areas of need attributes were joined to the missing sidewalk layer, the next line in the script calculated a field code that replaced any Null values with 0. Arithmetic operation cannot be carried out on a Null value, so it was important to change Nulls to zeros to avoid errors in calculation. Once this was complete a new field (Rank) was added to the Missing Sidewalk attribute table to store the score of the areas of need. This field was added so that the values of the areas of need could be calculated into a score to be combined into a total rank for areas of need later.