Fall 2018
An On-Chip Sensor for High-Throughput Profiling of Antimicrobial
An On-Chip Sensor for High-Throughput Profiling of Antimicrobial
Resistance
Resistance
Zhihao Liao
Iowa State University, [email protected]
Follow this and additional works at: https://lib.dr.iastate.edu/creativecomponents
Part of the Engineering Commons
Recommended Citation Recommended Citation
Liao, Zhihao, "An On-Chip Sensor for High-Throughput Profiling of Antimicrobial Resistance" (2018). Creative Components. 80.
https://lib.dr.iastate.edu/creativecomponents/80
by
Zhihao Liao
A report submitted to the graduate faculty
in partial fulfillment of the requirements for the degree of
MASTER OF SCIENCE [CREATIVE COMPONENT]
Major: Electrical Engineering
Program of Study Committee: Meng Lu, Major Professor
The student author, whose presentation of the scholarship herein was approved by the program of study committee, is solely responsible for the content of this dissertation. The
Graduate College will ensure this dissertation is globally accessible and will not permit alterations after a degree is conferred.
Iowa State University
Ames, Iowa
2018
TABLE OF CONTENTS
Page
LIST OF FIGURES ... iv
LIST OF TABLES ... v
NOMENCLATURE ... vi
ACKNOWLEDGMENTS ... vii
ABSTRACT ... viii
CHAPTER 1. INTRODUCTION ... 1
CHAPTER 2. THREE TYPES OF ON-CHIP MICROFLUDIC PCR SYSTEMS ... 3
2.1 Electric-heating Based Static Chambers PCR System ... 3
Design and the fabrication flow of the proposed sensor chip ... 3
Photomask Design ... 4
Setup ... 5
10 Cycles ... 5
2.2 Electric-heating based continuous flow PCR system ... 7
Photomask Design ... 7
3D Continuous Flow PCR System ... 8
2.3 Laser-heating Based Static Chambers PCR System ... 10
Setup ... 10
Plasmonic Absorber/Thermocouple Calibration ... 11
CHAPTER 3. DNA MICROARRY ANALYSIS ... 13
Determination of Antimicrobial Resistance of Genes by DNA Microarray ... 13
DNA Preparation ... 13
DNA Hybridization ... 13
CHAPTER 4. RELATED WORK ... 14
4.1 Evaporation in Gasket Chambers ... 14
Setup ... 14
Experiment ... 14
4.2 Heating Characterization for Whatman™ Paper ... 15
Whatman™ Paper Painted by Graphene or Graphite (Pencil) ... 15
Heating and Evaporation ... 16
4.3 SOP for Spin Coater ... 16
Standard Operating Procedure for Spin Coater ... 16
LIST OF FIGURES
Page
Figure 1 Schematic of the proposed lab-on-a-chip device built upon a microscope glass slide with four PCR reactors, a label-free DNA
microarray, microfluidic channels, and microvalves ... 3
Figure 2 Photomask for chamber and heater ... 4
Figure 3 Whole system of static chambers PCR. ... 5
Figure 4 Microfluidic device of static chambers PCR. ... 5
Figure 5 10 cycles temperature rotation. ... 6
Figure 6 Photomask for chamber and heater ... 7
Figure 7 Schematic of 3D continue flow PCR systems ... 8
Figure 8 Temperature simulation for flow-through thermocycler. ... 8
Figure 9 Flow-through thermocycler holder ... 9
Figure 10 Flow-through thermocycler ... 9
Figure 11 Schematic of laser-heating based static chambers PCR system. ... 10
Figure 12 Whole system of laser-heating based static chambers PCR ... 10
Figure 13 Temperature Vs. Arduino Output ... 12
Figure 14 Gasket chamber on PET substrate, w/wo PET cover ... 14
LIST OF TABLES
Page
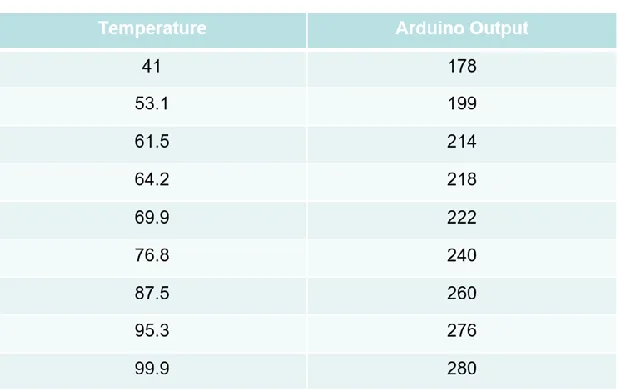
Table 1 Temperature vs. Arduino output. ... 11
Table 2 Evaporation in gasket chamber ... 15
Table 3 Heating time comparison with different materials (graphite and
NOMENCLATURE
AMR Antimicrobial Resistance
PCR Polymerase Chain Reaction
PDMS Polydimethylsiloxane
CDC Centers for Disease Control
ACKNOWLEDGMENTS
I would like to thank my major professor, Dr. Meng Lu, for his guidance and
support throughout the course of this research.
In addition, I would also like to thank my friends, colleagues, the department
faculty and staff for making my time at Iowa State University a wonderful experience. I
want to also offer my appreciation to those who were willing to participate in my surveys
and observations, without whom, this thesis would not have been possible.
ABSTRACT
Rapid and accurate determination of antimicrobial resistance (AMR) of pathogenic
bacteria is a national priority owing to its vital importance to public health. We designed
this project to develop an on-chip sensor system that is capable of characterizing bacterial
drug susceptibility rapidly and inexpensively. First, in order to find an efficient polymerase
chain reaction (PCR) method to detect the AMR genes, three different types on-chip
microfluidic PCR systems were devised and fabricated by utilizing electric-heating,
laser-heating based static chambers PCR system, and continuous flow PCR system. Second, we
integrated DNA microarray and PCR on one chip to measure the expression level of a large
number of AMR genes. The integration of PCR and DNA microarray on chip was
fabricated by microfluidics technique. Electric-heating based static chambers PCR system
consisted of a polydimethylsiloxane (PDMS) reaction chamber, a micro heater a cooler, a
thermocouple, and a thermal controller. Electric-heating based continuous flow PCR
system consisted of a thermocycler holder, three polyimide heaters, and 20 cycles Teflon
tube. Laser-heating based static chambers PCR system consisted of a plasmonic
absorber/thermocouple, a 3W laser, a solenoid shutter, a gasket chamber, and an Arduino
controller. Each of PCR system was connected with microarray using microfluidic
CHAPTER 1. INTRODUCTION
The antimicrobial resistance (AMR) of pathogenic bacteria is a global health threat1.
The purpose of this project is to develop a AMR detection system that can be used for rapid
characterization of bacterial drug susceptibility profile and thus reduce the excessive usage of
antibiotics in healthcare. The Centers for Disease Control (CDC) estimates that antibiotic
resistant bacteria cause at least two million illnesses and 23,000 deaths annually in the US2, 3.
Due to the bacterial mobility in nature and their transformable cell membranes, it is very easy
for one resistance gene to transfer from one bacterium to another and many bacteria thus
acquire resistance toward multiple commonly used antibiotics4-6. Thus development of
point-of-need diagnostics that rapidly distinguish between bacterial and viral infections and
validation of diagnostics that rapidly determine the antibiotic-resistance profiles of bacteria of
public health concern.
Currently, conventional culture-based methods require isolation of pathogens from
clinical specimens, culture on media containing a range of concentrations of antibiotics, and
determination of the minimum inhibitory concentration of each antibiotic. In most cases, a
definitive result can be obtained more than 1-3 days when slow-growing pathogens need to be
tested7. However, some infections are fatal if the treatment does not take place within 24 hours
of the occurrence of the first symptoms8, 9, forcing a physician to prescribe a broad-spectrum
antibiotic. As a result, about 1/3 to 1/2 of all the antibiotics are unnecessary or incorrectly
prescribed due to the slow turnover of the conventional culture-based AMR assay2, 3. To
improve the conventional method, non-culture based methods have great potential to meet the
this method to rapidly and accurately determine of antimicrobial resistance (AMR) of
CHAPTER 2. THREE TYPES OF ON-CHIP MICROFLUDIC PCR SYSTEMS
In this two years, we devised and fabricated on-chip microfluidic PCR systems by
utilizing three different methods: electric-heating, laser-heating based static chambers PCR
system, and continuous flow PCR system7, 10, 11.
2.1 Electric-heating Based Static Chambers PCR System
[image:12.612.125.492.242.558.2]Design and the Fabrication Flow of the Proposed Sensor Chip
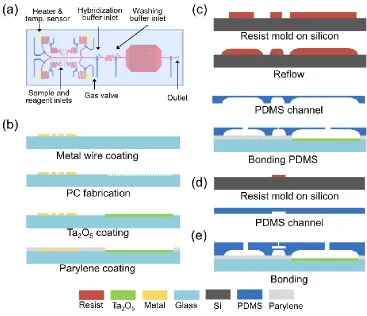
Figure 1. Schematic of the proposed lab-on-a-chip device built upon a microscope glass slide with four PCR reactors, a label-free DNA microarray, microfluidic channels, and microvalves.
Figure 1 (a). shows the top view of the chip with four sets of reactors. Each reactor will
be used for multiplex PCR amplification.
Figure 1 (b). shows the fabrication of the metal wire heater/temperature sensor and the
Figure 1 (c). and Figure 1 (d). are molding PDMS for microfluidic and gas valve control
layers.
Figure 1 (e). is the chamber and heater layer bonded by plasma cleaner.
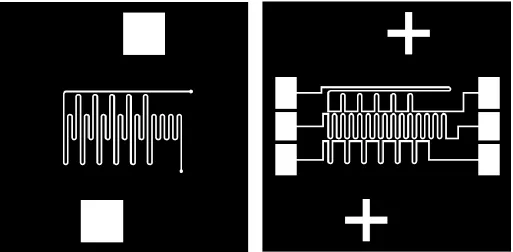
Photomask Design
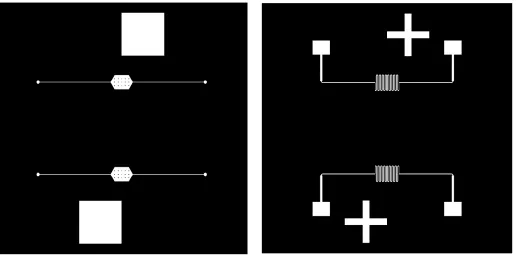
Figure 2 (a). Photomask for chamber Figure 2 (b). Photomask for heater
Figure 2 (a). and Figure 2 (b). are our photomasks design.
The photomasks’ size is: 20mm*20mm
Figure 2 (a). is the photomask for the chamber. Where:
Chamber: 4mm(L)*4mm(W)*60𝜇m(Depth) =0.96 𝜇L
Channel: 100𝜇m(W) *60 𝜇m(Depth)
Inlet & outlet: 1mm(Diameter)
Pillars in the chamber: 200𝜇m(Diameter)
[image:13.612.68.584.178.433.2]Setup
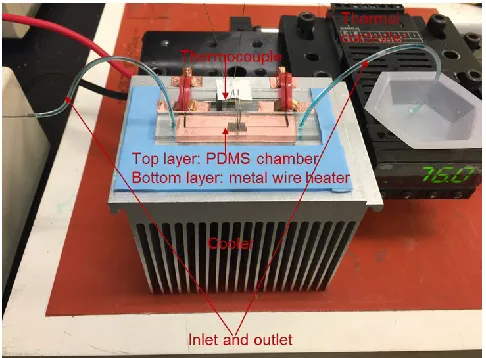
Figure 3. Whole system of static chambers PCR
Figure 3. shows the whole system. In this system, the thermocouple measured the
temperature and gave the feedback to OMEGA™ controller at any time. When the temperature
was lower than desired temperature, OMEGA™ controller turned the heater power on and
turned the cooler power off. Similarly, when the temperature was higher than desired
temperature, OMEGA™ controller turned the cooler power on and turned the heater power
[image:14.612.194.437.505.684.2]off.
Figure 4. shows the microfluidic device. The PDMS chamber bonded with the heater
by plasma cleaner. The electrodes connected with power, charged and heated the wire. The
thermocouple inserted into the chamber, and connected with OMEGA™ controller. A cooler
under the microfluidic device.
10 Cycles Test
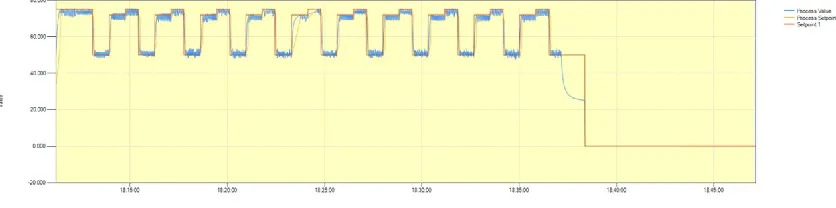
Figure 5 (a). 10 cycles temperature rotation
Figure 5 (b). 10 cycles temperature rotation
Figure 5(a). and Figure 5(b). show the 10 cycles temperature rotation. Each discrete
cycle: heating to 98°C for 10 seconds, cooling to 50 °C for 20 seconds and heating to 72°C for
[image:15.612.140.558.214.318.2] [image:15.612.133.540.370.512.2]In the figure, we can find out that temperature increases rapidly and achieves 98°C, but
the temperature rate of decreasing is slower than the rate of increasing. Also after the
temperature achieved our desired temperature, it was unstable.
2.2 Electric-heating Based Continuous Flow PCR System
Photomask Design
Figure 6 (a). Photomask for chamber Figure 6 (b). Photomask for heater
Figure 6(a). and Figure 6(b). are our photomasks design.
The photomasks’ size is: 20mm*20mm
Figure 6(a) is the photomask for the continue flow, including 6 Cycles. Where:
Channel: 100𝜇m(W) *60 𝜇m(Depth)
Inlet & outlet: 1mm(Diameter)
Figure 6(a). is the photomask for the heater, which has three different temperature
[image:16.612.67.580.233.485.2]3D Continuous Flow PCR System
Figure 7. Schematic of 3D continue flow PCR systems
Figure 7. is the design of 3D continue flow PCR systems. This system includes: a
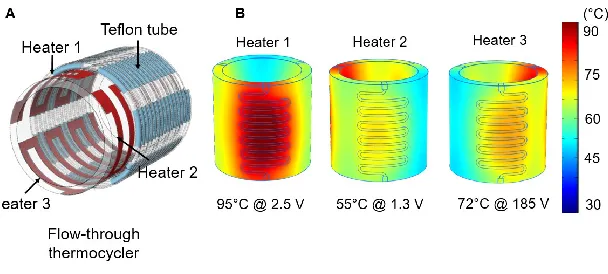
[image:17.612.140.444.410.547.2]flow-through thermocycler, 3 polyimide heaters, a hybridization chamber.
Figure 8. Temperature simulation for flow-through thermocycler
Figure 8. is the temperature simulation for flow-through thermocycler. The temperature
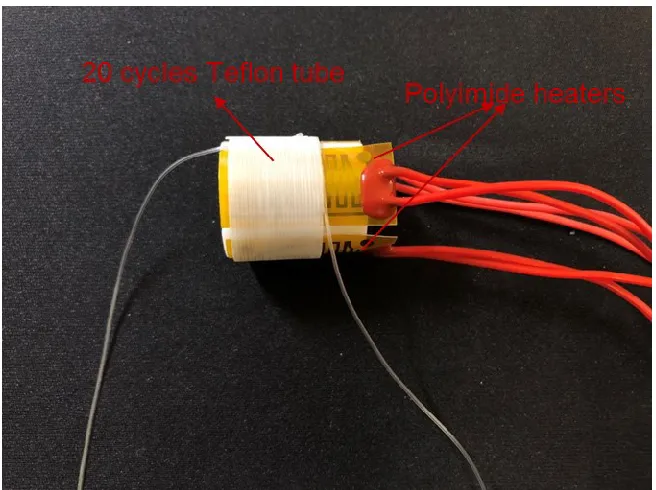
Figure 9. Flow-through thermocycler holder
Figure 9. is the different perspectives of the flow-through thermocycler holder.
In our design, the flow-through thermocycler holder made from DuPont™ Delrin®
(Polyoxymethylene, POM).
We designed 3 slots for the holder to reduce the interaction between different
temperature zones.
Each zone had different arc length. Since the sample in the tube had same flow rate,
[image:18.612.125.453.422.667.2]the different arc length determined the period in different temperature.
We stuck the three polyimide heaters on three zones, wrapped with 20 cycles Teflon
tube. Each heater set a constant temperature: 95°C, 50°C and 72°C. We controlled pump rate
to get desired period of each part of PCR.
2.3 Laser-heating Based Static Chambers PCR System
[image:19.612.171.496.236.438.2]Setup
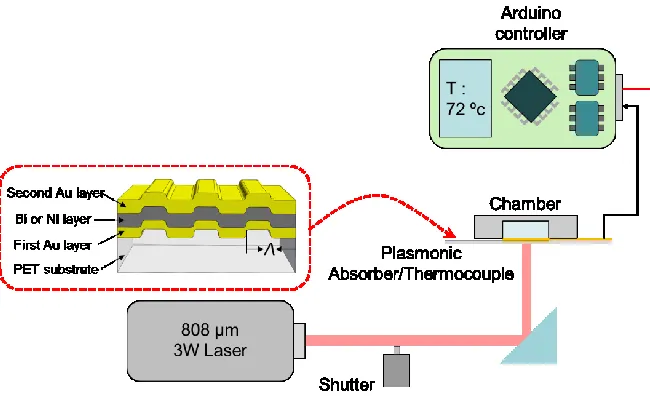
Figure 11. Schematic of laser-heating based static chambers PCR system
[image:19.612.169.504.489.678.2]The Figure 11. and Figure 12. show the whole system of laser-heating based static
chambers PCR.
We designed plasmonic absorber/thermocouple, which had three metal layers on PET
substrate. The first Au layer and Bi or Ni layer worked as a thermocouple, which converted
heat to current flow by Seebeck coefficient contrast. The second Au layer on the top with
plasmonic grating, which absorbed incident light and converted incident light to heat.
In this system, the thermocouple measured the temperature and gave the feedback to
Arduino controller at any time. When the temperature was higher than desired temperature,
Arduino controller sent a signal to solenoid shutter to block the laser source. Similarly, when
the temperature was lower than desired temperature, the Arduino controller sent a signal to
solenoid shutter to open the laser source.
[image:20.612.179.488.422.617.2]Plasmonic Absorber/Thermocouple Calibration
Table 1
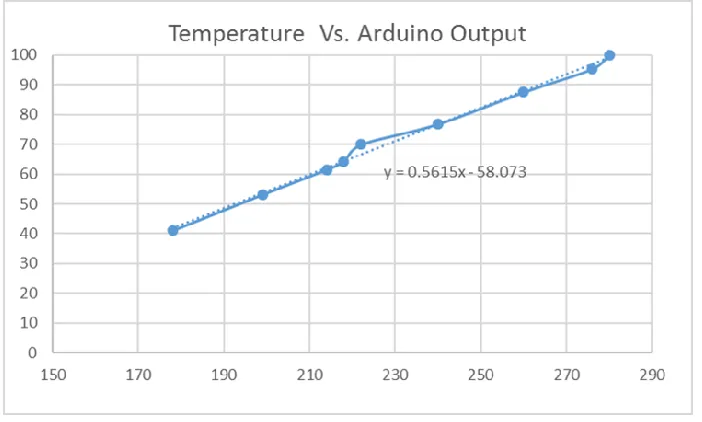
Figure 13. Temperature Vs. Arduino Output
Figure 13. shows the calibration of plasmonic absorber/thermocouple, temperature vs.
Arduino output was almost linear:
CHAPTER 3. DNA MICROARRY ANALYSIS
To do feasibility study of the antimicrobial resistance of pathogenic bacteria, we bought
Agilent G2534A Microarray Hybridization Chamber to detect the common resistance genes.
Determination of Antimicrobial Resistance of Genes by DNA Microarray
DNA Preparation
Extracted 12 genes from E.coli genome, amplified the DNA fragments covering the
Hybridization probes by the multiplex-PCR conditions. Purified the PCR products by
Zymo-DNA Clean & Concentrator™ Kit, and label the Zymo-DNA by the Label IT Cy5 Nucleic Acid
Labeling Kits.
DNA Hybridization
Added 0.1 volume of Denaturation Reagent D1 to the labeled sample. Mix well and
incubate for 5 minutes at room temperature. Added 0.1 volume of Neutralization Buffer N1.
Mix well and incubate on ice for 5 minutes. Concentrated the Cy3-labeled samples.
Pre-hybridized the required microarray slides for 45 minutes at the hybridization
temperature by a pre-hybridization buffer containing 5X SSC, 0.1% SDS, and 1% BSA.
Dipped slides in dH2O and quickly dried by compressed air.
Diluted the Cy3-labeled samples in the hybridization buffer: 30% formamide, 0.5%
SDS, 6xSSC, 5xDenhardt’s solution.
Applied the mixture to a hybridization chamber and incubated at 43°C for 16 h in an
oven.
Washed the slides sequentially in Solution A (1x SSC, 0.2%SDS) for 3 min, Solution
B (0.2x SSC) for 3 min, and solution C (95% alcohol) for 1.5 min. Dried the slides under a
CHAPTER 4. RELATED WORK
In addition to the above work, I also did the following related research to help my future
work for colleagues.
4.1 Evaporation in Gasket Chambers
[image:23.612.134.454.218.361.2]Setup
Figure 14. Gasket chamber on PET substrate, w/wo PET cover
I fabricated three devices:
1. Gasket chamber on PET substrate (Figure 14. Middle).
2. Gasket chamber on PET substrate, covered by other PET plate (Figure 14. Right).
3. Gasket chamber on PET substrate, covered by other PET plate with hole (Figure
14. Left).
Experiment
Stuck thermocouple under the PET substrate, put the device on hotplate. Adjusted the
hotplate temperature to 100°C.
Dropped 1 mL water in Gasket chamber to each device by pipette.
Recorded evaporation time and observed the bubble in the chamber.
Dropped 1 mL 20% glycerol in Gasket chamber to each device by pipette.
[image:24.612.127.515.166.333.2]Recorded evaporation time and observed the bubble in the chamber.
Table 2
In Figure Table 2, we concluded that covered with PET plate and glycerol adding had
the function of reducing evaporation and bubble.
4.2 Heating Characterization for Whatman™ Paper
Whatman™ Paper Painted by Graphene or Graphite (Pencil)
Figure 15. Whatman™ Paper Painted by Graphene or Graphite (Pencil)
[image:24.612.127.492.492.652.2]Stirred graphene and dropped on the chamber of Whatman™ Paper. Also, painted
graphite on Whatman™ Paper by pencil.
Figure 15. shows the Whatman™ Paper face and back after painting graphene and
graphite.
Heating and Evaporation
Heated the chamber after painting graphite and graphene by laser. Recorded the time
of the temperature to 100°C. Also tested the time for completing evaporation, whose chambers
[image:25.612.210.462.316.531.2]were covered by PET and tape.
Table 3
Table 3 shows the time comparison with different materials (graphite and graphene)
and different methods.
4.3 SOP for Spin Coater
Standard Operating Procedure for Spin Coater
I summarized and formulated the Standard Operating Procedure(SOP) for spin coater
SOP for Spin coater
Warming:Because of water and chemicals can get pulled into the vacuum line.
Wafers should NOT be wet or have sticky chemicals of any kind on the back side. Must NEVER spray solvents onto the chuck while it is on the tool.
When cleaning the bowl, a dummy wafer or glass should ALWAYS be clamped onto the chuck.
0. For easy cleaning after coating, covered all chamber and lid by foil paper.
1. Plug in pump power (right side of the hood).
2. Turn on the compress air switch (orange, right side of the hood).
3. Open the lid and place your substrate on the center of vacuum chuck.
Your substrate MUST COMPLETELYcover the “O-ring” (a black ring on the chuck).
If your sample smaller than samples 2”, use adapter chuck (around the spinner in a plastic bag) for small samples.
4. Set the required program.
Before editing a new program, please check “Commonly Used Program List”. You can pick up an existing program which same as your desired, or select an unassigned program to edit. Also, if you will often use a program, you can assign the program, and record the program’s name and data on “Commonly Used Program List”. After you don’t often use the program, please remove it from the list.
If editing an existing program, press “PROGRAM SELECT” key to select the
desired program.
If creating a new program, press “PROGRAM SELECT” key to select an
unassigned program.
1) Press the “F1” key. The “PGM” message will appear in the mode area of the
display to indicate that the unit is in “programming” mode.
2) Use “ADD STEP” & “DEL STEP” keys to select or remove the number of
steps necessary in the program. Up to 51 steps can be programmed.
3) Use “CURSOR ←(L) & →(R)” keys to position the cursor over the value to
be changed.
4) Use “VALUE ↑(UP) & ↓(DOWN)” keys to change set point values.
5) Use “STEP” key to advance to the next step. 6) Press “F1” key to return to “run” mode.
5. Turn the vacuum on by pressing “VACUUM” button on panel.
6. Dispense the solution on the substrate.
7. Close the lid and press “RUN/STOP” key.
8. Remove your sample and put dummy wafer or glass clamped onto the chuck.
9. Remove foil paper and wet a wipe with acetone clean all the chamber and lid.
CHAPTER 5. SUMMARY
In this project, we devised and fabricated on-chip microfluidic PCR systems by
utilizing three different methods: electric-heating, laser-heating based static chambers PCR
system, and continuous flow PCR system; Developed and assembled temperature
measurement and control systems for different methods of PCR systems by utilizing
thermocouple, thermo-controller, OMEGA™ controller and Arduino microcontroller;
Developed plasmonic heating and thermocouple for laser PCR systems; Detected antimicrobial
resistance genes using a label-free DNA microarray.
We encountered some issues in our previous research. The first problem is how to
reduce evaporation and bubbles in the samples. Also, how to keep the temperature constant in
temperature controlling phase is another problem.
Some related work is included: Evaporation in gasket chambers; heating
characterization of Whatman™ paper; formulating the standard operation procedure (SOP) for
spin coater in our lab. This related work will be used as a solid foundation for the future
REFERENCES
1. Roca, Ignasi, et al. "The global threat of antimicrobial resistance: science for intervention." New microbes and new infections 6 (2015): 22-29.
2. The White House. "National action plan for combating antibiotic-resistant bacteria." (2015).
3. The White House. "National strategy for combating antibiotic-resistant bacteria." (2014).
4. Jonathan G. Frye, et al. “Development of a DNA Microarray to Detect Antimicrobial Resistance Genes Identified in the National Center for Biotechnology Information Database.” Microb Drug Resist. (2010): 16(1): 9–19.
5. Card, Roderick, et al. "Evaluation of an expanded microarray for detecting antibiotic resistance genes in a broad range of gram-negative bacterial pathogens." Antimicrobial agents and chemotherapy 57.1 (2013): 458-465.
6. Perreten, Vincent, et al. "Microarray-based detection of 90 antibiotic resistance genes of gram-positive bacteria." Journal of clinical microbiology 43.5 (2005): 2291-2302.
7. Dorsch, Matthias R. "Rapid Detection of Bacterial Antibiotic Resistance: Preliminary Evaluation of PCR Assays Targeting Tetracycline Resistance Genes." Australian Government, Department of Defense (2007).
8. Gilligan P. H. “Therapeutic challenges posed by bacterial bioterrorism threats.” Curr Opin Microbiol. (2002): 5(5):489-95.
9. Franz, D. R., et al. “Clinical recognition and management of patients exposed to biological warfare agents.” The Journal of The American Medical Association (1997), 278: 399-411.
10. Böckelmann, Uta, et al. "Quantitative PCR monitoring of antibiotic resistance genes and bacterial pathogens in three European artificial groundwater recharge systems." Applied and environmental microbiology 75.1 (2009): 154-163.