Abstract— This paper aims to investigate the interest of Indonesian urban society towards consumer IoT applications, namely Home Security, Smart Appliance, Smart Energy, Wearable Device, Connected Cars, and Smart Health. Besides, this study also seeks to provide empirical insight into why they intend to adopt the applications. Data collection was carried out by Research Center for Post and Informatics, Ministry of Communication Technology of Republic of Indonesia in 2016 through a survey. This study applies descriptive statistic to describe the profile of respondents, and cross-tabulation to illustrate intention toward IoT applications based on their socio-economic background. We also utilize binary logistic regression as a tool to examine the influence of personal innovativeness, usefulness, ease of use, social influence, and price toward the intention to adopt IoT applications. The results show that overall, the interest to use IoT applications ranged from 54,7% to 64%. Among others, home security and smart health are the least and the most desirable applications, respectively. According to socioeconomic background, respondents of male, aged between 28-42 years, graduated from university, had jobs or owned a business, and had higher expenditures have a higher rate of intention on adopting IoT applications, with more than 60% each. Empirically, the study also confirms that only one out of five factors, i.e., usefulness, influences the plan of using the applications. The impact is positive on a significant level of 1%, except for home security and smart appliance on 1.5% and 5,7%, respectively. These findings could be used as a basis for constructing a strategy to attract and encourage people to adopt IoT applications.
Index Terms—Intention, Internet of Things, consumer IoT, usefulness
I. INTRODUCTION
HE Internet of Things (IoT) becomes a popular topic in recent years and sounds like a futuristic term, yet in fact, it is not completely a new concept. Kevin Ashton has coined and laid a groundwork for the term in early of 2000’s. The concept offered a way to connect all physical objects in the daily life and assign them with an identifier so that they could communicate with each other and be managed by using a computer [1].
The number of IoT devices is expected to keep growing in the future driven by increasing range of business models as well as use cases. The decline of IoT device cost also contributes to the growth. Ericsson has predicted the
Manuscript received on July 1, 2017. This work was supported by Research and Development Center for Post and Informatics, MCIT, Republic of Indonesia.
Kasmad Ariansyah is a researcher in Research and Development Center for Post and Informatics, Ministry of Communication and Information Technology (MCIT), Republic of Indonesia. Phone/fax: +622134833640; e-mail: [email protected].
presence of approximately 29 billion of connected devices globally by 2022, where almost 18 billion of them are IoT devices. Ericsson has also estimated that connected devices will be dominated by short range IoT, with 87 percent of the total of IoT devices. The rest, around 2.1 billion (13 percent) are long-range IoT [2]. IHS predicted even higher, with 30.7 billion installed-base IoT in 2020 and continue to grow to 70.5 billion in 2025 [3]. In January 2017, Gartner has released its newest prediction related to the number of installed base IoT units. Gartner estimated that the number would be about 20.4 billion units by 2020. Of the total, about 63% will come from Consumer IoT [4]. Concerning economic impact, McKinsey has estimated that global economic impact of IoT will be around USD 3.9 trillion to USD 11.1 trillion a year by 2025 [5]. A.T. Kearney has also predicted that by 2020, 6 percent of the Global economy will be supported by IoT [6]. The other economic impact prediction has been made by Business Insider (BI). BI estimated by 2019, IoT will contribute $1.7 trillion in value added to the global economy [7]. To realize the benefit of IoT, all involved parties have to play their respective roles well and to face all emerging challenges. The challenges are not only related to technical aspects and how to create a conducive environment for IoT application providers (supply side), but also how to create demand and encourage people to adopt IoT application (demand side). As a result, understanding customer’s intention and acceptance is a critical research agenda. Many efforts have been devoted to investigate and understand the factors influencing the intention to adopt Internet of Things in several countries with various IoT applications [8]–[12]
.
Some of them apply Technology Acceptance Model (TAM), Innovation Diffusion Theory (IDT), Value-based acceptance model (VAM) to understand and describe the behavioral of respondents’ intention related to IoT applications and applications. Even though the focus of the studies is relatively the same, yet the findings of the studies could be different. One of the causes is subjectivity of respondents that could be influenced by several external factors, such as environment, economic condition, geographical condition, experience, and so on. The majority of previous studies have investigated determinants of the intention to adopt certain technology among existing users and non-user. However, several studies have also examined it for non-users [12], [14]–[18] to estimate the adoption of a technology in the future.This study aims to investigate the intention of Indonesian urban society to adopt several IoT applications and to confirm what factors affecting it. The definition of urban in
The Intention to Adopt Internet of Things
Applications: A Case of Indonesian Urban
Society
Kasmad Ariansyah
this study refers to the Regulation of Head of Central Bureau of Statistics (Badan Pusat Statistik) No. 37/2010 regarding the Classification of Urban and Rural in Indonesia [13].
The rest of paper is outlined as follows: Literature review is described in Section II, continued by Research Methods in Section III. Results and discussion are presented in Section IV, while Section V contains the conclusion of the study.
II. LITERATURE REVIEW
A. Internet of Things (IoT)
Today the presence of Internet has touched almost every populated places of the globe. However, it is not the end of Internet development, since now we are entering a new era of more pervasive connectivity which envisages a broad range of the physical object to connect to the Internet. This era called “Internet of Things” era. International Telecommunication Union (ITU) has defined the term of Internet of Things (IoT) as a global infrastructure for the information society, enabling advanced applications by interconnecting (physical and virtual) things based on existing and evolving interoperable information and communication technologies [19]. The term of IoT sometimes is replaced by other terms, such as machine to machine communication (M2M), pervasive computing, sensor networks, ubiquitous computing, etc. [8]. Fundamentally, IoT encompasses all connected devices, including smartphones, tablets, and computers. However, most of the discussions of IoT focus on the opportunity to connect existing machines that previously were not connected and expand the connected points in environments [3]. IoT can be applied in wide range of industries such as transportation, manufacturing, retail, logistics and supply chain management, the pharmaceutical industry, medical and healthcare, automotive, aerospace and aviation, agriculture and breeding, media and entertainment, and insurance [20]. Typically, the architecture of IoT consists of four layers, namely device layer, network layer, service layer, and application layer [21]. Device layer consists of sensors and actuators that support various communication standards. The network layer provides connectivity among IoT devices, gateways and the core. Several network technologies are currently utilized, such as Zigbee, Wireless Local Area Network, Bluetooth, Cellular technology (2G/3G/4G), Ethernet, SigFox, LoRa, etc. Service layer provides IoT application abstractions that can be used by multiple applications. The application layer is the closest layer to the end user. It can support a wide variety of applications, such as tracking, smart metering, the smart appliance, entertainment, logistic, healthcare, etc.
According to Banafa [22], IoT can be classified into three groups, i.e., consumer IoT, commercial IoT, and industrial IoT. Smart cars, watches, phones, laptops, connected appliances, and entertainment system are considered as consumer IoT, whereas inventory control, device trackers, and connected medical devices are deemed as commercial IoT. Connected electric meters, wastewater systems, flow gauges, pipeline monitors, manufacturing robots, and other types of connected industrial devices and systems are examples of Industrial IoT.
B. Model and determinants of behavioral intention
Previous works have developed and proposed theoretical models to facilitate the understanding of the behavioral intention and acceptance against new technology. Several well-known approaches, such as Technology Acceptance Model (TAM), Innovation and Diffusion Theory (IDT), Unified Theory of Acceptance and Use of Technology (UTAUT), and Value-based acceptance model (VAM) have been utilized to investigate the factors affecting the acceptance of Information and Communication Technology (ICT) technology. Those approaches have been applied in the field of e-commerce [23], [24], mobile communication technology [25], [26], internet or mobile banking [27], [28], e-payment [29], [30], and IoT applications[9], [11], [12], [31]. Table 1 presents the use of models specifically for IoT applications.
III. RESEARCH METHOD
A. Data
This paper uses survey data gathered by Research Center for Posts and Informatics, Ministry of Communication and Information Technology, Republic of Indonesia. Data collection was carried out in 2016 through a survey. The number of respondents is 550.
B. Survey location
The survey was carried out in 10 urban areas, i.e., Jakarta, Surabaya, Yogyakarta, Palembang, Pontianak, Semarang, Sorong, Belitung, Manado, Banjarmasin, and Denpasar. These locations were considered as representative of the west, middle, and east areas of Indonesia. Respondents were selected by non-probability sampling method, which means only those who meet the prescribed conditions have an
TABLE 1.PREVIOUS RELATED WORKS
Author Model Variables used IoT
application Location
Gao& Bai (2013)
Extended TAM
Technology
(Perceived usefulness, perceived ease of use, and trust), Social influence,
Electronic toll collection
China
Kim et.al (2017)
VAM, TAM, UTAUT & ELM
Privacy risk, Innovation resistance, Technicality, Perceived fee, Facilitating condition, Perceived usefulness, enjoyment, perceived value, Variety seeking, Attitude, Intention to use
Smart Home
South Korea
Patil (2016)
Extended TAM
usefulness, Ease of Use, trust, attitude towards IoT adoption, perceived behavior control and subjective norm and behavioral intention
IoT for retail stores
Pune city
Hsu& Lin (2016)
VAM Enjoyment, Sacrifice (Technicality & Perceived Fee), Perceived Value, Adoption Intention
IoT applicatio ns
opportunity to belong to the samples. A person has been using the internet, either through fixed or mobile network, has a chance to be a respondent. This consideration was taken because the basis of IoT is the internet [32]. Internet users are expected to have a better understanding of the questions posed.
C. Research instrument
A questionnaire is used as a tool to gather primary data. The questionnaire includes questions concerning respondents’ socioeconomic background, respondents’ intention to use IoT applications and respondent’s opinion related to factors that likely could affect the intention. Socioeconomic background is comprised of gender, age, education, occupation, marital status, and the amount of
spending per month. The question investigating the intention of adopting IoT consists of two stages. In the first stage, all respondents have to answer whether they intend to adopt IoT applications or not. The question in this stage is regardless the time when they plan to use them. Each IoT application is equipped by a description of what the application is and examples of each. IoT applications in this study include smart appliance, smart energy meter, wearable device, connected car, smart health, and home security. Descriptions of each application are presented in Table 2. Those applications refer to the survey question of GSMA [33], with one additional IoT application, i.e., home security. This part of the questionnaire has only two options each, “0” for indicating has no intention yet, and “1” to show an intention of adopting IoT. This first stage question will be used as dependent variable. To obtain deeper information, all respondents who answer “1” have to respond to the second stage question. The difference between the first and the second stage is the inclusion of the time of adoption, i.e., within five years.
The last part of the questionnaire is the questions concerning independent variables which are likely to affect respondents’ intention. This study does not utilize specific acceptance or behavioral intention models. Independent variables are comprised of personal innovativeness, usefulness, ease of use, social influence, and cost/price. Operational definition of each independent variable is presented in Table 3. The answer in this part is 5-scale of Likert ranging from 1 (strongly disagree) and 5 (strongly agree). We use single-item measures for each independent variable. Even though most of the works use multiple-item measures, yet it is not unusual to use single-item ones. Bergkvist and Rossiter in their study confirmed that they did not find the difference of validity between multiple-item and single-item measures[34]. Although that finding is criticized by Kamakura [35], Bergkvist through his other paper has reconfirmed that his first result was appropriate and remain unchanged [36]. Rossiter has also concluded that in many cases single-item measures can substitute multiple-item measures, in particular for the concrete construct [37]. Even though Rossiter asserted that semantic-differential is the only scale appropriate for single-item measures due to lack of neutral point, Alexandrov has opposed the argument and stated that Likert scales are also usable in single-item measures [38].
D. Data analysis
This study is quantitative in nature. Statistic descriptive is utilized to present the intention to adopt IoT applications and group them based on the socio-economic background. The data is presented in the cross-tabulation. The interest rates were compared within each group of socio-economic variables. We also utilize binary logistic regression technique as a tool to confirm the factors which are likely to affect the intention of IoT adoption. Logistic regression is used when the type of dependent variable is categorical with one or more continuous or categorical independent variables [39]. Contrary to Ordinary Least Square (OLS), also known as linear regression, logistic regression does not require a linear relationship between independent and dependent variables as well as a normal distribution of variables [40].
TABLE 2.DESCRIPTION OF IOT APPLICATIONS
IoT Application Definitoon
Home Security Home security system connected to the internet to ease remote monitoring and configuration, for example, door and window sensors, surveillance camera, and motion detector
Smart Appliance
Household appliances, such as washing machines, refrigerators, etc. that can be monitored and controlled remotely through the internet network
Smart Energy Meter
A system aims to measure, monitor and control of electricity usage to improve efficient use of energy
Wearable Device
Human body accessories such as bracelets, watches, glasses etc. connected to the internet for various purposes
Connected Cars A car equipped with internet connectivity to enable valuable applications such as navigation, real-time of local traffic information, entertainment, and vehicle diagnostic
Smart Health Personal health monitoring devices connected to the internet to ease doctors in monitoring and treating their patients from any place
TABLE 3.OPERATIONAL DEFINITION OF INDEPENDENT VARIABLES
Variables Operational definitions Model/Theories /Research Personal
Innovativeness
Desire to be the first in adopting an IoT application compared to others
Boyle&Ruppel (2006) Jin (2015)
Usefulness Degree of improvement perceived by user after adopting an IoT application
TAM
Kim et.al. (2017) Patil(2016)
Ease of Use Degree of difficulty or ease of use of an IoT application
TAM
Gao& Bai (2013)
Patil (2016)
Social influence
The perception of whether other people perceived we should adopt an IoT application
UTAUT
Gao& Bai (2013)
Cost/price Degree of user’s perception regarding cost of adopting an IoT application
Abrahao et.al. (2016)
Binary logistic regression is a type of logistic regression with dichotomous or binary dependent variable. The logistic regression model the probabilities associated with the value of dependent variable Y, in this study it is the intention to adopt IoT applications. The concept underlies logistic regression is logit, that is the natural logarithm of an odds ratio. Equation (1) shows a logistic model with two independent variables, while the probability is expressed as equation (2).
1 1 2 1
logit( ) ln ...
1 n n
Y
π
α β
β
β
π
= = + Χ + Χ + + Χ
−
(1)
1 1 2 2
1 1 2 2
(
...
)
(
...
)
1
n n
n n
e
e
α β
β
β
α β
β
β
π
+ Χ + Χ + + Χ
+ Χ + Χ + + Χ
=
+
(2)where
Y
is the dependent variable,π
is the probability of the outcome of interest, i.e., the intention to adopt IoT applications.α
is the intercept of regression. β1 to βn are thecoefficients or slopes of regression. X1 to Xn are predictors
or independent variables as presented in Table 3. e=2.71827
is the base of natural logarithms.
IV. RESULT AND DISCUSSION
A. Demographic profile of respondents
As mentioned in the previous section, the number of respondents and considered as complete is 550. Of the total responses, 49.1 percent of respondents are belonged to the male, while the remaining is female. Regarding age, the majority of respondents are from below 28 years age group with 62.7 percent. It is followed by age group of 28-42 years, 43-52 years, and above 53 years with a response rate of 30.4 percent, 5.5 percent, and 1.5 percent, respectively.
In terms of education, it is classified into two categories, i.e., below university and university. According to collected responses, most of the respondents come from university level of education, with 68.4 percent. The rest, 31.6 percent, have educational background of below university.
Based on the occupational classification, the largest number of respondents is employees, with 49.15 percent. All people work for other people, in private company, in a state as well as in a local government owned company, and in public agency are considered as employees. The Student comes in second place, with 36.5 percent, and followed by entrepreneur, other/not classified, self-employed, and jobless with less than 5 percent each.
The highest response regarding average spending per month comes from respondents with total expenditure between IDR 1 to 5 million (58.5 percent) and followed by them with spending less than 1 million (35.6 percent). The least response (1.1%) comes from respondents with spending more than IDR 10 million per month. We do not include respondents’ income with a consideration that this study tries to capture consumption level, by observing the respondents’ spending, and its relation to the intention to adopt IoT applications.
B. The intention to adopt IoT applications based on socioeconomic background
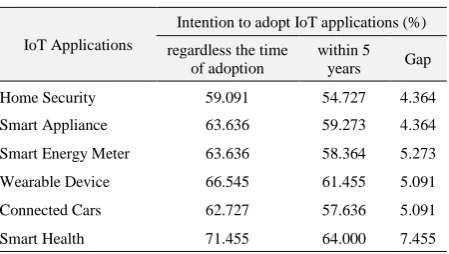
Table A.1 in the appendix illustrates the relationship between the intention to adopt IoT applications and socioeconomic background. The table presents percentages of respondents showing their intention to adopt IoT applications. According to the table, the percentages of the male having plan to adopt IoT are higher than those of the female. The most different percentages between the two are for connected car and home security application, with about 10 percent of differences. Concerning of age, the highest rate of intention comes from them with age between 28 and 42 years, while people aged 43-57 years the interest against IoT relatively low (only 50% for connected car and less for other IoT applications). Respondents graduated from a university have a higher rate of intention for all applications, except for smart health, compared to them whose a lower level of education. Related to occupation, they without occupation relatively have lower rates for all IoT applications compared to people who have a job or own a business. Based on marital status, married respondents relatively have higher rates of intention to adopt IoT applications, except for smart health and home security. In term of total spending per month, the highest percentage of responses intend to adopt IoT comes from respondents with spending more than ten million per month. From the Table A.1, we also know that overall, the percentages of the intention to adopt those IoT applications are more than 50 percent. Table 4 compares rates of intention to adopt IoT between two stages of the question. Data of “regardless the time of adoption” column is percentages of respondents’ answer of first stage question, while the next column presents response rates of second stage question. The results of the two are slightly different. The highest difference between the two is for smart health application, with 7.455 percent. Those gaps mean the percentage of the respondents who intend to utilize IoT application beyond five years.
TABLE 4.PERCENTAGE OF RESPONDENTS INTEND TO ADOPT IOT APPLICATIONS
IoT Applications
Intention to adopt IoT applications (%)
regardless the time of adoption
within 5 years Gap
Home Security 59.091 54.727 4.364
Smart Appliance 63.636 59.273 4.364
Smart Energy Meter 63.636 58.364 5.273
Wearable Device 66.545 61.455 5.091
Connected Cars 62.727 57.636 5.091
Smart Health 71.455 64.000 7.455
TABLE 5.DESCRIPTIVE STATISTICS OF INDEPENDENT VARIABLES
No Factors Mean Standard Deviation
1 Innovativeness 3,85 0,76
2 Usefulness 4,02 0,69
3 Social Influences 3,45 0,87
4 Ease of Use 4,03 0,75
C. Determinants of Intention towards IoT applications
This sub section contains an analysis of factors will likely affect the intention against IoT applications. Table 5 presents survey results of independent variables or factors. The table shows that all average exceed 3. However, it is required to perform further analysis to come to a conclusion about how significant each factor in influence the intention to adopt IoT. The first step is to evaluate the model utilized in this study. This evaluation is needed to find out how suitable the model with the data. We analyze the survey data by using SPSS.
1) Evaluation of overall model
This evaluation intends to examine whether the model closely fits with survey data compared to the model with the intercept only. In SPSS, this test is called Omnibus Tests of Model Coefficients. Omnibus Tests of Model Coefficients are performed to see to what extent the predictors affect the model by observing the significant level of each. Each application has its own value of Chi-Square, a degree of freedom, and signification level. According to Table 6, there are four dependent variables with a significant level less than 0.05; they are IoT application of the smart appliance, smart energy meter, wearable device, and smart health, while two others have a significant level less than 0.1 each. These values show that the predictors have a significant impact and create the different model compared to the model containing only the constant or intercept. These results lead us to look closely at the predictors or factors that significantly affect the intention to adopt IoT applications.
2) Goodness-of-fit
Goodness-of-fit statistically assess the fit of the logistic model towards actual outcomes. The test used to examine
the goodness-of-fit is the Hosmer-Lemeshow (L) test. H-L test is a Pearson Chi-Square statistic. The test yield the values of X2 for all IoT application are greater than 0.05.
These results suggest that the model was fit with survey data. The other measures of goodness-of-fit are R2indices,
defined by Cox&Snell as well as by Nagelkerke. These two indices are the variations of R2 concept in OLS or linear
regression model. R2 indicates the ability of independent
variables in describing dependent variables. However, These two R2 are unable to explain the meaning of variance of a
logistic model [41], [42].
3) Statistical tests of individual independent variables
The statistical significance of each independent variable regression coefficient is examined by using Wald Chi-Square statistic test as presented in Table A.2 (in Appendix). According to the table, there is only one of five independent variables or factors has acceptable significant levels, namely usefulness. Empirically, this factor significantly affects respondents interest to use all mentioned IoT applications on the significance level less than 0.05, except for smart appliance whose significant level less than 0.1. For social research, significance level of 0.1 is considered as acceptable. This study finding is in line with that of [9], [12] that suggested usefulness as a key factor in explaining the IoT adoption. This finding emphasizes that users will unlikely to use IoT applications if they do not perceive IoT as useful.
V. CONCLUSION
This study aims to investigate the intention of Indonesian urban society against six IoT applications and to understand the factors likely will affect the intention. Surprisingly, the study found that all six IoT applications have attracted respondents, with more than 50% of total respondents state their intention to adopt them. The analysis has confirmed that of six IoT applications, the intention of adoption has been significantly affected by only one factor, i.e., usefulness.
The implication of the study finding as follows: related to usefulness, practitioners have to devote their efforts to provide more effective and efficient IoT products through sustainable development to improve benefit gained by IoT application consumers. We also suggest that IoT application provider should promote the possible benefit of IoT adoption, such as improve work performance, cost savings, increase convenience, etc.
The limitation of this study is whether the idea of IoT applications has been well conveyed to all respondents. The questionnaire has included the description and examples of each IoT application, yet it does not guarantee that all respondents completely understand what the application is since not all applications have already available in the Indonesian market. The next limitation is we use only one set of predictors for all six IoT applications. This may lead to a less precise response since the respondents' answers are responses in general against all six IoT applications.
TABLE 6.OMNIBUS TESTS OF MODEL COEFFICIENTS
IoT Applications Step, Block, and Model Chi-square df Sig
Home Security 13.288 7 .065
Smart Appliance 14.152 7 .049
Smart Energy Meter 17.311 7 .015
Wearable Device 19.653 7 .006
Connected Cars 12.201 7 .094
Smart Health 15.098 7 .035
TABLE 7.GOODNESS OF FIT
IoT Applications Hosmer and Lemeshow Test Chi-square df Sig.
Home Security 13.257 8 .103
Smart Appliance 14.844 8 .062
Smart Energy Meter 4.975 8 .760
Wearable Device 10.150 8 .255
Connected Cars 5.029 7 .656
APPENDIX
TABLE A.1 INTENTION TO ADOPT IOT APPLICATIONS BASED ON SOCIO -ECONOMIC BACKGROUND (IN %)
Socio-economic background
IoT Applications Smart
Appliances Smart Energy
Wearable Device
Connected Car
Smart Health
Home Security
Gender
Male 61.85 65.19 65.56 71.48 65.19 76.67 Female 56.43 62.14 61.79 61.79 60.36 66.43
Age
Below 28 59.13 62.32 63.77 66.96 64.06 73.04 28-42 Year 62.28 70.66 67.66 69.46 64.67 74.25 43-52 Year 40.00 43.33 40.00 46.67 43.33 43.33 Above 52 62.50 50.00 62.50 62.50 37.50 50.00
Education
Below Univ 56.32 58.62 61.49 63.79 64.37 67.24 University 60.37 65.96 64.63 67.82 61.97 73.40
Occupation
Jobless 51.61 54.84 57.14 62.21 58.99 67.74 Employee 62.96 67.78 65.93 67.04 63.33 71.85 Entrepreneur 65.52 79.31 79.31 82.76 75.86 82.76 Self-Empl. 61.54 69.23 61.54 69.23 61.54 76.92 Others 76.19 76.19 80.95 80.95 76.19 85.71
Marital Status
Single 56.76 60.66 61.26 65.77 63.36 71.47 Married 62.67 68.20 67.28 67.74 61.75 71.43
Total Spending per month (in IDR)
<1mn 55.10 57.14 61.73 64.80 60.71 73.47 1-2mn 58.00 67.33 63.33 70.00 65.33 72.00 >2-5mn 62.21 64.53 63.37 63.95 62.79 68.02 >5-10mn 69.23 80.77 76.92 69.23 61.54 73.08 >10mn 83.33 83.33 83.33 100.00 66.67 83.33
All Samples 59.09 63.64 63.64 66.55 62.73 71.45
TABLE A.2.VARIABLES IN THE EQUATION
Test Output of each factor
IoT Application Home
Security
Smart Appliance
Smart Energy
Wearable Device
Connected Car
Smart Health
Innovativeness
β -.015 .090 .065 .107 .089 .060
Wald .008 .368 .183 .489 .340 .162
Sig .929 .544 .669 .485 .560 .688
Usefulness
β .467 .345 .495 .554 .555 .557
Wald 5.921 3.631 6.924 8.389 8.565 8.534
Sig .015 .057 .009 .004 .003 .003
Social Influence
β -.014 -.020 -.009 .013 .021 .124
Wald .013 .032 .006 .012 .033 1.147
Sig .910 .859 .937 .911 .857 .284
Ease of Use
β -.059 .128 .032 .086 -.115 .017
Wald .123 .670 .041 .288 .495 .011
Sig .725 .413 .839 .592 .482 .915
Price/Cost
β .060 .050 .070 .070 .070 .031
Wald .367 .292 .560 .550 .541 .107
Sig .545 .589 .454 .458 .462 .744
Constant
β .097 -.211 -.446 -.362 .308 .250
Wald .022 .118 .505 .329 .229 .154
Sig .882 .732 .478 .567 .632 .695
REFERENCES
[1] Lopez Research, ‘An Introduction to the Internet of Things (IoT)’,
cisco.com, Nov-2013. .
[2] Ericsson, ‘Ericsson Mobility Report’, ericsson.com, Jun-2017. .
[3] S. Lucero, ‘IoT platforms: enabling the Internet of Things’, Mar. 2016.
[4] Gartner, ‘Gartner Says 8.4 Billion Connected “Things” Will Be in Use in 2017, Up 31 Percent From 2016’, gartner.com, Feb-2017. . [5] J. Manyika et al., ‘Unlocking the potential of the Internet of
Things’, McKinsey, Jun-2015. .
[6] A. Blanter and M. Holman, ‘Internet of Things 2020: A Glimpse into the Future’, AtKearney, Aug-2015. .
[7] J. Greenough, ‘The “Internet of Things” Will Be The World’s Most Massive Device Market And Save Companies Billions Of Dollars’,
Business Insider, 09-Oct-2014. .
[8] C.-L. Hsu and J. C.-C. Lin, ‘An empirical examination of consumer adoption of Internet of Things applications: Network externalities and concern for information privacy perspectives’, Computers in Human Behavior, vol. 62, pp. 516–527, Sep. 2016.
[9] Lingling Gao and Xuesong Bai, ‘A unified perspective on the factors influencing consumer acceptance of internet of things technology’, Asia Pac Jnl of Mrkting & Log, vol. 26, no. 2, pp. 211–231, Apr. 2014.
[10] Y. Kim, B. Choi, and J. Choi, ‘A Study on the Successful Adoption of IoT Applications : Focused on iBeacon and Nearby’, Journal of the Korea Society of IT applications, vol. 14, no. 1, pp. 217–236, 2015.
[11] K. Patil, ‘Retail adoption of Internet of Things: Applying TAM model’, in 2016 International Conference on Computing, Analytics and Security Trends (CAST), 2016, pp. 404–409.
[12] Y. Kim, Y. Park, and J. Choi, ‘A study on the adoption of IoT smart home application: using Value-based Adoption Model’, Total Quality Management & Business Excellence, vol. 0, no. 0, pp. 1– 17, Apr. 2017.
[13] BPS, Regulation of Head of Central Bureau of Statistics No. 37/2010 regarding Classification of Urban and Rural in Indonesia. 2010.
[14] A. Adhiutama, ‘Behavior Intention towards the Adoption of Innovative Household Sanitary Ware: A Case Study of Jakarta, Indonesia’, the Asian Journal of Technology Management, vol. 4, no. 2, pp. 115–125, 2011.
[15] M. Ali, P. Chin-Hong, and I. Arif, ‘Determinants of e-banking adoption: A non-users perspective in Pakistan’, MPRA, 01-Oct-2015. .
[16] S. Paydar, I. R. Endut, S. Yahya, and S. H. A. Rahman, ‘Environmental Factors Influencing the Intention to Adopt RFID Technology in Retail Industry: An Empirical Study’, Asia-Pacific Journal of Management Research and Innovation, vol. 10, no. 1, pp. 13–26, Mar. 2014.
[17] M. A. Jaffar and R. Musa, ‘Determinants of Attitude and Intention towards Islamic Financing Adoption among Non-Users’, Procedia Economics and Finance, vol. 37, pp. 227–233, 2016.
[18] T.-Q. Peng, J. J. H. Zhu, J.-J. Tong, and S.-J. Jiang, ‘Predicting Internet Non-Users’ Adoption Intention and Adoption Behavior’,
Information, Communication & Society, vol. 15, no. 8, pp. 1236– 1257, Oct. 2012.
[19] ITU-T, ‘ITU-T Rec Y.2060 : Overview of the Internet of things’,
International Telecommunication Union, 2012. .
[20] D. Bandyopadhyay and J. Sen, ‘Internet of Things: Applications and Challenges in Technology and Standardization’, Wireless Pers Commun, vol. 58, no. 1, pp. 49–69, May 2011.
[21] S. Bandyopadhyay, P. Balamuralidhar, and A. Pal, ‘Interoperation among IoT Standards’, Journal of ICT Standardization, vol. 1, no. 2, pp. 253–270, Nov. 2013.
[22] A. Banafa, ‘Three Major Challenges Facing IoT’, ieee, 14-Mar-2017. .
[23] R. Rahayu and J. Day, ‘Determinant Factors of E-commerce Adoption by SMEs in Developing Country: Evidence from Indonesia’, Procedia - Social and Behavioral Sciences, vol. 195, pp. 142–150, Jul. 2015.
[24] P. Ueasangkomsate, ‘Adoption E-Commerce for Export Market of Small and Medium Enterprises in Thailand’, Procedia - Social and Behavioral Sciences, vol. 207, pp. 111–120, Oct. 2015.
[25] N. Ramadhani, P. B. Kalaskar, and V. B. Satpute, ‘A Study on Consumer Perception towards Adoption of 4G Mobile Technologies in Rwanda’, American Scien tific Research Journal for Engineering, Technology, and Sciences, vol. 14, no. 2, p. 187–1 97, 2015.
[26] S.-C. Lin, S.-W. Lin, P. S. Chen, and Y.-K. Liu, ‘Adoption of 4G Wireless Applications Under Consideration of Technology and Economic Perspectives’, Int. J. Mob. Commun., vol. 13, no. 1, pp. 71–91, Nov. 2015.
of commercial banks in Mauritius’, W J of Sci, Tech and Sus Dev, vol. 9, no. 3, pp. 204–234, Jul. 2012.
[28] Mehmet Haluk Koksal, ‘The intentions of Lebanese consumers to adopt mobile banking’, Intl Jnl of Bank Marketing, vol. 34, no. 3, pp. 327–346, Apr. 2016.
[29] R. de S. Abrahão, S. N. Moriguchi, and D. F. Andrade, ‘Intention of adoption of mobile payment: An analysis in the light of the Unified Theory of Acceptance and Use of Technology (UTAUT)’, RAI Revista de Administração e Inovação, vol. 13, no. 3, pp. 221–230, Jul. 2016.
[30] K. Ariansyah, ‘Estimasi kebutuhan spektrum untuk memenuhi target rencana pita lebar Indonesia di wilayah perkotaan (The estimation of spectrum requirements to meet the target of Indonesia broadband plan in urban area)’, Buletin Pos dan Telekomunikasi, vol. 13, no. 2, p. 115, Dec. 2015.
[31] C.-L. Hsu and J. C.-C. Lin, ‘Exploring Factors Affecting the Adoption of Internet of Things Applications’, Journal of Computer Information Systems, vol. 0, no. 0, pp. 1–9, Sep. 2016.
[32] R. A. Nugroho and T. N. Haryani, ‘Generation X and generation Y perception towards Internet of Things in public application: A preliminary study in Indonesia’, in 2016 22nd Asia-Pacific Conference on Communications (APCC), 2016, pp. 110–114. [33] GSMA, ‘GSMA: The Impact of the Internet of Things’, GSM
Association, London, 2015.
[34] L. Bergkvist and J. R. Rossiter, ‘The Predictive Validity of Multiple-Item versus Single-Item Measures of the Same Constructs’, Journal of Marketing Research, vol. 44, no. 2, pp. 175–184, 2007.
[35] W. A. Kamakura, ‘Measure twice and cut once: the carpenter’s rule still applies’, Mark Lett, vol. 26, no. 3, pp. 237–243, Sep. 2015. [36] L. Bergkvist, ‘Appropriate use of single-item measures is here to
stay’, Mark Lett, vol. 26, no. 3, pp. 245–255, Sep. 2015.
[37] J. R. Rossiter, ‘The C-OAR-SE procedure for scale development in marketing’, International Journal of Research in Marketing, vol. 19, no. 4, pp. 305–335, Dec. 2002.
[38] A. Alexandrov, ‘Characteristics of Single item Measures in Likert Scale Format’, The Electronic Journal of Business Research Methods, vol. 8, no. 1, pp. 1–12, 2010.
[39] C.-Y. J. Peng, K. L. Lee, and G. M. Ingersoll, ‘An Introduction to Logistic Regression Analysis and Reporting’, The Journal of Educational Research, vol. 96, no. 1, pp. 3–14, Sep. 2002.
[40] F. Janssen, ‘Do Managers’ Characteristics Influence the Employment Growth of SMEs?’, Journal of Small Business & Entrepreneurship, vol. 19, no. 3, pp. 293–315, Jul. 2006.
[41] J. . Long, Regression models for categorical and limited depen- dent variables. Thousand Oaks: CA Sage, 1997.