Available online at www.JGTPS.com
ISSN: 2230-7346
Research Article
Journal of Global Trends in Pharmaceutical Sciences,
Vol.3, Issue 2, pp 671-676, April-June 2012
A VALIDATED LC-UV METHOD FOR THE ESTIMATION OF QUETIAPINE IN PHARMACEUTICAL DOSAGE FORMS
S. Shahe Mahammad*1, Madhusudhana Chetty2, K.V Ramana Murthy3
1Jawaharlal Nehru Technological University, Hyderabad, Andhra Pradesh, India-500085
2Annamacharya college of Pharmacy, Rajampeta, Andhra Pradesh, India-516126
3Department of Pharmaceutical Sciences, College of Pharmaceutical Sciences, Andhra
University, Visakhapatnam, Andhra Pradesh, India-530003
*Corresponding Author E-mail: [email protected]
ABSTRACT
A simple, precise, accurate and sensitive LC-UV method was developed and validated for the quantification of quetiapine fumarate (QPF) in the pharmaceutical dosage forms. The chromatography separations were carried out on Agilent Eclipse plus C-8 (4.6 X 75 mm, 3.5 µm) column. The mobile phase consisted of 10 mM ammonium acetate and 100% methanol. Initially the run started with 100% aqueous phase and reached to 100% organic phase in 5 minutes, then 100% organic phase for 3 minutes and subsequently 100% aqueous phase for 2 minutes and followed by stabilization for 4 minutes with 100% aqueous phase. Milli-Q water: methanol (50:50 v/v) mixture was used as diluent. The flow rate was 1.0 mL/min with detection at 254 nm. Injection volume was 10 µL and column temperature was 40 °C. Auto- sampler temperature was 10 °C. The LC method was validated with respect to various parameters, as required under ICH guideline. The response of QPF was strictly linear (r2: 0.9999) in the concentration range of 2.80 to 200 µg/mL. Intra-day and inter-day precision were <0.59% and <0.83% (relative standard deviation) respectively and the mean recovery was 100.46%. The validated method was further used for all the pre-formulation and formulation analytical studies (viz., purity and assay) targeted towards development of controlled drug delivery systems for QPF.
Key Words: Quetiapine Fumarate, HPLC, validation.
INTRODUCTION
Quetiapine fumarate (QPF) is chemically bis[2-(2-[4-(dibenzo[b,f][1,4]thiazepin-11-yl)piperazin-1-l]ethoxy)ethanol]fumarate) is a dibenzothiazepine derivative approved for the management of manifestation of psychotic disorders. QPF is an antagonist at a broad range of neurotransmitter receptors. QPF is used in the treatment of schizophrenia or manic episodes associated with bipolar disorder. It has low incidence of extrapyramidal side effects and tardive dyskinesias compared to older
(HPLC) [5-7] and and high performance thin layer chromatography (HPTLC) [8]. Most of the reported HPLC methods are based on mobile phases containing compounds such as potassium hydrogen phosphate, phosphoric acid, etc., which shorten the life span of a column and also these methods are not compatible for LC-MS. Hence, the objective of the present study was to develop and validate a simple, reliable HPLC method for the quantification of QPF in pharmaceutical preparations.
EXPERIMENTAL Materials:
QPF was a gift sample by Ajanta Pharma Ltd, Mumbai, India. The following excipients were purchased from commercial sources and used as such, lactose mono hydrate (Signet Chemical Corporation Pvt Ltd, Mumbai, India), Carbopol 974P (Meggle, Germany), HPMC K100M (Signet Chemical Corporation Pvt Ltd, Mumbai, India), A-tab® (Dibasic calcium phosphate
anhydrous, granular, Signet Chemical Corporation Pvt Ltd, Mumbai, India), magnesium stearate® (Mallinckrodt, USA), Benecel (Dow, USA), chitosan (Sigma-aldrich), gum kondagogu (Grade-1, M/s. Girijan Co-operative Corporation, India). The HPLC grade solvents such as acetonitrile and methanol were purchased from Ranbaxy, India and chemicals potassium dihydrogen orthophosphate GR and ammonium acetate GR were purchased from Loba Chemicals, India. Instrumentation:
The Chromatography separations were performed on an Agilent 1200 liquid chromatography system. The instrument was equipped with a G1330B pump, a G1315D Diode array detector variable UV/visible detector, a G1329 auto sampler injector, and Agilent Chemstation chromatography workstation (Agilent, USA). The Chromatography separations
were carried out on Agilent eclipse plus C-8 (4.6 X 75 mm, 3.5 µm) column.
Chromatographic conditions:
The gradient mobile phase consisted of 10 mM ammonium acetate and methanol. The mobile phase components were filtered through 0.45 micron membrane filter before use. Initially the run started with 100% aqueous solution and reached to 100% organic phase in 5 minutes, then 100% organic phase for 3 minutes followed by 100% aqueous phase for 2 minutes and stabilization for 4 minutes with 100% aqueous phase. The detection was monitored at 254 nm and the run time was 14 min. The flow rate was 1 mL/min and the volume of injection loop
was 10 μL. Prior to the injection of the
drug solution, the column was equilibrated for at least 30 minutes with the mobile phase flowing through the system. The column temperature was 40 °C and the auto- sampler temperature was 10 °C.
Stock solution preparation:
Weighed exactly 100 mg of QPF into 100 mL volumetric flask, approximately 25 mL of methanol was added and sonicated for 5 to 10 minutes. The volume was made up to 100 mL with methanol. The subsequent dilutions were prepared by diluting stock solution with the mobile phase.
Validation of the method:
The method was validated for linearity, accuracy and precision as per the ICH guidelines [9].
RESULTS AND DISCUSSION
used pharmaceutical excipients did not interfere with the estimation of the drug by proposed HPLC method. Also, the peak of interest was chromatographically pure confirmed through the use of PDA detector.
Specificity:
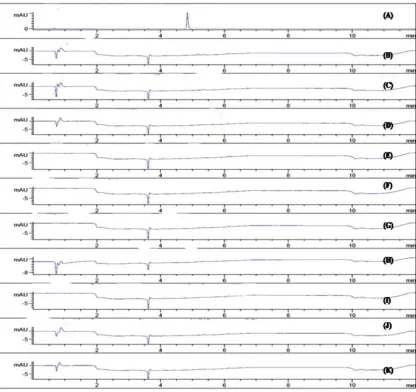
Specificity is the ability to assess unequivocally the analyte in the presence of components which may be expected to be present. Typically these might include impurities, degradants, matrix, etc. Specificity was tested by injecting the spiked sample of QPF with appropriate levels of pharmaceutical relevant excipients such as lactose monohydrate, A-tab, Benecel, HPMC K100M, Carbopol 934P, and magnesium stearate. Other polymers of interest such as gum kondagogu, chitosan and the polyelectrolyte complex of gum kondagogu and chitosan were also included in the study. No interference was observed in any of the cases, and the same is evident from the results Figure 1.
Delectability:
The parameters, limit of quantification (LOQ) and limit of detection (LOD) were determined on the basis of signal to noise ratio. The signal to noise ratios in the range of 8-12:1 was considered for the LOQ and 3-5:1 for the LOD. The LOQ and LOD was found to be 3.12 µg/mL (signal to noise ratio: 13:1) and 1.56 µg/mL (signal to noise ratio- 6:1) respectively. The recovery for LOQ solution was 102.5% with reproducibility of 2.30% (RSD) for triplicate injection at this level. The LOD, LOQ and blank overlay chromatogram is shown in Figure 2.
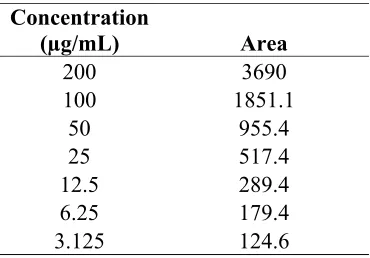
Range of linearity:
The linearity of peak area responses vs. concentrations was studied from
2.8-200 μg/mL. The linearity was evaluated by
linear regression analysis using the least square method. It was found that
correlation coefficient and regression analysis are within the limits.
The linearity experiment was carried out in triplicate to ascertain accuracy and precision of the method. The regression equation of QPF concentration over its peak area ratio was found to be Y= 66.17x + 18.02 (r2=0.9999) where Y is the peak area ratio and x is the concentration of
QPF (μg/mL). The peak area ratios of the
drug vs. concentration were found to be linear and the results are furnished in Table 1.
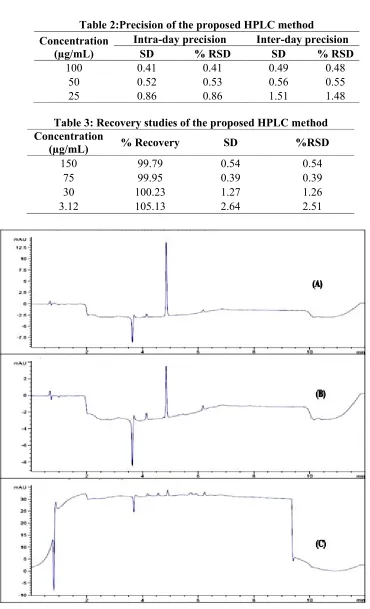
Method repeatability/precision:
The precision of the assay was determined in terms of intra-day and inter-day precision. The intra-inter-day and inter-inter-day variation in the peak area of drug solution was calculated in terms of percentage relative standard deviation (% RSD). The % RSD values for intra-day and inter-day precision studies were found to be less than 1%, which indicates that the method was sufficiently precise. The results are shown in Table 2.
Accuracy:
The accuracy of the method was assessed by adding known amount of drug solution in to a drug solution of known concentration and subjecting the samples to the developed method. The recovery studies were replicated 3 times. The accuracy was expressed in terms of recovery and the results are shown in Table 3.
Table 1: Calibration data for QPF
Concentration
(µg/mL) Area
Table 2:Precision of the proposed HPLC method Concentration
(µg/mL) 100
50 25
Table 3: Recovery studies of the proposed HPLC method Concentration
(µg/mL) % Recovery 150
75 30 3.12
Figure 1: The HPLC chromatograms of
Precision of the proposed HPLC method
Intra-day precision Inter-day precision
SD % RSD SD % RSD
0.41 0.41 0.49 0.48
0.52 0.53 0.56 0.55
0.86 0.86 1.51 1.48
Recovery studies of the proposed HPLC method
% Recovery SD %RSD
99.79 0.54 0.54
99.95 0.39 0.39
100.23 1.27 1.26
105.13 2.64 2.51
HPLC chromatograms of QPF A) LOQ, B) LOD and C) Blank day precision
% RSD 0.48 0.55 1.48
Figure 2: The HPLC chromatograms of A) QPF (0.1 mg/mL), B) A
Carbopol 934p, E) Chitosan, F) Polyelectrolyte complex of gum kondagogu and chitosan, G) Gum kondagogu, H) HPMC K100M
Magnesium stearate, and K) Blank CONCLUSION
The proposed HPLC method was found to be simple, rapid, sensitive, precise and accurate for the estimation of QPF in pharmaceutical formulations.
REFERENCES
1 Goldstein J, Arvanitis L. ICI 204,636 (Seroquel): a dibenzothi
atypical antipsychotic. Review of preclinical pharmacology and highlights of Phase II clinical trials.
HPLC chromatograms of A) QPF (0.1 mg/mL), B) A-tab, C) Benecel, D) Carbopol 934p, E) Chitosan, F) Polyelectrolyte complex of gum kondagogu and
G) Gum kondagogu, H) HPMC K100M, I) Lactose monohydrate J) Magnesium stearate, and K) Blank
The proposed HPLC method was found to be simple, rapid, sensitive, precise and accurate for the estimation of in pharmaceutical formulations.
Hence, this method can easily and conveniently adopt for routine quality control analysis of QPF
pharmaceutical formulations
Goldstein J, Arvanitis L. ICI 204,636 (Seroquel): a dibenzothiazepine Review of preclinical pharmacology and highlights of Phase II clinical trials.
CNS Drug Rev1995; 1: 50
2 Small JG, Hirsch SR, Arvanitis LA, et al. Quetiapine in patients with schizophrenia. Ahigh- and low double-blind comparison with placebo.
tab, C) Benecel, D) Carbopol 934p, E) Chitosan, F) Polyelectrolyte complex of gum kondagogu and
, I) Lactose monohydrate J)
Hence, this method can easily and conveniently adopt for routine quality QPF in its
1995; 1: 50-73
Seroquel Study Group. Arch Gen Psychiatry1997; 54: 549-57
3 Arvanitis LA, Miller BG. Multiple fixed doses of ‘Seroquel’(quetiapine) in patients with acute exacerbation of schizophrenia:a comparison with haloperidol and placebo. The Seroquel Trial 13 Study Group. Biol Psychiatry
1997; 42:233-46
4 Hiraman BB, Sandip V, Lohiya RT and Umekar MJ. Spectrophotometric Determination of an Atypical Antipsychotic Compound in Pharmaceutical Formulation. Int J Chem Tech Res2009; 1:1153-1161. 5 Belal F, Elbrashy A, Eid M and Nasr
JJ. Stability‐Indicating HPLC Method for the Determination of Quetiapine: Application to Tablets and Human Plasma. J Liq Chromatogr Relat Technol 2008; 31: 1283-1298.
6 Davis PC, Wong J and Gefvert O. Analysis and pharmacokinetics of quetiapine and two metabolites in human plasma using reversed-phase HPLC with ultraviolet and
electrochemical detection. J Pharm Biomed Anal1999; 20: 271-282. 7 Mandrioli R, Fanali S, Ferranti A and
Raggi MA. HPLC analysis of the novel antipsychotic drug quetiapine in human plasma. J Pharm Biomed Anal
2002; 30: 969-977.
8 Dhandapani B, Somasundaram A, Raseed S H, Raja M and Dhanabal K. Development and Validation of HPTLC Method for Estimation of Quetiapine in Bulk Drug and in Tablet Dosage form. Int J Pharm Tech Res
2009; 1: 139-141