Members of bacterial communities communicate and cooperate via diffusible chemical materials they emit into the environment, and at the same time, they also compete for nutrients and space. Agent-based models (ABMs) are useful tools for simulating the growth of communities containing multiple interacting microbial species. In this work we present numerical indices characterizing spatial distribution and the fitness of competing bacterial species in an ABM and we present data on how these indices can be used to visually summarize large scale simulation experiments. Preliminary results show bacterial agents utilizing different nutrients but sharing communication signals and public goods can form stable mixed communities in which the species grow faster than any of the single species alone.
Key words: quorum sensing,Pseudomonas aeruginosa, hybrid model, statistics, segregation, fitness
1. Introduction, state-of-the-art. Multispecies microbial communities are now recognized as a major form of bacterial life. These communities (such as the gastrointestinal flora, the microflora of dental cavities, the rhizosphere around plant roots or the large microbial mats on the seafloor) contain more than one species. Computer simulations play an important role in the study of these communities since it is extremely complicated to collect reliable data on the size and growth dynamics of free-living bacterial communities.
The interaction between individual bacteria in a community is often based on the exchange of diffusible signals, the best known example of which is a mechanism called quorum sensing (QS) [1, 2]. In this mechanism, signaling materials secreted by the bacteria are supposed to spread in the environment by diffusion. The concentration of signals regulates the behavior of bacteria, which results in collective patterns of behavior, such as coordinated movement (e.g. swarming), secretion of specific materials, resistance to antibiotics, etc. When the concentration of the secreted signal is greater than a certain threshold, bacteria, such as Pseudomonas aeruginosa, switch from low to high metabolic activity, they increase the amount of secreted signaling molecules and they also start to secret other molecules, frequently referred to as ”public goods” or simply ”factors” (e.g. surfactants, enzymes, siderophores), which facilitates movement and nutrient uptake [2, 3]. As a result, the colony changes behavior, for instance it starts to grow and expand. In some cases, this is accompanied by a swarming motion of the cells.
There are various approaches for modeling the growth of bacterial communities. Continuous models rep-resent both the nutrients and the bacterial colony as continuous quantities described by reaction-diffusion equations [3]. Agent-based models consider bacteria as individuals capable of nutrient uptake, movement and cell-division [4, 5]. In agent based models, the nutrients are often considered as diffusing materials described by reaction-diffusion equations - these models are specifically called ”hybrid models” as they combine individual-based agents with diffusing materials. Continuous and agent-individual-based hybrid models were used primarily to show that colony shapes (especially the well known fractal-like or circular shapes) can be reproduced by simple models [3, 4, 5].
Recently we adapted the hybrid methodology for describing the behavior of QS bacteria [6, 7]. Briefly, agents representing individual bacteria move randomly on a 2D plane in this model, and they secrete two kinds of materials, a signalS and a factorF (public goods material) that both spread via diffusion on the 2D plane. Agents have different ”physiological” states and they switch between states depending on the local concentration ofS andF. In the ground state (S andF below threshold), nutrient uptake, movement and signal production is at a low level. In the activated state (S above threshold,F below threshold), the production of public goods (F) starts, and signal production is upgraded to a higher level. In the quorum state, signal production is high, production of public goods is high, and movement and nutrient uptake are also upgraded to a higher level. In
1
Faculty of Information Technology, P´azm´any P´eter Catholic University, Pr´ater u. 50/a. 1083 Budapest, Hungary,2
Biological Research Centre of the Hungarian Academy of Sciences, H-6726, Szeged, Temesv´ari krt. 62, Hungary, 3
Ume˚a University, SE-901 87 Ume˚a, Sweden, 4International Centre for Genetic Engineering and Biotechnology, Padriciano 99, I-34012 Trieste, Italy,
[email protected],⋆These authors contributed equally.
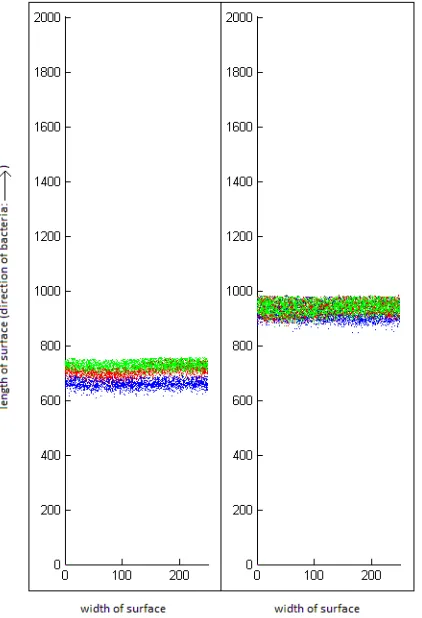
Fig. 1.1: Simulation of segregation (left) and co-localization (right) of mixed, swarming communities. In these experiments, the three species consumed nutrients that were not accessible for the other species. In the left lane, the species could neither communicate nor cooperate with the other species. In the right lane, the species could communicate and cooperate with each other.
summary, the cells’ behavior (nutrient intake, movement, production of signals and public goods) alternates between two levels, according to certain threshold criteria. In a simulation run, a small number (usually 2000) of ground state agents are placed randomly at the bottom of a cylindrical surface (Figure 1) and then let to perform nutrient uptake, movement etc. according to their individual programs. When the cells accumulate a certain quantity of nutrients, they divide and the progeny increases the number of living cells. Cells that run out of nutrients ”die”. This is a highly simplified model in which all parameters are in arbitrary units, and time is represented as discrete time steps. Nevertheless the model is able to reproduce seemingly complex behavior patterns that occur in natural bacterial communities: a) Switching from ground state to an active (quorum) state is dependent on cell density - this is the fundamental hypothesis of quorum sensing. b) The colony is capable to track external signals - this phenomenon occurs in nature when plant roots recruit bacteria from the surrounding rhizosphere. c) Bacteria that respond to signal but are unable to produce it, are capable to form viable communities with healthy (wild type) cells that both produce and sense the signal. d) Mutants that do not cooperate (do not produce public goods) will collapse a community of healthy (wild type) cells [6, 7].
bacteria sense the presence of other members of their species. The best studied version of this phenomenon is based on the secretion of diffusible signals(QS signals) and other materials called public goods. Public goods are materials that are useful not only for the cell that secretes them but for any cell that can use them. This is often referred to ascooperation, since a cell cooperates with the community by producing materials. In contrast, signaling via diffusible signals is often referred to ascommunication. Cells that are able to both communicate (i.e. produce and sense signals) and cooperate (produce and sense public goods) are referred to as wild type or wt cells. Cells that are different from wt cells are briefly referred to as mutants since it is normally assumed that they lost some of the abilities (or gained new ones) by mutation. QS is studied perhaps in the greatest detail in the bacteriumPseudomonas aeruginosawhich is an ubiquitous, opportunistic pathogen causing potentially lethal infections to humans. Other members of the Pseudomonas genus are ubiquitous in soil and water and are sometimes beneficial to host organisms such as plants.
3. Spatial segregation of agent communities. In the simulation model the space is represented as a cylindrical surface on which the bacterial community starts from the bottom and proceeds upwards while consuming the nutrients found on the surface. We can follow the collapse or survival of a species by counting the number of cells at each step. On the other hand, the spatial distribution of cells also changes in time: some communities segregate while they move (Figure 1.1, left) while others remain co-localized (right). Mitri et al. [9] have described this behavior by an intuitive segregation index based on the work of Nadell et al. [10] which depends on counting an arbitrary number of nearest neighbors for each agent. This is anO(n2) algorithm with respect to the number n of agents, and since the calculation has to be repeated at every time step for communities as large as say 50 thousand members, we were looking for alternative ways to describe spatial segregation. In order to develop a segregation index that can be calculated in a more time efficient manner, we take advantage of the fact that space in our simulation is divided into squares that form a matrix-like lattice. In each square we can count the number of bacteria from each species. E.g. for three species (denoted i, ii and iii, respectively) we can calculaten1(i), n2(i), n3(i) in the ith square, so we can express the fraction (or
percentage) of each species within the square. If a population is segregated, this fraction is almost 1 for one of the species and almost 0 for the two other species, so we define the segregation index as the maximum fraction of a species - in other words, the fraction of the dominant species - within a given spatial unit (in the 2D plane). We get a more representative value if we weight these fractions with the total number of bacteria in the actual unit of space. By this step we get the segregation coefficient which is the average of the number of the dominant species in the given spatial units, divided by the number of the total population.
SG=
P
imax(ni) Npopulation
, (3.1)
where max(ni) is the cell number of the dominant species within the ith space unit, the denominator it the total number of the population (including all species). For a randomly mixed community (such as shown in Figure 1.1, right), this quantity will approach the reciprocal of the number of species present which allows us to construct a [0,1] numerical index as follows:
SGN=
SG− 1
Nspecies
1−Nspecies1
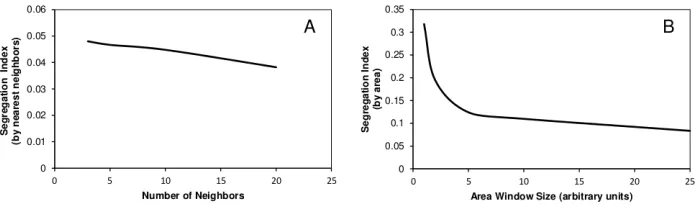
Fig. 3.1: Calculation of the segregation index for a homogeneous (non-segregated community). The Y axis is the normalized segregation index. A. Normalized segregation index calculated by nearest neighbors vs. the number of neighbors included in the calculation. B. Normalized segregation index calculated surface area vs. the size of the surface area included in the calculation.
where SGN is the normalized segregation index calculated at a certain time step and Nspecies is the number of agent species present. This quantity is between zero and 1.0. SG = 1 if the population is segregated, in a fashion seen in Figure 1.1, left. SG = 0 means that the populations are co-localized, in a fashion seen in Figure 1.1, right. The calculation of this index is not time consuming, it has a time complexity of O(n). Whether we calculate the segregation index using the number of nearest neighbors, or based on surface area units, we have an arbitrary parameter in the calculation - the number of neighbors in the first case, and in the second case, the size of the surface included in the calculation. We tested the behavior of the indices on binary communities segregated to various extents. On well segregated communities, both calculations gave values of 1.0 throughout the entire parameter range (3 to 20 nearest neighbors or 1 to 25 units of surface area, data not shown). On homogeneous communities the values depended on the parameters (Figure 3.1). As expected, the calculation by surface area was about 2 orders of magnitudes faster than the one calculated by nearest neighbors. The area-dependent calculation is sensitive to the size of the area used for the calculation, while the nearest neighbor-dependent index is dependent to the number of neighbors included in the calculation.
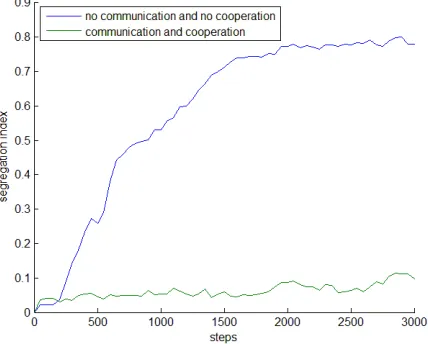
The dependence on the window size was practically the same for various window shapes, we found no difference between 50x1 square, 25x2 square, or 10x5 square windows. Nevertheless, the values are parameter dependent, as shown in Figure 3.1., so it is recommended to use SGN on a comparative bases,i.e. for populations of the same size and density. In practice we calculated SG indices for the horizontal rows (50 area units) of the 2D space matrix that maps the space in Figure 1.1. SGN shows typical saturation kinetics as a function of time. If the populations segregate, SGN converges to a value above 0.8. If the populations co-localize, the value remains low, an example is shown in Figure 4.1.
4. Relative fitness calculation. In biology, the fitness of a population (say a colony of bacteria) is calculated from the growth of the population achieved in a given time (for a recent review see [11]). In fact, since the work of Darwin, many increasingly sophisticated methods were developed to define fitness.
From these, we chose a simple formula that has been used for agent communities by Mitri et al. [9]:
F= 1
∆tlog2 Nend Nstart
, (4.1)
whereF is the fitness, Nstart, and Nend, are the size of the population at the start and end of the experiment respectively, ∆t is the elapsed time. For increasing population the logarithm is positive, however for decreasing populations it becomes negative. Fitness is a dimensionless number which is often represented on a relative scale, in comparison with the fitness of a reference species. This is especially handy in our case since we can easily select one of the species, e.g. the wild type (wt) species as the reference and then we get:
Frel =
log2 Nend
Nstart
log2
N
end,wt
Nstart,wt
Fig. 4.1: Example of segregating (blue) and co-localizing (green) communities. The Y axis is the normalized segregation index calculated by surface area (10 units), the X axis shows time steps within the simulation. The experiment is the same as described in the legend of Figure 1.1
whereFrel is the relative fitness, Nend,wt and Nstart,wt are the reference values for wild type population. The ∆tof eqn. 4.1 terms are cancelled by the division. It is important to note that relative fitness is often calculated between two competing species. We followed a different strategy, we used the wild type species growing alone, as the reference. So in this case, the relative fitness will tell us if members of a community grow better or worse if they grow together, in other words, if it is an advantage to be in a community. Table 4.1 shows typical simulation results for a ternary community in which 3 species were put together in equal amounts. The experiment is the same as described in Figure 1.1, i.e. in one case the 3 species can neither communicate, nor cooperate, in the other case they both communicate and cooperate.
The experiments in Table 4.1 show that the relative fitness of all participant species increases if they can communicate (signal sharing) and cooperate (sharing of public goods or factors). In these experiments, all species had their own nutrients that could not be consumed by the other species, so the conclusions may not hold for other conditions.
5. Correlation measures. Ever since the simulation of multi-particle systems became feasible, correlation measures were used in many areas of physics and chemistry. The correlation functions developed in molecular dynamics [12] can be especially easily extended to cellular or animal systems [13, 14]. In this paper, the movement of two agentsi, j is called correlated if their velocities point to the same direction. In this case the inner product of the unit vectors of velocity →vi
→
vj will be 1.0. For a population of agents we can calculate an aggregate measure by determining the inner product of alli,j, (j > i) agent pairs. The average correlatedness of the velocities ofnagents can be expressed as:
Table 4.1: Comparison of relative fitness in communicating, cooperating populations and non-communicating, non-cooperating communities.
Species 1 Species 2 Species 3
Single wild type population alone 1.000 -
-Co-localized community
(cooperation + communication) 1.2402 1.2304 1.3063
Segregated community
(no cooperation, no communication) 1.0062 1.0188 1.0094
c= 2
n(n−1)
X i X j>i → vi →
vj. (5.1)
The value ofc is close to one for agents moving in a perfectly correlated manner. Randomly moving agent populations have c values close to zero. Adding an increasing amount of noise to the direction of velocity vectors in a perfectly coordinated community will decrease the value ofcfrom 1.00 to around 0.00. In other words,ccan be used to characterize the level of order within an agent community. In practice, it is convenient to calculate this measure for a given subset of the agents, e.g. limiting the second summation either to agents within a certain distance boundary, or only to a certain number of neighbors. In statistical physics it is customary to limit the calculations for a distance interval [r, r+δ] around each agent. Plotting the resulting correlatedness values as a function ofr will give an impression on how the movement of agents is correlated with more and more distant neighbors.
If the population of agents consists of two subpopulations,AandB, one can calculate correlation measures following (5.1), either i) for the entire population, or ii) for either of the two populations. In addition, one can calculate the correlatednes iii) between the two populations as follows:
cAB= 2
n(A)n(B)
X
i∈A X
j∈B
→
vi
→
vj, (5.2)
wheren(A) andn(B) denote the number of agents in speciesAandB, respectively.
A further type of measure, autocorrelation of the velocities characterizes the change of the velocities in time. In analogy to (5.1), the autocorrelation can be calculated as
c(∆t) = 1
n X i → vi,t →
vi,t+∆t, (5.3)
where ∆tis a time interval for which the velocities are compared. Note that eqn. 5.3 refers to the same agent. Formulas (5.1-5.3) provide a variety of interesting visualization possibilities, for instance one can plot various distributions for the population, for the changes in time, etc. In addition, modifying (5.3) so as to calculate the correlation between different individuals provides a measure how one individual follows its neighbors. Plotting this value for the entire populations gives a possibility to pinpoint individuals that are ”leaders” followed by their neighbors [15].
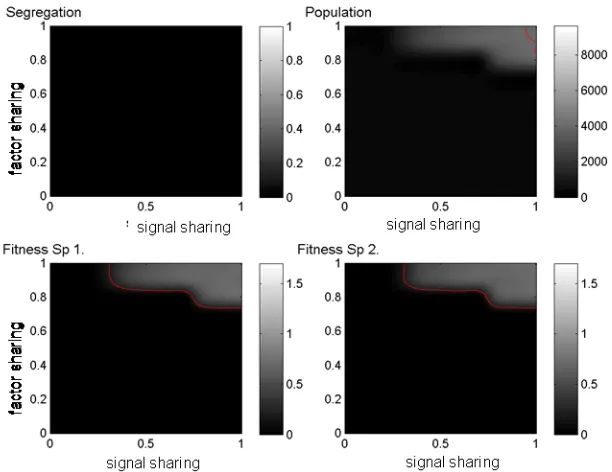
6. Case study: Mutually Dependent Species. An interesting phenomenon in the bacterial world is the existence of mutually dependent species, i.e. species that depend on each other. In the agent based model of quorum sensing, this situation can be pictured as species responding to signal and/or public goods of another species. For instance we can define a sharing coefficient [0,1] that determines the sensitivity of a species towards the signal (or public goods) of another species. If this sharing coefficient is zero, the species respond only to their own signal (and public goods). If the sharing coefficient is 1.00, the species respond only to the signal (and public goods) of the other species in the same way as they respond to their own signal (and public goods). The value of 1.00 thus denotes a situation of mutual communication in terms of signal (or mutual cooperation in terms of public goods).
8. Conclusions. In this paper we presented numerical indices for characterizing the relative fitness and spatial segregation-co-localization properties of agent populations forming multi-species consortia. The agent models used in this work are meant to simulate the growth of quorum sensing bacterial species that are known to form multispecies communities. We showed that the indices can be used to visualize the behavior of such complex communities in terms of simple diagrams such as the heat maps shown in Figure 6.1. The preliminary results presented here suggest that communication and cooperation between species feeding on different nutrients result in co-localizing communities in which the participating species are fitter then when living alone.
Correlated movement of animal species has been investigated in a number of fields. Our results show that self-recognition capabilities may be sufficient for inducing segregation of agent populations. These results are preliminary as the calculations were meant to illustrate the use of the numerical indices and visualization principles described here. More detailed analysis will be carried out in the future to confirm the validity and the scope of these findings.
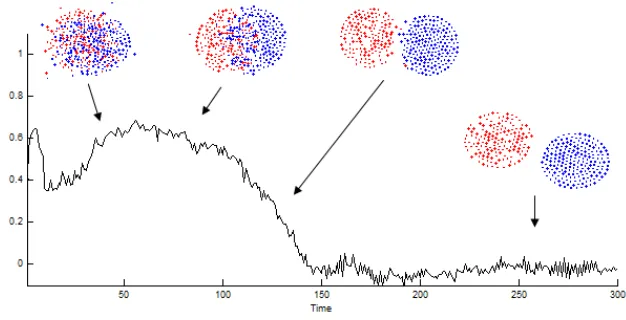
Fig. 7.1: Emergence of correlated movement in spontaneously segregating agent populations. Two randomly moving agent populations, 300 agents each, were put into a random arrangement (inset, left. ), c = 0 should be curly equal sign). With time the population starts to segregate and nonzero c values emerge. At the end, the populations are separated and the c value returns to zero.
9. Acknowledgement. Work at the Szeged Biological Center was partially supported by OTKA grant K. 84335 and T ´AMOP-4.2.2-08/1-2008-0008. D´ora Bihary and Zsolt Gelencs´er are PhD students at Faculty of Information Technology, P´azm´any P´eter Catholic University, Budapest.
REFERENCES
[1] M. B. Miller and B. L. Bassler. Quorum sensing in bacteria.Annu Rev Microbiol, 55:165–99, 2001.
[2] V. Venturi and S. Subramoni. Future research trends in the major chemical language of bacteria.HFSP J, 3(2):105–16, 2009. [3] K. Kawasaki, A. Mochizuki, M. Matsushita, T. Umeda, and N. Shigesada. Modeling spatio-temporal patterns generated by
bacillus subtilis.J Theor Biol, 188(2):177–85, 1997.
[4] E. Ben-Jacob, I. Cohen, O. Shochet, I. Aranson, H. Levine, and L. Tsimring. Complex bacterial patterns. Nature, 373(6515):566–7, 1995.
[5] I. Golding, I Cohen, and E. Ben-Jacob. Spatio-selection in expanding bacterial colonies. Physica A, 1999.
[6] S. Netotea, I. Bertani, L. Steindler, A. Kerenyi, V. Venturi, and S. Pongor. A simple model for the early events of quorum sensing in pseudomonas aeruginosa: modeling bacterial swarming as the movement of an ”activation zone”.Biol Direct, 4:6, 2009.
[7] V. Venturi, I. Bertani, A. Kerenyi, S. Netotea, and S. Pongor. Co-swarming and local collapse: quorum sensing conveys resilience to bacterial communities by localizing cheater mutants in pseudomonas aeruginosa. PLoS One, 5(4):e9998, 2010.
[8] T. Hosni, C. Moretti, G. Devescovi, Z. R. Suarez-Moreno, M. B. Fatmi, C. Guarnaccia, S. Pongor, A. Onofri, R. Buonaurio, and V. Venturi. Sharing of quorum-sensing signals and role of interspecies communities in a bacterial plant disease.ISME J, 5(12):1857–70, 2011.
[9] S. Mitri, J. B. Xavier, and K. R. Foster. Social evolution in multispecies biofilms. Proc Natl Acad Sci U S A, 108 Suppl 2:10839–46, 2011.
[10] C. D. Nadell, K. R. Foster, and J. B. Xavier. Emergence of spatial structure in cell groups and the evolution of cooperation.
PLoS Comput Biol, 6(3):e1000716, 2010.
[11] H. A. Orr. Absolute fitness, relative fitness, and utility. Evolution, 61(12):2997–3000, 2007.
[12] B. J. Alder and T. E. Wainwright. Phase Transition for a Hard Sphere System.The Journal of Chemical Physics, 27(5):1208– 1209, 1957.
[13] Andrea Cavagna, Alessio Cimarelli, Irene Giardina, Giorgio Parisi, Raffaele Santagati, Fabio Stefanini, and Massimiliano Viale. Scale-free correlations in starling flocks.Proceedings of the National Academy of Sciences of the United States of America, 107(26):11865–70, 2010.
[14] Tam´as Vicsek and Anna Zafeiris. Collective motion, arxiv:1010.5017. 2010.
[15] M. Nagy, Z. Akos, D. Biro, and T. Vicsek. Hierarchical group dynamics in pigeon flocks. Nature, 464(7290):890–3, 2010.
Edited by: Dana Petcu and Daniela Zaharie Received: March 1, 2012