Evaluation of Heavy Metals in Surface Water of Patencheru Area,
of Telangana, India
Baby AbrarUnnisa Begum1, Dr. N. Devanna2, Dr P.Ramesh Chandra3, Murugulla Adharvana chari4
1*Associate Professor, Chemistry Department, SWCET, Hyderabad, Telangana, India
2* Professor & Head, Chemistry Department, JNTUA, Anantapuram, A.P, India
3*Retd. Senior Environmental Scientist, Pollution Control Board, A.P, India
4*Dr.MACS Bio-Pharma Pvt Ltd Hyderabad,Telangana, India
Email : 1 [email protected], 2 [email protected], 3[email protected], 4 [email protected]
1. INTRODUCTION:
The heavy metals are the metallic elements of periodic “trace elements”. The important part in the world decades are the heavy metals within the frame work of environmental pollution. The undesirable change in the physical, chemical or biological characteristics of air, water and soil is due to pollution. This pollution may harmfully affect the life or create a potential health hazard to any living organism Chitosan / Sulfydryl – functionalized graphene oxide composite (CS/GO-SH)Synthesized via covalent modification and electrostatic self-assembly was reported by Xueying Li, Haihui Zhou et al. The CS/GO-SH was with multifunctional groups such as AOH, ACOOH, ASH and ANH2 was analyzed. For removal of Cu (II), Pb (II) and Cd (II) in single-and multi-metal ions systems [1] the resulting CS/GO-SH was used as an adsorbent material. [1] The resin loaded magnetic b-cyclodextrin bead and graphene oxide sheet (MCD-GO-R) was synthesized successfully and found to be an excellent adsorbent for Hg (II) removal was reported by Limei Cui et al. 88.43 mg g-1 at 323 K and pH 7.1 was the maximum adsorption capacity. In a wide range from 4.0 to 10.0 the as prepared adsorbent could perform well. It was proved that the contaminant adsorption was accomplished mainly via chelation or ionic exchange and come to equilibrium in only 30 min [2] The preparation of phosphate-functionalized graphene oxide (PGO) was by grafting triethyl phosphate onto the surface of GO using Arbuzov reaction was the study of Xia Liu .For the removal of U(VI) from the aqueous solution was investigated with a maximum adsorption capacity of 251.7 mg/g at pH ¼ 4.0 ± 0.1 and T ¼ 303 K was the application of the PGO. Due to the experimental results they have been given better removal efficiency towards U (VI) on PGO surface than other heavy metal ions at acidic solution which indicates the selective extraction of U(VI) from environmental pollutants [3]. The analysation of Mansoor Khan et al was that the magnetic allylamine modified grapheneoxide-poly (vinyl acetate-co-divinylbenzene)(MGO-DVB-VA) was synthesized and used for the extraction of magnetic solid phase of Pb(II), Cd(II), Cu(II), Ni(II) and Co(II) firstly to their determination by flame atomic absorption spectroscopy. For all the metals the per concentration factor (PF) is 40 and detection limitations for Pb, Cd, Cu, Ni and Co are in the range of 0.37-2.39 mgL-1 and the relative standard deviation is below 3.1%. The comparison of the recovery percent of analytes by using magnetic allylamine modified graphene oxide-poly (vinyl acetate-co-divinylbenzene) was with the magnetic grapheneoxide .The recovery percent of Ni (II), Cd(II) and Co(II) ions were found as 86%, 90%, and 85% when we use the magnetic graphene oxide as adsorbent.[4]In graphene oxide (GO) colloids Multi-walled carbon nanotubes (MCNTs) were dispersed and to be further functionalized with
Abstract: To eliminate the unwanted pollution from the atmosphere heavy metal analysis is the most promising
tool. The number of heavy metals is present in sea water. The reason to find the new removal techniques is the assessment of this analysis will be useful to detect the unwanted heavy metals. The heavy metals present in the surface area of Patencheru are 26Fe, 82Pb, 30Zn, 25Mn, 29Cu, 48Cd, 33As and 23V the Atomic Absorption Spectroscopy technique (AAS) detected this metals in the water. The analysis of water has achieved for one year of December 2012 to December 2016 has been recorded when the water level is lower or higher respectively. The data collected from two states of Patencheru area, Telangana, India given by the AAS measurements in equal intervals of three months for four times. Water samples were collected from the year December 2012 to December 2016.A particular wavelength and type of flame was used by the AAS analysis technique for each metallic element. For each heavy cation in water has been recorded the value either it is high or low. According to the AAS it indicates that the highest value is observed for As (3.250 mg/L) (Station A2) and lowest value is for Cd (0.015 mg/L) in December 2016 (Station A1).
diethylenetriamine (DETA) was reported by Xiang Bing Zhu et al. which results in GO– MCNTs–DETA nanocomposites for the solid-phase extraction and analysis of Cr(III), Fe(III), Pb(II), and Mn(II) ions at the trace levels in waste water. The coupled plasma optical emission spectrometry (ICP-OES) indicated that this new solid phase sorbent could facilitate these capacities 5.4, 13.8, 6.6 and 9.5 mg g-1 as the maximum static adsorption capacities for Cr(III), Fe(III), Pb(II), and Mn(II) ions, respectively showing 95%within about 30 min as the adsorption capacity.[5].
2. Assessment of Heavy Metals in Surface Water of Patencheru, Telangana, India :
The intense attraction of multidisciplinary study by their special physicochemical properties and their possible applications this was reported from the studies of Xiangxue Wang et al .For the removal of Pb(II) ions from aqueous solution GOs are to be applied and Pb(II) is strongly dependent on pH for sorption and for the formation of strong surface complexes the sorption of Pb(II) is mainly attributed.[6] A new approach to prepare polyimide (PI) – based on amino composites containing amino groups functionalized graphene oxide (GO-NH2) via in situ polymerization and thermal imidization.GO-NH2 the excellent dispersibility is exhibited by nanosheets and PI matrix contains compatibility were successfully obtained through the chemical reaction between graphene oxide (GO) and p-phenylenediamine (PDA). This was the study by Chunyan Wang et al. [7].For the removal of Cu2+, Cd2+ and Ni2+ from aqueous solutions is through adsorbents of highly ordered layered graphene oxide (GO) membrane with larger interlayer spacing were prepared by induced directional flow. The results declared that the adsorption of Cu2+, Cd2+ and Ni2+ onto GO membrane was greatly influenced by the pH and the ionic strength had weekly affected. 72.6, 83.8 and 62.3 mg/g are the approximately values of maximum adsorption capacities of the GO membrane for Cu2+, Cd2+ and Ni2+ was reported by Ping Tan et al.[8] The samples of food and water were investigated because the studies explained that a new, sensitive and simple solid phase extraction (SPE), heavy metal ions Cd (II), Cu (II), Ni (II), Pb (II) and Zn (II) at trace levels using multiwalled carbon nanotubes (MWCNTs) saturated with 2-(2-benzothiazolylazo) orcinol (BTAO). This was taken from food and water and then investigated. At the pH 7.0 the metals retained the naotubes and were eluted by 5.0ml, HNO3 (2.0 mol L-1) 0.70, 1.2, 0.80, 2.6 and 2.2lg L-1 are the detection limitations (LODs) for Cd(II), Cu(II), Ni(II), Pb(II) and Zn(II). This was the study of Ayman A Gouda et al. [9]. The behavior adsorption of a range of metals onto multilayered graphene oxide (GO) as a function of pH and metal. The measurement of GO ratio is taken. There is an order that GO exhibited an affinity for the metals. Pb (II) > Cu (II) > Cd (II) ≈Ni (II) ≈Zn (II) > Sr (II) ≈Ca (II) Non electrostatic surface complexation model is the four discrete site used to account for the observed adsorption behavior. In EDTA free solution it is been predicted extent of Nd adsorption onto GO is within 3% of the measured extent of Nd adsorption behavior with increasing EDTA concentration is also in reasonable agreement with the measurements.[10]. Arsenic, Lead, Cadmium, Mercury and Selenium are few metals which are highly toxic even in minor amounts. In this document or page, the heavy cations like iron (26Fe), lead (82Pb), zinc (30Zn), manganese (25Mn), copper (29Cu), cadmium (48Cd), arsenic (33As) and vanadium (23V) are detected and their amounts (mg/L) in between the year periods December 2012 to December 2016 from surface area seashore area water are measured. The time period has been selected because the surface water, Patencheru, Telangana, Hyderabad district, there is low in April and high in December. They has been no previously reported about the surface water area of Patencheru up to our knowledge no work on heavy metals detection has been taken place in this area. [11]. The present study was conducted to evaluate the risk to human health by heavy metals (Cd, Cu, Pb, Zn, Ni and Cr) because of the intake of locally grown vegetables, cereal crops and milk from this polluted water irrigated site. There is a connection between the surface water of Patencheru seashore to backwater of sea. Then the waste water of which are polluted will be flowing through the surface of Patencheru landside. Not only the surface area water is been contaminated due to waste water irrigation, but is the important route for entering the heavy metals is from grass to animals. In all the collected samples heavy metal concentrations were several folds higher from waste water irrigated site compared to clean water irrigated ones. Some metals have crossed the limits given by India and WHO/FAO standards that are Cd, Pb and Ni in all the vegetables and cereals but it was in the permissible limits in surface water. As the increasing values of metal pollution index and health risk index presented that heavy metal contamination in the waste water irrigation site. The presented a significant threat of negative impact on human health. Because of higher concentration of cereals in the diet the human health is greater as rice and wheat grains contain less heavy metal. Due to the surface water of seashore converted as waste water irrigation which leads to the accumulation of heavy metals in the seashore area stuff causing potential health risk for consumers was the study by reporters.
3. Experimental Section:
The majority of free atoms in the commonly used flames are in the ground state in atomic absorption spectroscopy. The narrow spectral line is been emitted by a light source which ahs the characteristic frequency which is used to excite the free atom into there is a decrease in energy of the light Lambert-Beer’s Law stated that the absorbance is directly proportional to the concentration of free atoms in the flame
Ab = Log I0
= kCl (1)
It
Where, Ab stands for absorbance, Io stands for intensity of incident radiation emitted by the light source, It stands for transmitted radiation (amount not absorbed), C stands for concentration of sample (free atoms), k stands for a constant (molar extinction coefficient) can be determined experimentally and l is the path length. The interference
Where, Ab is the absorbance, Io is the intensity of incident radiation emitted by the light source, It is the intensity of transmitted radiation (amount not absorbed), C is the concentration of sample (free atoms), k is a constant (molar extinction coefficient) can be determined experimentally and l is the path length. This is the most common method where interference effects are known to be absent. Usually at least three standards and a blank are used to cover the range of 0.1 to 0.8 absorbance. The blank solution is used to calibrate the instrument. The standards are then analysed with the lowest concentration first, and the blank run between standards, to ensure that the baseline (zero point) has not changed. Samples are then analysed and their absorbance recorded. A graph of absorbance versus concentration is plotted. The calibration can be performed in the concentration mode in which case the concentration of the sample is read off directly. In atomic absorption spectroscopy the wavelength (nm) and flame type for different heavy metals are listed in Table 1 [10,11].
4. Results and Discussion:
Sample collection
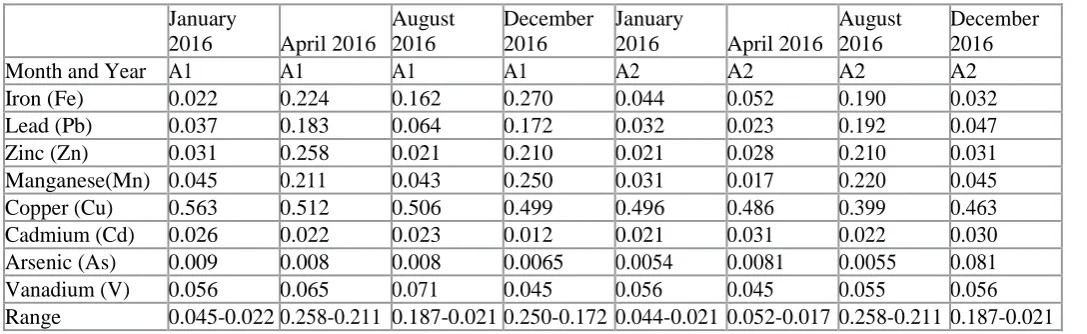
The heavy metals analysis was performed for surface water samples (mainly for two stations A1 and A2) collected. Water samples were examined to detect and to estimate the concentration of heavy metals. Water samples were collected four times in a year from January 2016 to December 2016. For each metallic element, AAS analysis technique used a special wavelength (nm) within the 190-320 nm range and type of flame as indicated in Table 1. Heavy metallic cation amounts, in mg/L, are detected in surface water stretch as listed below (Tables 2a-2h)
Table 1: The element, wavelength and type of flame.
January
2016 April 2016
August 2016
December 2016
January
2016 April 2016
August 2016
December 2016
Month and Year A1 A1 A1 A1 A2 A2 A2 A2
Iron (Fe) 0.022 0.224 0.162 0.270 0.044 0.052 0.190 0.032
Lead (Pb) 0.037 0.183 0.064 0.172 0.032 0.023 0.192 0.047
Zinc (Zn) 0.031 0.258 0.021 0.210 0.021 0.028 0.210 0.031
Manganese(Mn) 0.045 0.211 0.043 0.250 0.031 0.017 0.220 0.045
Copper (Cu) 0.563 0.512 0.506 0.499 0.496 0.486 0.399 0.463
Cadmium (Cd) 0.026 0.022 0.023 0.012 0.021 0.031 0.022 0.030
Arsenic (As) 0.009 0.008 0.008 0.0065 0.0054 0.0081 0.0055 0.081
Vanadium (V) 0.056 0.065 0.071 0.045 0.056 0.045 0.055 0.056
Range 0.045-0.022 0.258-0.211 0.187-0.021 0.250-0.172 0.044-0.021 0.052-0.017 0.258-0.211 0.187-0.021
Table 2a: Arsenic is converted to its hydride and aspirated into argon-hydrogenflame.
Element Wavelength (nm) Type of Flame
Iron (Fe) 248.3 Air-Acetylene
Lead (Pb) 283.3 Air-Acetylene
Zinc (Zn) 213.9 Air-Acetylene
Manganese(Mn) 279.5 Air-Acetylene Copper (Cu) 324.7 Air-Acetylene Cadmium (Cd) 228.8 Air-Acetylene Arsenic (As) 193.7 Argon-Hydrogen
Table 2b: Lead in mg/L of surface water area stretchat two stations A1 and A2.
Month and Year A1 A2
January 2016 0.255 0.215
May 2016 0.319 0.233
August 2016 0.315 0.199
December 2016 0.310 0.258
Range 0.319-0310 0.258-0.199
Table 2c: Zinc in mg/L of surface water Patencheruarea stretchat two stations A1 and A2.
Month and Year A1 A2
January 2016 0.128 0.096
April 2016 0.134 0.112
August 2016 0.139 0.124
December 2016 0.130 0.121
Range 0.139-0.128 0.124-0.096
Table 2d: Manganese in mg/L of surface water Patencheruareastretch at two stations A1 and A2.
Month and Year A1 A2
January 2016 0.119 0.120
April 2016 0.125 0.129
August 2016 0.099 0.101
December 2016 0.121 0.127
Range 0.099-0.125 0.101-0.129
Table 2e: Copper in mg/L of surface water Patencheruareastretch at two stations A1 and A2.
Month and Year A1 A2
January 2016 0.129 0.054
April 2016 0.121 0.059
August 2016 0.124 0.072
December 2016 0.126 0.081
Range 0.129-0.121 0.081-0.054
Table 2f: Cadmium in mg/L of surface water Patencheruareastretch at two stations A1 and A2.
Month and Year A1 A2
January 2016 0.019 0.027
April 2016 0.022 0.031
August 2016 0.032 0.037
December 2016 0.025 0.025
Range 0.022-0.032 0.037-0.025
Table 2g: Arsenic in mg/L of surface water Patencheruareastretch at two stations A1 and A2.
Month and Year A1 A2
January 2016 2.012 1.041
April 2016 2.780 1.820
August 2016 2.580 0.994
December 2016 2.824 1.210
Range 2.824-2.012 1.820-0.994
Table 2h: Vanadium in mg/L of surface water Patencheruareastretch at two stations A1 and A2.
Month and Year A1 A2
April 2016 0.924 1.410
August 2016 1.281 1.962
December 2016 1.108 0.941
Range 1.210-0.924 1.410-0.941
And explained by the bar chart of Figures 1a-1g. The Figure 2 displays the high (left) and low (right) value of metallic concentration in water for each heavy metal [12].
Iron (Fe): The high value of iron 0.258 mg/L is observed at A1 andA2 in May 2016 and the low value is 0.017 mg/L at A1 and A2 in August 2016. The maximum permissible limit is 0.3 mg/L. It is observed that the values are slightly higher than in summer. The high value in summer may be due to the industrial waste water exposed to the water system and high concentration of industrial effluent and domestic sewages. The concentration of metals in the surface of a river may increase according to the effluent discharged from nearby industries [13].Lead (Pb): The high value of lead 0.319 mg/L is observed at A1 and A2 stations Surface water in equal four months in one year at two stations stretch. The maximum permissible limit of lead is 0.1 mg/L. In our present study A1 and A2 show higher value than the permissible limit. The lead pollution on the surface water may be the result of discharge of effluents, old plumbing, house hold sewages, agricultural runoff containing phosphatic fertilizers and human and animal excreta. Presence of lead in phosphatic fertilizers has been revealed [6].
Figure 2a: Lead in mg/L of surface water Patencheruareastretch at two stations A1 and A2.
A1 A2
350 300 250 200
(mg/L) 150
100
Lead 50
0
December 2016
August 2016 C
May 2016
Month
B January 2016
Figure 2b:
Zinc in mg/L of surface water Patencheruarea
stretch at two stations A1 and A2.
A1 A2
0.14
0.13
(mg/L) 0.12
0.11
Zinc 0.10
December 2016
0.09
August 2016 C
April 2016
Month
Figure 2c: Manganese in mg/L of surface water Patencheruarea stretch at two stations A1 and A2.
A1
A2
0.130
0.125
0.120
0.115
(mg/L)
0.110
0.105
Mg
0.100
December 2016
0.095
August 2016 C
April 2016 Month
January 2016 B
Figure 2d:
Copper in mg/L of surface water Patencheruarea
stretch at two stations A1 and A2.
A1 A2
Figure 2e:
Cadmium in mg/L of surface water Patencheruarea
stretch at two stations A1 and A2.
A1 A2
0.038 0.036 0.034 0.032
(mg /L)
0.030 0.028
0.026 Cadmium
0.018
0.024 0.022 0.020
December 2016
August 2016 C
April 2016 Month
January 2016 B
0.13
0.12
0.11
(mg/L) 0.10
0.09
0.08 Copper
0.06
0.07
December 2016
0.05
August 2016 C
April 2016
Month
Figure 2f:
Arsenic in mg/L of surface water Patencheruarea
stretch at two stations A1 and A2.
A1 A2 3.0 2.8 2.6 2.4 (mg /L) 2.2 2.0 Arsenic 1.8 1.2 1.6 1.4 1.0 December 2016August 2016 C
April 2016
Month
January 2016 B
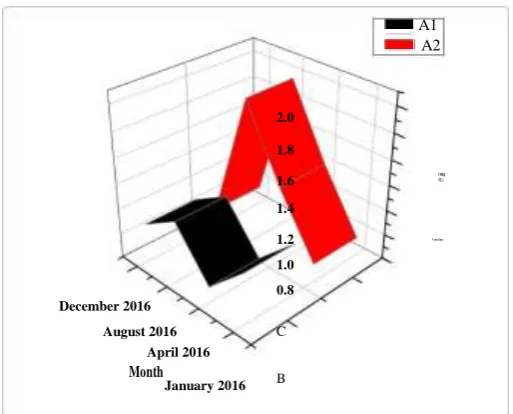
Figure 2g: Vanadium in mg/L of surface water Patencheruarea stretch at two stations A1 and A2.
A1 A2 2.0 1.8 (mg /L) 1.6 1.4
Vana di um
1.2
1.0
December 2016
0.8
August 2016 C
April 2016
Month
January 2016 B
Figure 2h H ig h va lu eo fc on ce n tr at io n (m g/ L )
1,0 (m
g/ L )c on cen tr ati on of va lu eL o w 0 0,8 3
0,6 2 0,4 1 0,2
0,0
Fe Pb Zn Mn Cu Cd As V
High (left) and low (right) value of metallic concentration in water for each heavy metal surface water Patencheruarea stretch at two stations A1 and A2.
Due to the complex formation with organic materials during the passage through the soil the values may be low at particular stations.[14].
Zinc (Zn): 0.139mg/L is the high value of Zinc noticed at A1 during May 2016 and 0.031 is the low value of Zinc
noticed at A2 in the month of August 2016. 5mg/L is the maximum permissible limit. In all the stations the value of Zinc is below than the permissible limits the present study says this. In summer the value of Zinc is higher than in monsoon .Agricultural runoff, domestic waste discharge and the industrial effluents may be the reasons for high value of Zinc in summer [15]. 250mg/kg is the approximate concentration of Zinc occuration in dry solids of faces [16]. The another reason for high value of Zinc is people using the river bed as open toilet .Vomiting, renal damage and cramps may be due to Zinc as it is a toxic . The presences of Zinc above its permissible limit are unacceptable in water used for drinking purpose [17].
Manganese (Mn): 0.156mg/L is the high value of Manganese found at A1 in the month of May 2016 and 0.042mg/L
is the low value noticed atA2 in the month of August 2016. 0.1mg/L is the maximum permissible limit. The permissible limit is higher in at station A6 than the manganese value this is the present study. The values of manganese are higher in monsoon than in summer. Flushing action of the rain may be the reason for high value of manganese.[18]. The presences of manganese in water are as a soluble divalent ion. Manganese is non- toxic to animals but is objectionable and tenacious stains to laundry and plumbing fixtures. For domestic purpose it is not suitable.[19] The reasons for increasing value of manganese may be due to the influence of industrial effluents and domestic sewage entering into the river system.
Copper (Cu): 0.129mg/L is the high value of Copper observed at A1 in the month of May 2016 and 0.019mg/L is the
low value observed at A2 in the month of August 2016. 1.0mg/L is the maximum permissible limit. In all the stations the value of Copper is lower than the permissible limit according to our present study. The essential element for the living system is Copper which is widely distributed. Copper is also used for bioactivity of living system. Copper is considered as the pollutant because of its higher value. In summer it is noticed that the value of Copper increases. The reason for this may be sewage of domestic and agricultural inputs [20]. The low value of copper may be the result of adsorption process by the soil reduces the concentration of the heavy metals in water.
Cadmium (Cd):0.037 is the high value of Cadmium observed at A1 in May 2016 and 0.015 mg/L is the low value
observed at A2 in the month of August 2016. 0.01mg/L is the maximum permissible limit of Cadmium. Due to pollution the value is been observed higher than the permissible limit. Because of its toxicity and accumulation capacity in the living system Cadmium is to be considered hazardous metal [21].
Arsenic (As): 3.250mg/L is the high value for Arsenic observed at A1 in the month of May 2016 and 0.562 mg/L is
the low value observed at A2 in the month of August 2016.0.2mg/L is the maximum permissible limit of Arsenic. Due to the application of arsenic in the form of herbicides, insecticides and fungicides in the agricultural lands which may be thrown to the river by runoff the values of Arsenic are higher. Arsenic is biologically essential and toxic like cadmium. The protein complexation with enzymes and uncoupling of phosphorylation is due t the arsenic.[22] Most of the Arsenic compounds are water soluble and therefore its concentration of water can occur readily.
Vanadium (V): 1.992 mg/L is the high value of Vanadium noticed at A1 in the month of May 2016 and 0.858 mg/L
is the low value noticed at A2 in the month of August 2016 as shown in the figure 2. 7mg/L is the maximum permissible limit of vanadium. There is the increase in the value in the summer not in monsoon. It may be due to the low flow rate of river water coupled with high temperature increases the concentration of heavy metals which are fed into the river through untreated sewage, automobile wastes, electroplating units etc. [23].
5. Conclusion:
due to the adsorption process by the soil. Cadmium concentration is found to be high than the permissible limit almost in all stations. The high value may be due to the usage of herbicides, insecticides and fungicides etc. Vanadium concentration is observed below than the permissible limit. The value is found to be higher in summer than in monsoon. It may be due to the low flow rate of river water in summer coupled with high temperature. The high value is due to the untreated sewage, waste from automobile workshop, electroplating units etc.
REFERENCES:
1. Xueying L, Zhou H, Wenqin W, Shudan W, Yan X, et al. (2015) Studies of heavy metal ion adsorption on Chitosan/Sulfy drylfunctionalized graphene oxide composites. Journal of Colloid and Interface Science 448: 389-397.
2. Cui L, Wang Y, Gao L, Hu L, Wei Q, et al. (2015) Removal of Hg(II) from aqueous solution by resin loaded magnetic b-cyclodextrin bead and graphene oxide sheet: Synthesis, adsorption mechanism and separation properties. Journal of Colloid and Interface Science 456: 42-49.
3. Liu X, Li J, Wang X, Chen C, Wang X (2015) High performance of phosphate-functionalized graphene oxide for the selective adsorption of U(VI) from acidic solution. Journal of Nuclear Materials 466: 56-64.
4. Khan M, Yilmaz E, Sevinc E, Sahmetlioglu E, Shah J, et al. (2016) Preparation and characterization of magnetic allylamine modified grapheneoxide-poly
5. (vinylacetate-co-divinylbenzene) nanocomposite for vortex assisted magnetic solid phase extraction of some metalions. Talanta146: 130-137.
6. Zhu X, Cui Y, Chang X, Wang H (2016) Reported that, Selective solid-phase extraction and analysis of trace-level Cr(III)Fe(III)Pb(II)and Mn(II) Ions in wastewater using diethylenetriamine-functionalized carbon nanotubes dispersed in graphene oxide colloids. Talanta 146: 358-363.
7. Wang X, Chen Z, Yang S (2015) Application of graphene oxides for the removal of Pb(II) ions from aqueous solutions: Experimental and DFT calculation. Journal of Molecular Liquids 211: 957-964.
8. Wang C, Lan Y, Yu W, Li X, Qian Y, et al. (2016) Preparation of amino-functionalized graphene oxide/polyimidecomposite films with improved mechanical, thermal and hydrophobicproperties. Applied Surface Science 362:11-19.
9. Tan P, Sun J, Hu Y, Fang Z, Bi Q (2015) Adsorption of Cu2+, Cd2+ and Ni2+ from aqueous single metal solutions on graphene oxide membranes. Journal of Hazardous Materials 297: 251-260.
10. Gouda AA, Sheikha M, Ghannam A (2016) Impregnated multiwalled carbon nanotubes as efficient sorbent for the solid phase extraction of trace amounts of heavy metal ions in food and water samples. Food Chemistry 202: 409-416.
11. Dungang G, Fein JB (2015) Adsorption of metals onto graphene oxide: Surface complexation modeling and linear free energy relationships Colloids and Surfaces A: Physicochem. Eng. Aspects 481: 319-327.
12. Chauhan A (1991) Effect of distillery effluent on River Wainganga. Indian J. Environ Hllth 33: 203-207. 13. Le ETI, Chevallier MW, Waarvick CE, Seidler RJ (1981) Coliform species recovered from untreated surface
water and drinking water by the membrane filter, standard, and modified most-probable-number techniques. Applied and environmental microbiology 41: 657-663.
14. Friberg L, Vahter M (1983) Assessment of exposure to lead and cadmium through biological monitoring: results of a UNEP/WHO global study. Environmental research, 30: 95-128.
15. Gurugnanam B, Suganya M, Sekhar S (2007) Ground water quality studies in Thirumanimuthar sub basin, Salem District, Tamilnadu. Eco-chronicle 2: 27-32.
16. Harikumar PS, Ramani KN (1998) “Water quality problems of Tamilnadu”. Water scenario of Tamilnadu. The state committee on science, Technology and Environment, Thiruvananthapuram.
17. Islam SR, Gyanananth G (2002) Seasonal variations in the ground water quality in Nanded district, India. Env & Eco 20: 24-529.
18. Jayaraman PR, Devi GT, Nayar TV (2003) Water quality studies on Karamana River, Thiruvananthapuram District and South Kerala. India. Poll. Res 22: 89-100.
19. Kaushik S, Sahu BK, Lawania RK, Tiwari RK (1999) Occurrence of heavy metals in lentic water of Gwalior region. Poll Res 18: 137-140.
20. Khurshid S, Zaheeruddin (2000) Heavy metal pollution and its toxic effect on water quality in parts of Hindon River Basin. Indian J Env Prot 20: 401-406.
21. Mullick S, Konar SK (1996) Disposal of heavy metals and petroleum products in water. Poll Res 15: 223-225. 22. Singh O, KumarV, Raj SP (2005) Water quality Aspects of some wells, rivers and springs in part of the
Udhempur District (U&K). Journal of Environmental and Engineering 47: 25-32.