*Corresponding author: Amanpreet Kaur, Parveen Bala
ISSN: 0976-3031
Research Article
ELECTROSTATIC SOLITARY POTENTIAL STRUCTURES IN FOUR COMPONENT DUSTY
PLASMA WITH KAPPA DISTRIBUTED ELECTRONS AND IONS
Amanpreet Kaur, Parveen Bala* and Harmandeep Singh
Department of Mathematics, Statistics and Physics, Punjab Agricultural University,
Ludhiana, India-141004
DOI: http://dx.doi.org/10.24327/ijrsr.2018.0901.1418
ARTICLE INFO ABSTRACT
The properties of solitary waves have been investigated theoretically in unmagnetized dusty plasma consisting of positively and negatively charged dust with kappa distributed electrons and ions. The Korteweg-de Vries (K-dV) equation governing the dynamics of given plasma system has been derived using reductive perturbation method. The soliton solution derived for the K-dV equation is
of the sech2 form. Slow and fast modes are found to exist in the present plasma system in which both
compressive and rarefactive solitons exist. The effects of the dusty plasma parameters and kappa parameters on the dynamics of these solitons in both modes are discussed numerically. The results are displayed graphically for the given set of parameters. The results obtained from this investigation would be useful in understanding the properties of nonlinear solitary waves in laboratory and in space dusty plasmas.
INTRODUCTION
Dusty plasmas play important role in space, astrophysical and laboratory environments. They have opened up a completely new and fascinating research area, on account of their vital applications in understanding various collective processes in space environments (Horanyi and Mendis, 1985; Goertz, 1989; Bouchule, 1999; Verheest, 2000; Verheest, 1996; Shukla, 2001; Mendis and Rosenberg, 1994; Shukla and Mamun, 2000) and laboratory devices (Barkan et al, 1995; Merlino et al, 1998; Homann et al, 1997). Dusty plasmas also play significant role in low temperature physics, radio frequency plasma discharge (Chu et al, 1994), coating and etching of thin films (Selwyn, 1993), plasma crystals (Thomas et al, 1994) etc. In dusty plasma, the charged particles being in random motion interact with each other through their own electromagnetic forces and also respond to externally applied perturbations. Numerous instabilities are present in plasma when the amplitude of rising perturbations is small. While at huge amplitude, the linearization process breaks down. Thus dusty plasma is inherently a nonlinear medium where a great variety of nonlinear wave phenomena like solitons, shocks and vortices arise. Solitary wave is a nonlinear wave which maintains its shape during its propagation. It’s formation takes place because
of balance between the effects of the nonlinearity and the dispersion. The theoretical and experimental study of solitary waves in dusty plasma is done by many researchers and scholars. Rao et al (1990) were the first to study the existence of dust-acoustic waves (DAWs) and Barkan et al (1995) gave the experimental verification of them. Dust grains in dusty plasma are usually of negatively charged because of the propagation of ions and electron currents on their surfaces. Dusty plasmas containing grains of opposite polarity had been studied theoretically (Sakanka and Shukla, 2000; Angelo, 2001; Angelo, 2002; Mamun and Shukla, 2002; Sayad and Mamun, 2007) and experimentally (Horanyi et al, 1993; Mendis and Rosenberg, 1994; Horanyi, 1996; Mendis, 2002) by many authors. Mamun et al (1996) studied dusty plasma with Boltzmann distributed ions and inertial dust fluid. They found only negative solitary potentials linked with nonlinear dust-acoustic waves. They also found that the potential polarity of the dust-acoustic solitons is different from the normal ion-acoustic solitons in electron-ion plasma. Dust-ion-acoustic solitary waves in the one-dimensional and unmagnetized plasma have also been investigated by Mahmood and Saleem (2003). Chow et al (1993) explained the situations under which smaller dust particles become positively charged and larger particles become negatively charged. The properties of dust acoustic
Recent Scientific
Research
International Journal of Recent Scientific Research
Vol. 9, Issue, 1(E), pp. 23201-23207, January, 2018
Copyright © Amanpreet Kaur, Parveen Bala and Harmandeep Singh, 2018, this is an open-access article distributed under the terms of the Creative Commons Attribution License, which permits unrestricted use, distribution and reproduction in any medium, provided the original work is properly cited.
DOI: 10.24327/IJRSR
CODEN: IJRSFP (USA)
Article History:
Received 17th October, 2017
Received in revised form 21st
November, 2017
Accepted 05th December, 2017
Published online 28th January, 2018
Key Words:
Distributed Electrons And Ions
solitary waves in warm dusty plasma were studied by Pakzad (2011). It was found that both compressive and rarefactive solitons in warm dusty plasma can be propagated.
For the first time, Kappa velocity distributions functions were given by Vasyliunas (1968) for electrons in the magnetosphere as measured by satellites OGO 1 and OGO 3. The isotropic three-dimensional (3D) kappa velocity distribution of particles of mass m is of the form
1
2 2
2
1
2
1
1
v
v
F
kWhere θ is the most probable speed related to the usual thermal velocity
12m T K
Vt B by
2
3
V
t, T being the characteristic kinetic temperature, i.e., the temperature of the equivalent Maxwellian with the same average kinetic energy and KB is the Boltzmann constant. The kappa distribution isdefined for κ > 3/2. The κ is the spectral index, which is measure of the slope of energy spectrum of the superthermal particles forming the tail of velocity distribution function and, thus allows for a family of power law like distribution. The kappa distribution provides alternate for the Maxwell distribution. Low values of κ represent hard spectrum with a strong non-Maxwellian (power law - like) tail, an enhanced velocity distribution at low speeds and a depressed distribution is recovered. Rahmann (2017) investigated the dust ion acoustic solitary and shock waves in unmagnetized dusty plasma with kappa distributed superthermal electrons. It was found that the presence of stationary dust particles and superthermality of electrons play important role in changing the phase speed, amplitude and width of solitary and shock waves. Alam et al (2013) have studied the effect of bi-kappa distributed electrons on the nonlinear propagation of dust ion acoustic (DIA) shock waves in dusty superthermal plasmas. They have investigated the effects of ion kinematic viscosity and the superthermal two temperature electrons. Dust acoustic double layers in a four component dusty plasma have been studied studied by Mandal et al (2009). Roychoudhury and Mukherjee (1997) showed that, finite dust temperature has major role for determining the region for the existence of nonlinear solitary waves. Because of orbital effects or thermalization with the ions, the dust has temperature in dusty plasma.
In this paper, the dynamics of electrostatic solitary potential structures is studied in plasma system consisting of positively charged warm adiabatic dust and negatively charged cold dust with ions and electrons obeying kappa distribution. Regarding the organization of the paper, basic equations of theoretical model and derivation of K-dV equation associated to solitary structures, discussion of numerical results and conclusion are presented.
Basic Equations And Derivation Of K-dV Equation
Let us consider four component weakly coupled unmagnetized dusty plasma made of positively charged warm adiabatic dust and negatively charged cold dust with both kappa distributed ions and electrons have been considered here. The basic set of normalized fluid equations describes the propagation of solitary waves in such dusty plasma system (Gill et al, 2011).
For negative dust
0
)
(
1 11
x
U
N
t
N
(1)x
x
U
U
t
U
1
1 1
(2)
For positive dust
0
)
(
2 22
x
U
N
t
N
(3)
x
P
N
x
x
U
U
t
U
d 22 2
2
2
(4)and
0
3
2 2 2 2 2
x
U
P
x
P
U
t
P
(5) Poisson equation i i ee
n
n
N
N
x
2 2 1 2 2 (6) Where N1 and N2 are the negatively charged and positivelycharged dust number densities normalized by the equilibrium values n10 and n20 respectively. U1 and U2are negative and
positive dust fluid speed normalized by
C
1
Z
1k
BT
im
1
12, Ψ is the wave potential which is normalized bye
T
k
B iand
dust density ratio
2 1 1 2
m
Z
m
Z
. P2 is the thermal pressure ofpositive dust fluid normalized by its equilibrium value n20kBTd.
Dust temperature ratio
i d d
T
Z
T
2
, electron density10 1 0
n
Z
n
e e
, ion density10 1 0
n
Z
n
i i
ande i
T
T
. WherekB is the Boltzmann constant, e is the charge on electron; Z1 and
Z2 are the number of electrons and protons residing on a
negative and positive dust; m1and m2 are the mass of negative
and positive dust particle; Td , Ti , Te are temperature of positive
Where p = 1 for ion density & κiand κearecalled kappa indices
of ions and electrons respectively. Linearizing the equations (1) – (6), we get the dispersion relation in terms of ω and k, as given below
1
1 2
1 2
1 2
2 2
2
12 ) 3 1
( 3
1
c
c c
c
k d d d
(8)
Where
c
1
b
1
i
a
1
e
k
2Clearly we get two roots of ω that correspond to fast and slow modes. To study the effect of propagation constant on the carrier wave frequency of both modes, we have plotted carrier wave frequency (ω) as a function of propagation constant (k) for different values of kappa indices of ions (κi) and electrons
(κe) (Fig 1 and Fig 2). Here different values of kappa indices of
ions (κi) and electrons (κe) are taken as κi = 2, 3, 5 (Fig 1) and
κe =2, 3, 5 (Fig 2). The different parameters are taken as μi =
0.8, μe = 0.2, σ = 0.5, σd = 0.001 and α = 2. From these Figures,
it is observed that for fast mode, the carrier wave frequency increase with increase in spectral indices of ions (κi) and
electrons (κe) but for slow mode, it remains constant. This
behaviour of carrier wave frequency for distribution parameter is exact similar to that observed by Bains et al (2013). Thus the propagation characteristics of the fast solitary potential structures are affected by kappa distribution of particles, while slow potential structures have no effect of kappa distribution.
To investigate the behavior of solitary waves in dusty plasma, we employ reductive perturbation method. According to this method, we use stretched coordinates given by Gardner and Morikawa (1960) [38] (using α = 1/2) as 2
t
3
and)
(
2 1
t
x
Where λ is the wave phase velocity and ε is a small parameter. The dependent variables are expended as
1
) ( 1 0
n
n n
S
S
S
(9)
Where S = N1, N2, P2, U1,U2, Ψ and S0 =1, 1, 1, 0, 0, 0 using
stretched coordinates and perturbation expression (9) the poisson equation gives the following dispersion relation
2
2 2
2 2
2 2
2
2
12 3
1 ) 3 1
(
c
c c
c d d
d
(10)
The dispersion relation (10) is the phase velocity (λ) of solitary potential structures. λ with positive sign represents phase velocity of fast mode (λf ) and with negative sign represents the
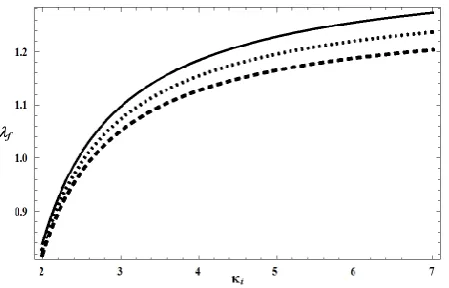
phase velocity of slow mode (λs) respectively. The variation of
the phase velocity of fast mode (λf) with the spectral indices of
ions (κi) and electrons (κe) for different values of ion to electron
temperature ratio (σ) are explored (Fig 3 and Fig 4). The other parameters are taken as μi= 0.8, μe= 0.2, κe=3, σd = 0.001 and
α =2 for three different values of σ = 0.5, 0.7, 0.9. For given value of σ, the phase velocity of fast mode increases with the increase in spectral indices of ions (κi) and electrons (κe). This
behaviour of phase velocity for kappa index of electrons is similar to that observed by Alam et al (2014). It can be said that spectral indices (κi and κe) play an important role on the
phase velocity of solitary waves. For given values of spectral indices of ions (κi) and electrons (κe), the increase in ion to
electron temperature ratio (σ) causes the decrease in phase velocity of fast mode.
Figure 1 Variation of carrier wave frequency (ω) with propagation
constant (k) for fast and slow mode for three different values ofκi = 2
(solid line), κi= 3 (dotted line), κi = 5 (dashed line) with μi= 0.8, μe = 0.2,
κe =5, σ = 0.5, σd = 0.001 and α =2
.
Figure 2 Variation of carrier wave frequency (ω) with propagation
constant (k) for fast and slow mode for three different values of κe = 2
(solid line), κe= 3 (dotted line), κe = 5 (dashed line) with μi= 0.8, μe = 0.2,
κi = 5, σ = 0.5, σd = 0.001 and α =2.
Figure 3 Variation of phase velocity of fast mode (λf) with spectral index
of ions (κi) for three different values of σ = 0.5 (solid line), σ = 0.7 (dotted
line), σ = 0.9 (dashed line) with μi= 0.8, μe= 0.2, κe=3, σd = 0.001 and α
Distributed Electrons And Ions
The phase velocity of slow mode also increases with increase in spectral indices of ions and electrons and decreases with increase in ion to electron temperature ratio (not shown here). Considering the next-order in
, we obtain a system of equations in second-order of perturbed quantities. Solving this system of equations, we obtain the following K-dV equation0 3 3 B A (11)
Where A is nonlinear and B is dispersion coefficient and are given as
4 2 2 2 2 2 3 2 2 2 3 2 2 2 2 4 2 3 2 3 2 2 3 3 2 3 3 d d i e d d d b a A (12)
4 2 2 2 2 2 3 2 3 2 3 d d B (13)The steady state solution of K-dV equation (11) is obtained by transformation of the independent variables ξ and τ as η= ξ - vτ (where v is constant speed normalized by C1) and imposing
boundary conditions (viz.
0
,
0
,
20
2
at
). The wave solution is
20
sec
h
(14)
Where the amplitude ψ0 and width Δ of solitons is given by
A
v
3
0
andv
B
4
As observed from equation (12) and (13), A and B are the functions of various parameters including kappa indices of ions and electrons , dust temperature ratio, dust density ratio and ion
to electron temperature ratio. Hence the effect of these parameters will be discussed in detail in the next section.
DISCUSSION OF NUMERICAL RESULTS
We have investigated the effects of kappa distributed electrons and ions, dust temperature ratio and dust density ratio on the wave propagation of solitary waves in dusty plasma. To describe the nonlinear propagation of the solitary waves, we have derived a K-dV equation (11) by using Reductive Perturbation Method and obtained solitary wave solution. From the value of phase velocity given by equation (10), it is clear that we have two types of wave modes (Fast and Slow wave mode) in dusty plasma system.
Fast mode analysis
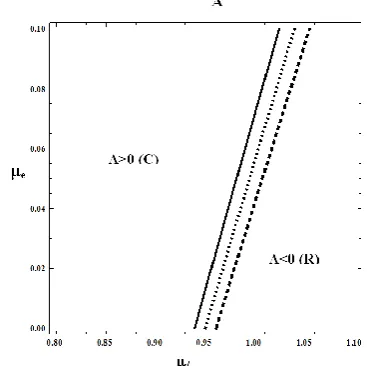
Contour plot of nonlinear coefficient A for fast mode in μi -μe
space for three different values of dust temperature ratio (σd)
keeping other parameters as κi = 2, κe= 3, σ = 0.5 and α = 2
(Fig 5).
For given μe , a transition from compressive to rarefactive
potential structures takes place. The region A > 0 (C-region) corresponds to positive potential structures or compressive solitons and A < 0 (R - Region) negative potential structures or rarefactive solitons respectively. The region of compressive soliton increases with increase in dust temperature ratio
d This is to be mentioned here that our result is completely in agreement with findings of Pakzad (2011).The effect of spectral index of ions and electrons in C- region is depicted (Fig 6). Here a plot of peak amplitude of fast solitary potential structures has been given as a function of κi for three
different values of κe = 2, 3, 5. The peak amplitude Ψ0/f increase
with spectral index of ions and decrease with spectral index of electrons. An exactly a similar kind of bahaviour is observed for R-region (not shown here). It may be mentioned that this behaviour is in agreement with Alam et al (2013).
Figure 4 Variation of phase velocity of fast mode (λf) with spectral index
of electrons (κe) for three different values of σ = 0.5 (solid line), σ = 0.7
(dotted line), σ = 0.9 (dashed line) with μi= 0.8, μe= 0.2, κi= 3, σd = 0.001
and α=2.
Figure 5 Contour plot of nonlinear coefficient (A) for fast mode in μi – μe
space for three different values of σd = 0.001 (solid line), σd = 0.007
(dotted line), σd = 0.013 (dashed line) with κi = 2, κe= 3, σ = 0.5 and
In order to investigate the effect of dust temperature and dust grain density, a plot of Ψ0/f Vs. σd has been displayed in Fig 7,
the other parameters are taken as with μi = 0.8, μe = 0.2, κi= 3,
κe= 5, σ = 0.5 for three different values of α = 2, 2.2, 2.4.
From Fig 7, the peak amplitude of fast solitary structures in C -region decreases with dust grain density ratio (α) and dust temperature ratio (σd). The behaviour of rarefactive fast
solitons for parameters α and σd is same as for compressive
solitons (not shown here). The decrease in amplitude of solitons for dust grain density ratio (α) is also observed by Chatterjee et al (2009) and Gill et al (2011).
Slow mode analysis
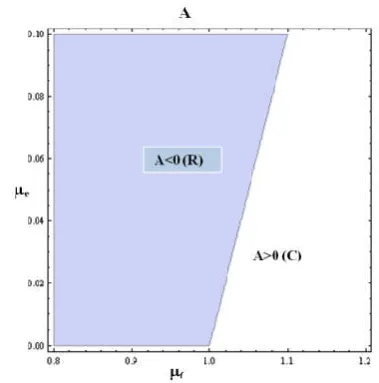
Region plot of nonlinear coefficient (A) for slow mode in μi –
μespace is shown in the Fig 8 keeping other parameters as κi=
2, κe =3, σ = 0.5, σd= 0.001 and α =2.
For given μe , a transition from rarefactive to compressive
potential structures takes place. The shaded portion corresponds to A < 0 (R-region) and white portion to A > 0 (C- Region) respectively. The behaviour of transition is just opposite to that observed for fast mode. The shaded region R (A < 0) corresponds to negative potential structures or rarefactive solitons while region C (A > 0) corresponds to positive potential structures or compressive solitons. The region of rarefactive solitons is not affected with rise in dust temperature ratio (σd) for slow mode.
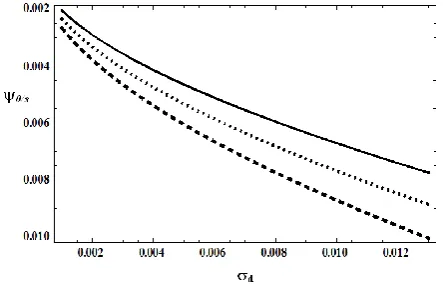
For C-region, a plot of peak amplitude of solitary potential structures Ψ0/s as a function of spectral index of ions κi has been
given in Fig 9 for three different values of κe = 1.6, 1.7, 1.9.
The other parameters are kept as μi= 1.1, μe = 0.02, σ = 0.5, σd
= 0.001, α= 2. From the Figure 9, the peak amplitude decreases with increase in κi and κe .It may be noted that this behaviour is
similar to that increased for fast mode potential structures in C -region.
Figure 6 Variation of amplitude for fast mode (Ψ0/f) with spectral index
of ions (κi) for three different values of κe= 2 (solid line), κe= 3 (dotted
line), κe= 5 (dashed line) with μi= 0.8, μe= 0.2, σ = 0.5, σd = 0.001 and
α=2.
Figure 7 Variation of amplitude for fast mode (Ψ0/f) with dust
temperature ratio (σd) for three different values of α = 2 (solid line), α =
2.2 (dotted line), α = 2.4 (dashed line) with μi = 0.8, μe = 0.2, κi= 3, κe= 5
and σ = 0.5.
Figure 8 Contour plot of nonlinear coefficient (A) for slow mode in μi
-μe space for three different values of κi= 2, κe =3, σ = 0.5, σd= 0.001 and
α =2.
Figure 9 Variation of amplitude for slow mode (Ψ0/s) with spectral index
of ions (κi)for three different values of κe= 1.6 (solid line), κe= 1.7
(dotted line), κe= 1.9 (dashed line) with μi= 1.1, μe = 0.02, σ = 0.5,
σd = 0.001 and α= 2.
Figure 10 Variation of amplitude for slow mode (Ψ0/s) with spectral
index of ions (κi) for three different values of κe = 2 (solid line), κe = 3
(dotted line), κe= 5 (dashed line) with μi = 0.8, μe= 0.2, σ = 0.5, σd =
Distributed Electrons And Ions
However for R-region, the amplitude of rarefactive solitons increases with increase in spectral indices of ions (κi) and
electrons (κe)as shown in Fig 10. This behaviour is similar to
that observed by Alam et al (2013). Both slow and fast rarefactive solitary structures have similar behaviour for spectral index of ions (κi) and opposite behaviour for spectral
index of electrons (κe).
To investigate the effect of dust temperature ratio and dust grain density on the dynamics of solitary potential structures in slow mode, we have plotted peak amplitude are function of dust temperature ratio (σd) for three different values of α in Fig
11 (C-region) and Fig 12 (R-region) respectively.
For C-region, the amplitude of potential structures increase with dust temperature ratio (σd) and dust grain density ratio (α).
This behaviour is opposite to the one obtained for fast mode. It is further mentioned that the behaviour of dust grain density ratio is opposite to that observed by Chatterjee et al (2009) and Gill et al (2011).
However, from the similar plot for R-region (as shown in Fig 12) an entirely opposite trend is observed. Here peak amplitude decreases with both σd and α. In other words, we can say this
region of R-region is similar to one obtained in case of fast mode. A similar kind of behaviour is also observed by El-Hanbaly et al (2016) in their investigations.
CONCLUSIONS
In this paper, we have considered an unmagnetized dusty plasma system made of positively charged warm adiabatic dust and negatively charged cold dust with both kappa distributed ions and electrons. The properties of solitary waves in dusty plasma are discussed numerically.
The important findings that we obtained from our investigation can be summarized as follows
1. The present dusty plasma model supports both compressive and rarefactive solitary waves in fast and slow mode.
2. The carrier wave frequency of fast and slow mode increases with increase in wave propagation constant. 3. The carrier wave frequency of fast mode increase with
increase in kappa indices of electrons and ions. But there is no effect of kappa parameters on carrier wave frequency of slow mode.
4. The phase velocity of both fast and slow modes increases with increase in kappa indices of ions and electrons and decreases with increase in ion to electron temperature ratio.
5. For fast mode, the transition from compressive to rarefactive solitons takes place. The amplitude of both compressive and rarefactive solitons increases with increase in kappa index of ions and decreases with increase in kappa indices of ions and electrons. It decreases with increase in dust temperature ratio and dust density ratio.
6. For slow mode, the transition from rarefactive to compressive solitons takes place. The amplitude of compressive solitons decreases with increase in kappa indices of ions and electrons; increases with increase in dust temperature ratio and dust density ratio while the amplitude of rarefactive solitons increases with increase in kappa indices of ions and electrons but decreases with increase in dust temperature ratio and dust density ratio. It decreases with increase in dust temperature ratio and dust density ratio.
The results which, have been obtained from this investigation, would be useful in understanding the properties of solitary potential structures in laboratory and in space dusty plasmas. The present results may be useful for understanding the existence of nonlinear potential structures that are observed in different regions of space (viz. solar wind, interstellar medium, auroral zone) and in laboratory dusty plasma devices.
References
Alam, M. S., Masud, M. M., Mamun, A. A. (2013). Effects of bi-kappa distributed electrons on dust-ion acoustic shock waves in dusty superthermal plasmas. Chinese Physics B, 22: 115202.
Alam, M. S., Masud, M. M.; Mamun, A. A. (2014). Ion-Scale Electrostatic Nonplanar Shock Waves in Dusty Plasmas with Two-Temperature Superthermal Electrons. Brazilian Journal of Physics, 45: 95-101.
Figure 11 Variation of amplitude for slow mode (Ψ0/s) with dust
temperature ratio (σd) for three different values of α = 2 (solid line), α =
2.2 (dotted line), α = 2.4 (dashed line) with μi = 1.1, μe= 0.02, κi = 3, κe =
5 and σ = 0.5.
Figure 12 Variation of amplitude for slow mode (Ψ0/s) with dust
temperature ratio (σd) for three different values of α = 2 (solid line), α =
2.2 (dotted line), α = 2.4 (dashed line) with μi = 0.8, μe = 0.2, κi = 3, κe =
Angelo, N. D. (2001). Excitation of dust lower hybrid waves in a collisional dlusty plasma. Physics Letter A, 292: 3. Angelo, N. D. (2002). Electrostatic dust-cyclotron waves in
plasmas with opposite polarity grains. Planetary and Space Science, 50: 375-78.
Bains, A. S., Tribeche, M., Ng, C. S. (2013). Dust-acoustic wave modulation in the presence of q-nonextensive electrons and/or ions in dusty plasma. Astrophysics and Space Science, 343: 621-628.
Barkan, A., Merlino, R. L., Angelo, N. (1995). Laboratory observation of the dust-acoustic wave mode. Physics of Plasmas, 2: 3563-3565.
Barkan, A., Merlino, R. L., Angelo, N. (1995). Laboratory observation of the dust-acoustic wave mode. Physics of Plasmas, 2: 3563-3565.
Bouchule, A. Dusty Plasmas, Wiley, New York (1999). Chatterjee, P., Mondal, G., Roy, K., Muniandy, S. V., Yap, S.
L., Wong, C. S. (2009). Generation of a dressed soliton in a four-component dusty plasma with nonthermal ions. Physics of Plasma, 16: 072102.
Chow, V. W., Mendis, D. A., Rosenberg, M. (1993). Role of grain size and paricle velocity distribution in secondary electron emission in space plasmas. Journal of Geophysical Research, 9: 19065.
Chu, J. H., Du, J. B., Lin, I. (1994). Coulomb solids and low- frequency fluctuations in RF dusty plasmas. Journal of Physics D, 27: 296.
El-Hanbaly, A. M., El-Shewy, E. K., Kassem, A. I., Darweesh, H. F. (2016). Nonlinear Electron Acoustic Waves in Dissipative Plasma with Superthermal Electrons. Applied Physics Research, 8: 64-80.
Gardner, C. S.; Morikawa, G. K. (1960). Similarity in the asymptotic behaviour of collision free hydromagnetic waves and water waves. Courant Institute of Mathematical Sciences, New York, University, Report NYO-9082. Gill, T. S., Bedi, C., Saini, N. S. (2011). Higher order nonlinear
effects on wave structures in a four-component dusty plasma with nonisothermal electrons. Physics of Plasmas, 18: 043701.
Goertz, C. K. (1989). Dusty plasma in the solar system. Review of Geophysics, 27: 271-292.
Homann, A., Melzer, A., Peters, S., Madani, R., Piel, A. (1997). Laser-excited dust lattice waves in plasma crystals. Physics Letter A, 242: 173-80.
Horanyi, M. (1996). Charged dust dynamics in the Solar System. Annual Review of Astronomy and Astrophysics, 34: 383.
Horanyi, M., Mendis, D. A. (1985). Trajectories of charged dust grains in the cometary environment. Journal of Astrophysics, 294: 357-368.
Horanyi, M., Morfill, G., Grun, E. (1993). Mechanism for the acceleration and ejection of dust grains from Jupiter’s magnetosphere. Nature, 363: 144-46.
Mahmood, S.; Saleem, H. (2003). Dust acoustic solitary wave in the presence of dust streaming. Physics of Plasmas, 10: 47.
Mamun, A. A., Cairns, R. A., Shukla, P. K. (1996). Solitary potentials in dusty plasmas. Physics of Plasmas, 3: 702-04. Mamun, A. A.; Shukla, P. K. Introduction to Dusty Plasma
Physics. Bristol, Institute of Physics Publications (2002). Mandal, G., Roy, K., Chatterjee, P. (2009). Large amplitude
double layers in a four component dusty plasma with non-thermal ions. Indian Journal of Physics, 83: 365.
Mendis, D. A. (2002). Progress in the study of dusty plasmas. Plasma Sources Science and Technology, 11: 3A.
Mendis, D. A.; Rosenberg, M. (1994). Cosmic Dusty Plasma. Annual Review of Astronomy and Astrophysics, 32: 419-463.
Mendis, D. A.; Rosenberg, M. (1994). Cosmic dusty plasma. Annual Review of Astronomy and Astrophysics, 32: 419-63. Merlino, R. L., Barkan, A., Thompson, C., Angelo, N. D. (1985). Laboratory studies of waves and instabilities in dusty plasmas. Physics of Plasmas, 5: 1607-1614.
Pakzad, H. R. (2011). Rarefactive and Compressive Solitons in Warm Dusty Plasma with Electrons and Nonthermal Ions. International Journal of Mathematical, Computatinal, Physical, Electical and Computer Engineering, 5: 1525-1529.
Rahmann, O. (2017). Multi-component Dust-ion-acoustic Solitary and Shock Waves in an Unmagnetized Dusty Plasma with Kappa Distributed Superthermal Electrons. Advances in Astrophysics, 2: 126-140.
Rao, N. N., Shukla, P. K., Yu, M. Y. (1990). Dust-acoustic waves in dusty plasmas. Planetary and Space Science, 38: 543-546.
Roychoudhury, R.; Mukherjee, S. (1997). Large-amplitude solitary waves in finite temperature dusty plasma. Physics of Plasmas, 4: 2305.
Sakanaka, P. H.; Shukla, P. K. (2000). Large Amplitude Solitons and Double Layers in Multicomponent Dusty Plasmas. Physica Scripta, 2000; T84.
Sayad, F.; Mamun, A. A. (2007). Solitary potential in a four-component dusty plasma. Physics of Plasmas, 14: 014501. Selwyn, G. S. (1993). A Phenomenlogical Study of Particulates
in Plasma Tools and Processes. Japanese Journal of Applied Physics, 32: 3068 .
Shukla, P. K. (2001). A survey of dusty plasma physics. Physics of Plasmas, 8: 1791-1803.
Shukla, P. K.; Mamun, A. A. Introduction to Dusty Plasma Physics. Bristol: Institute of Physics Publication (2000). Thomas, H., Morfill, G. E., Dammel, V. (1994). Plasma
Crystal: Coulomb Crystallization in Dusty Plasma. Physical Review Letters, 73: 652.
Vasyliunas, V. M. (1968). Low energy electrons on the day side of the magnetosphere. Journal of Geophysical Research, Space Physics, 73: 7519-7523.
Versheet, F. (1996). Waves and instabilities in dusty space plasmas.Space Science Reviews, 77: 267-302.
Versheet, F. Waves in Dusty Space Plasmas, Kluwer, Dordrecht (2000).